Join 307,012+ Monthly Readers


Get Free and Instant Access To The Banker Blueprint : 57 Pages Of Career Boosting Advice Already Downloaded By 115,341+ Industry Peers.
- Break Into Investment Banking
- Write A Resume or Cover Letter
- Win Investment Banking Interviews
- Ace Your Investment Banking Interviews
- Win Investment Banking Internships
- Master Financial Modeling
- Get Into Private Equity
- Get A Job At A Hedge Fund
- Recent Posts
- Articles By Category
The DCF Model: The Complete Guide… to a Historical Relic?
If you're new here, please click here to get my FREE 57-page investment banking recruiting guide - plus, get weekly updates so that you can break into investment banking . Thanks for visiting!

It may be an understatement to say that we live in “interesting times.”
Cryptocurrencies based on dog memes suddenly spike up or down by 500%, people think that meme stocks are better investments than high-dividend stocks, and growth-oriented tech stocks seem to rise forever, all based on promises of “profits in the future – the distant future.”
In this environment, it’s fair to ask if the discounted cash flow (DCF) analysis and DCF models are still relevant at all.
I’ll address this question at the end of this article, but the short answer is that the DCF model still matters – but perhaps less so for a tiny percentage of overhyped companies and less so in crazed market environments.
But let’s start by describing each step of the analysis and giving you a few simple examples:
DCF Model: Video Tutorial and Excel Templates
If you’d prefer to watch rather than read, you can get this [very long] tutorial below:
Table of Contents:
- 2:29: The Big Idea Behind a DCF Model
- 5:21: Company/Industry Research
- 8:36: DCF Model, Step 1: Unlevered Free Cash Flow
- 21:46: DCF Model, Step 2: The Discount Rate
- 28:46: DCF Model, Step 3: The Terminal Value
- 34:15: Common Criticisms of the DCF – and Responses
And here are the relevant files and links:
- Walmart DCF – Corresponds to this tutorial and everything below.
- Walmart 10-K Excerpts .
- Slide presentation for this tutorial .
- Uber Valuation and DCF – Different DCF model for a high-growth company (sort of).
- Snap Valuation and DCF – Different DCF model for a different high-growth company.
The Big Idea Behind a DCF Model
The big idea is that you can use the following formula to value any asset or company that generates cash flow (whether now or “eventually”):

The “Discount Rate” represents risk and potential returns – a higher rate means more risk, but also higher potential returns.
A company is worth more when its cash flows and/or cash flow growth rate are higher, and it’s worth less when those are lower.
The company is also worth less when it is riskier or when expectations for it are higher, i.e., when the Discount Rate is higher.
If a company’s Discount Rate and Cash Flow Growth Rate stayed the same forever, then investment analysis would be simple: just plug the numbers into this formula.
But that never happens!
Companies grow and change over time, and often they are riskier with higher growth potential in earlier years, and then they mature and become less risky later on.
Valuation is more than this simple formula because companies’ Discount Rates and Cash Flow Growth Rates change over time.
To represent that change, you divide companies’ lifecycles into two periods:
- Period #1 (Explicit Forecast Period): The company’s Cash Flow, Cash Flow Growth Rate, and potentially even the Discount Rate change over 5, 10, 15, or 20+ years, but the company reaches maturity or “stabilization” by the end.
- Period #2 (Terminal Period): The Discount Rate and Cash Flow Growth Rate stop changing because the company is mature. Its Cash Flow will still change, but the valuation formula above works because it requires only the first year of Cash Flow in this period.
You value the company in both these periods and then add the results to get its total value from today into “infinity” (AKA until the Present Value of its cash flows falls to near-0).
Company/Industry Research
Before you jump into Excel and start entering numbers, you should do a bit of company and industry research to establish the following:
- What are the top 5-10 most important drivers for the company?
- How can you project its revenue beyond a simple percentage growth rate? What about its expenses?
- What do its historical trends look like, ideally going back 5-10 years?
The company’s annual report and investor presentations are the best starting points.
You could also search for industry data from companies like IDC , Gartner , and Forrester , but it’s not necessary for a quick analysis of a mature company.
And if you are dealing with a rapidly changing company or a tech startup (e.g., Uber or Snap), it’s often more useful to get KPIs and financial stats from similar companies that were once growing quickly but have since matured.
In theory, you could spend days, weeks, or months on industry and company research, but that much effort is not necessary.
We recommend reading through the annual report and investor presentation to the extent that you can come up with those 5-10 key drivers .
For Walmart, we came up with the following:

Its annual filing repeatedly cited its total square feet, so we made the total retail square feet the top-line driver and based other numbers on $ per square foot figures.
DCF Model, Step 1: Unlevered Free Cash Flow
While there are many types of “Free Cash Flow,” in a standard DCF model, you almost always use Unlevered Free Cash Flow (UFCF) , also known as Free Cash Flow to Firm (FCFF) , because it produces the most consistent results and does not depend on the company’s capital structure.
Unlevered Free Cash Flow should include:
- COGS and Operating Expenses
- Depreciation & Amortization and sometimes other non-cash adjustments*
- The Change in Working Capital
- Capital Expenditures
*Depreciation & Amortization gets a bit more complicated, especially if you’re analyzing a company that follows IFRS (see the next section).
This list means that you ignore almost everything else: Net Interest Expense, Other Income / (Expense), most non-cash adjustments, most of the Cash Flow from Investing section, and the Cash Flow from Financing section.
For Walmart, many of the items in UFCF are simple $ per square foot figures:

To calculate UFCF, start with Revenue and subtract COGS , OpEx, and Taxes (which are now different since they’re based on Operating Income ).
Then, add back D&A, factor in Deferred Taxes, any other recurring operating activities, and the Change in Working Capital, and subtract CapEx:

In some cases, we recalculate items such as Deferred Taxes because we’re modifying the company’s historical Taxes to make them comparable to future Taxes.
Most of these items should be fairly low as percentages of revenue or the change in revenue.
For example, it would be highly unusual if the Change in Working Capital represented 50% of a company’s UFCF.
For most companies, Working Capital is not a major value driver because it represents simple timing differences.
We also made sure that CapEx as a percentage of revenue stays ahead of D&A as a percentage of revenue in each year because Walmart’s cash flows are growing .
Even if the growth is modest, the company will need to increase its Net PP&E over time to support that growth.
If you don’t know what some of these items mean, please see our coverage of the Change in Working Capital and Unlevered Free Cash Flow for more details.
It would also help to know a bit about the company’s operating leverage to forecast some of the expenses, but it’s not essential for a quick analysis.
But Wait! What About Operating Leases in DCF Models?
Accounting for operating leases has become more complicated with the introduction of IFRS 16 in 2019, which required companies to put Operating Lease Assets and Liabilities directly on their Balance Sheets (see: our full tutorial to lease accounting ).
The equivalent rules under U.S. GAAP aren’t too bad because U.S. companies still record Rent as a simple operating expense on their Income Statements.
Under IFRS, however, Rent is split into an Amortization or Depreciation element and an Interest element, similar to the treatment for Finance Leases.
Over a large portfolio of leases with different start and end dates, the Lease Amortization + Lease Interest is about the same as the Rental Expense under U.S. GAAP.
The goal in a DCF is to reflect the company’s cash revenue , cash expenses , and cash taxes , so we believe the best approach is to deduct the entire Operating Lease Expense in UFCF.
For IFRS-based companies, that means you’ll have to deduct the Interest element in the EBIT and NOPAT calculations:

Also, you should not add back the Operating Lease Depreciation or Amortization because in this case, it represents part of an actual cash expense .
If you follow this treatment, the UFCF number will reflect the deduction for the full Lease Expense.
Some argue that you should add back the entire Lease Expense and count Operating Leases as an item in the Equity Value to Enterprise Value bridge.
We don’t favor that approach because UFCF does not reflect the company’s cash expenses if you do that, and it’s more difficult to compare companies that way.
DCF Model, Step 2: The Discount Rate
Once you’ve projected the company’s Unlevered Free Cash Flows, you need to discount them to their Present Value : what they’re worth today.
That value today depends on how much you could earn with your money in other, similar companies in this market, i.e., your expected, average annualized returns.
The Discount Rate expresses these expected, average annualized returns, and in an Unlevered DCF, it’s equal to WACC, or the “ Weighted Average Cost of Capital .”
The name means what it sounds like: you estimate the “cost” of each form of capital the company has, weigh them by their percentages, and then add them up.
“Capital” means “a source of funds.” So, if a company borrows money in the form of Debt to fund its operations, that Debt is a form of capital.
And if it goes public in an IPO, the shares it issues, called “Equity,” are also a form of capital.
The exact formula is:
WACC = Cost of Equity * % Equity + Cost of Debt * (1 – Tax Rate) * % Debt + Cost of Preferred Stock * % Preferred Stock
The Cost of Equity represents potential returns from the company’s stock price and dividends, or how much it “costs” the company to issue shares.
For example, if the company’s dividends are 3% of its current share price (i.e., the dividend yield is 3%), and its stock price has increased by 6-8% each year historically, its Cost of Equity might be between 9% and 11%.
The Cost of Debt represents returns on the company’s Debt, mostly from interest, but also from the market value of the Debt changing.
For example, if the company is paying a 6% interest rate on its Debt, and the market value of its Debt is close to its face value, then the Cost of Debt might be around 6%.
You also multiply that by (1 – Tax Rate) because Interest paid on Debt is tax-deductible. So, if the Tax Rate is 25%, the After-Tax Cost of Debt would be 6% * (1 – 25%) = 4.5%.
The Cost of Preferred Stock is similar because Preferred Stock works similarly to Debt, but Preferred Stock Dividends are not tax-deductible, and overall rates tend to be higher, making it more expensive.
The Discount Rate in Real Life vs. Simple Approximations
The calculations for the Cost of Debt and Preferred Stock are straightforward, but the Cost of Equity is more challenging because it’s subjective and depends on how other, similar companies have performed relative to the market.
In many DCF models, you’ll see a sheet dedicated to this calculation, where the modeler “un-levers Beta” for each peer company to estimate its risk/volatility independent of its capital structure and then re-levers it for the subject company:

The problem with this approach is that you need quick access to data for comparable companies, which may be tricky without Capital IQ, FactSet, or similar services.
Luckily, there is a “shortcut method” as well, which involves using the same formula but simplifying the last input:
Cost of Equity = Risk-Free Rate + Equity Risk Premium * Levered Beta
The Risk-Free Rate (RFR) is what you might earn on “safe” government bonds in the same currency as the company’s cash flows (so, U.S. Treasuries here).
The Equity Risk Premium (ERP) is the percentage the stock market is expected to return each year, on average, above the yield on these “safe” government bonds.
And Levered Beta tells you how volatile this stock is relative to the market as a whole, factoring in both business risk and risk from leverage (Debt).
If it’s 1.0, then the stock follows the market perfectly and goes up by 10% when the market goes up by 10%; if it’s 2.0, the stock goes up by 20% when the market goes up by 10%.
Rather than finding comparable companies and un-levering and re-levering Beta, you could just look it up for the company on Yahoo Finance:

You can then combine it with easy-to-find data on 10-year U.S. Treasury yields and the Equity Risk Premium from Damodaran’s collection (or other sources – there are plenty of estimates for the current ERP in different markets):
The Discount Rate is around 4.0% with this approach (assuming ~90% Equity and ~10% Debt for Walmart), close to the 4.37% in the full model.
Sure, you could make it more complicated, but I would argue it’s a waste of time in a case study or modeling test unless they specifically ask for it.
The important part is that the company’s Discount Rate is closer to 5% than 10% or 15%, so we can use a range of values with 5% in the middle.
Also, you can now use this Discount Rate to take the Present Value of each UFCF (PV = UFCF / ((1 + Discount Rate) ^ Year #):

DCF Model, Step 3: The Terminal Value
The Terminal Value goes back to the “big idea” behind a DCF model.
Put simply, the “Company Value” in this formula:
IS the Terminal Value – assuming that each input represents the Terminal Period in the DCF model.
To calculate it, you need to get the company’s first Cash Flow in the Terminal Period and its Cash Flow Growth Rate and Discount Rate in that Terminal Period.
In an Unlevered DCF, this formula becomes:
Terminal Value = Unlevered FCF in Year 1 of Terminal Period / (WACC – Terminal UFCF Growth Rate)
And you can estimate the UFCF in Year 1 of the Terminal Period like this:
Terminal Value = UFCF in Final Year of Explicit Forecast Period * (1 + Terminal UFCF Growth Rate) / (WACC – Terminal UFCF Growth Rate)
This “Terminal Growth Rate” should be low : below the long-term GDP growth rate, especially in developed countries.
You could also estimate the Terminal Value with an EBITDA multiple based on median multiples from the comparable companies, but we don’t recommend that as the primary method.
It’s too easy to pick multiples that imply ridiculous Terminal FCF Growth Rates, so it’s safer to start with the growth rates and then check their implied multiples .
Once you have the Terminal Value, you can discount it back to Present Value and add it to the Sum of the Present Values of the Free Cash Flows:

And then, you can back into the Implied Equity Value and Implied Share Price from there:

You can also set up a sensitivity analysis in Excel to assess what the company’s valuation looks like with different assumptions for the Terminal Growth Rate, Terminal Multiple, Discount Rate, and so on:

One Final Note: This Terminal FCF Growth Rate should be fairly close to the UFCF growth rate in the final year of the explicit forecast period.
You don’t want UFCF to grow at 10% or 20% and suddenly drop to 2% in the Terminal Period.
If it does, you need to re-think your assumptions or extend the analysis.
Because of this problem, we extended the explicit forecast period to 20 years in the Uber valuation .
Conclusions from This DCF Model
Overall, Walmart seems modestly undervalued because its implied share price in most of the sensitivity tables is above its current share price of ~$140.
There is one problem with this analysis, though: we’re assuming that Walmart keeps growing its retail square feet, even though that number has been declining in recent years.
Therefore, if we had more time and resources, we might create a few operating scenarios, similar to the Uber and Snap models, to assess the results in “growth” vs. “stagnant” vs. “decline” cases.
Common Criticisms of the DCF Model – and Responses
People often criticize the DCF model for the following reasons:
- “But how can you possibly predict a company 5, 10, or 15 years into the future? No one can!”
- “The DCF is too sensitive to small changes in assumptions, such as growth rates and margins.”
- “A DCF ignores market conditions and comparable companies, so it might not give you the accurate market value.”
- “The DCF is no longer applicable because stocks are valued based on memes / crypto / Reddit! No one cares about cash flow.”
My response to the first three objections is similar: it’s not about the exact numbers but ranges, scenarios, and sensitivities .
No, you don’t know whether the Year 10 growth rate will be 10% or 8% or 12%, but you should have an idea of whether it will be closer to 10% or 20%.
And if you don’t, it’s fine to build a DCF with a wide valuation range that reflects high uncertainty.
The complaint about a DCF being “too sensitive” raises other questions: for example, is the FCF growth rate in the final year of the explicit forecast period close to the Terminal FCF Growth Rate?
If not, you need to re-think your assumptions or extend the projections.
And the critique about ignoring market conditions conveniently ignores that the Discount Rate is always based on current market conditions, no matter how you calculate it.
The DCF is indeed less reflective of the current market than comparable company analysis (for example), but it still reflects some market conditions.
And finally, for the crypto/meme/Reddit objection: yes, I agree that certain stocks seem to defy all logic and cash flow-based analysis.
That said, these stocks represent a tiny fraction of all the public companies worldwide.
The media gives them excessive attention, but they ignore the hundreds of thousands (millions?) of other companies that follow some semblance of logic.
And as for crypto, I agree that you cannot use a DCF to value Bitcoin, Ethereum, or Dogecoin.
But this is nothing new: a DCF only works for assets that generate cash flow , whether now or in the future.
No one has ever suggested valuing gold or silver with a DCF, and I’m not sure how crypto is any different in this regard.
DCF Models: Further Learning
If you want to learn more about DCF models and get a step-by-step walkthrough in more detail, sign up for our free financial modeling tutorials .
These tutorials provide a 3-part series on the valuation of Michael Hill, a retailer in Australia and New Zealand, and they go into each step in more depth than we did above.
And if you want in-depth case studies backed by real-world data and research, the Core Financial Modeling course delves into valuation/DCF analysis in even greater detail:
Core Financial Modeling
Learn accounting, 3-statement modeling, valuation/DCF analysis, M&A and merger models, and LBOs and leveraged buyout models with 10+ global case studies.
A few modules are dedicated to valuation and DCF analysis, and there are example company valuations in other industries.
If you want even more complex examples, the Advanced Financial Modeling course might be more appropriate since it deals with topics like the mid-year convention, stub periods, a normalized terminal year, and net operating losses in a DCF:

Advanced Financial Modeling
Learn more complex "on the job" investment banking models and complete private equity, hedge fund, and credit case studies to win buy-side job offers.

About the Author
Brian DeChesare is the Founder of Mergers & Inquisitions and Breaking Into Wall Street . In his spare time, he enjoys lifting weights, running, traveling, obsessively watching TV shows, and defeating Sauron.
Free Exclusive Report: 57-page guide with the action plan you need to break into investment banking - how to tell your story, network, craft a winning resume, and dominate your interviews
Learn Valuation and Financial Modeling
Get a crash course on accounting, 3-statement modeling, valuation, and M&A and LBO modeling with 10+ global case studies.
Investment Strategy
Discounted Cash Flow Analysis: Complete Tutorial With Examples

Calculating the sum of future discounted cash flows is the gold standard to determine how much an investment is worth.
This guide show you how to use discounted cash flow analysis to determine the fair value of most types of investments, along with several example applications.
You can either start here from the beginning, or jump to the specific section you want:
- Discounted cash flows 101: how it works
- Business example using discounted cash flows
- Project example using discounted cash flows
- Bond pricing example using discounted cash flows
- A streamlined stock valuation method
- Limitations of discounted cash flow analysis
How to do Discounted Cash Flow (DCF) Analysis
The discounted cash flow method is used by professional investors and analysts at investment banks to determine how much to pay for a business, whether it’s for shares of stock or for buying a whole company.
And it’s also used by financial analysts and project managers in major companies to determine whether a given project will be a good investment, like for a new product launch or a new manufacturing facility.
It’s applicable to any scenario where you are considering paying money now in expectation of receiving more money in the future.
I’ve personally used it both for engineering projects and stock analysis.
Put simply, discounted cash flow analysis rests on the principle that an investment now is worth an amount equal to the sum of all the future cash flows it will produce, with each of those cash flows being discounted to their present value.
Here is the equation:

Let’s break that down.
- DCF is the sum of all future discounted cash flows that the investment is expected to produce. This is the fair value that we’re solving for.
- CF is the total cash flow for a given year. CF1 is for the first year, CF2 is for the second year, and so on.
- r is the discount rate in decimal form. The discount rate is basically the target rate of return that you want on the investment.
And we’ll start with an example. If a trustworthy person offered you $1,500 in three years, and asked how much you’re willing to pay for that eventual reward today, how much would you offer?
To answer that question, you need to translate that $1,500 into its value to you today.
For example, if you had $1,000 today, and compounded it at 14.5% per year, it would equal about $1,500 in three years:

Alternatively, if you had $1,200 today, and compounded it at just 7.7% per year, it would equal about $1,500 in three years:

So, the amount that $1,500 three years from now is worth to you today depends on what rate of return you can compound your money at during that period. If you have a target rate of return in mind, you can determine the exact maximum that you should be willing to pay today for the expected return in 3 years.
That’s what the DCF equation does; it translates future cash flows that you will likely receive from an investment into their present value to you today, based on the compounded rate of return you could reasonably achieve with your money today.
When you’re buying shares of stock, or a whole business, or real estate, or trying to figure out which project to invest in out of several options, analyzing the expected discounted cash flows can help you decide which investments are worthwhile and which ones are not.
If you find that you can buy an investment for a price that is below the sum of discounted cash flows, you may be looking at an undervalued (and therefore potentially very rewarding!) investment. On the other hand, if the price is higher than the sum of discounted cash flows that its expected to produce, that’s a strong sign that it may be overvalued.
Now let’s go over a bunch of example applications.
How to Determine the Fair Value of a Business
Suppose you were offered a private deal to buy a 20% stake in a local business that has been around for decades, and you know the owner well.
The business has been passed down through three generations and is still going strong with a growth rate of about 3% per year. It currently produces $500,000 per year in free cash flows, so this investment into a 20% stake will likely give you $100,000 per year in cash, and will likely grow at a 3% rate per year.
How much should you pay for that stake?
This year, the business will give you $100,000. Next year, it’ll give you $103,000. The year after that, it’ll give you $106,090. And so on, assuming your growth estimates are accurate.
The stake in the business is worth an amount of money equal to the sum of all future cash flows it’ll produce for you, with each of those cash flows being discounted to their present value.
Since this is a private business deal with low liquidity, let’s say that your target compounded rate of return is 15% per year. If that’s a rate of return you know you can achieve on other investments, you would only want to buy this business stake if you can get it for a low enough price that it’ll give you at least that rate of return. Therefore, 15% becomes the compounded discount rate that you apply to all future cash flows.
So, let’s do the equation:

“DCF” in that equation is the variable we are solving for. That’s the sum of all future discounted cash flows, and is the maximum amount you should pay for the business today if you want to get a 15% annualized return or higher for a long time.
The numerators represent the expected annual cash flows, which in this case start at $100,000 for the first year and then grow by 3% per year forever after.
The denominators convert those annual cash flows into their present value, since we divided them by a compounded 15% annually.
Here’s a table for the first five years, showing that even as the actual expected cash flows will keep growing, the discounted versions of those cash flows will shrink over time, because the discount rate is higher than the growth rate:

You can use Excel or any other spreadsheet program to carry that pattern out indefinitely. Here’s the chart of the first 25 years:

The dark blue lines represent the actual cash flows that you’ll get each year for the next 25 years, assuming the business grows as expected at 3% per year. As you go onto infinity, the sum of all the cash flows will also be infinite.
The light blue lines represent the discounted versions of those cash flows.
For example, on year 5 you’re expected to receive $112,551 in actual cash flows, but that would only be worth $55,958 to you today. (Because if you had $55,958 today, and you could grow it by 15% per year for 5 years in a row, you will have turned it into $112,551 after those five years.)
Because the discount rate (15%) that we’re applying is much higher than the growth rate of the cash flows (3%), the discounted versions of those future cash flows will shrink and shrink each year, and asymptotically approach zero.
Therefore, although the sum of all future cash flows (dark blue lines) is potentially infinite, the sum of all discounted cash flows (light blue lines) is just $837,286, even if the business lasts forever.
That’s the key answer to the original question; $837,286 is the maximum you should pay for the stake in the business, assuming you want to achieve 15% annual returns, and assuming your estimates for growth are accurate.
And the sum of just the first 25 years of discounted cash flows for this example is $784,286. In other words, even if the company went out of business a few decades from now, you’d still get most of the rate of return that you expected. The company doesn’t have to last forever for you to get your money’s worth.
How to Value a Project
A lot of businesses use discounted cash flow analysis to determine which projects to invest in. They have a finite amount of money to spend each year, so they want to put it into the projects that are expected to result in the highest rate of return. They don’t just want to throw darts at a dartboard and see what sticks.
Companies usually use their weighted-average cost of capital (WACC) as their discount rate, which takes into account the average rate of return that their stock and bond holders expect.
Suppose you’re a financial analyst at a company, and you are recommending whether the company should invest in Project A or Project B.
Each of the two projects has been proposed by a lead engineer, but the company can only invest in creating one of them this year, and so your manager wants you to give her advice on which one to invest in. Your company’s WACC is 9%, so you’ll use 9% as your discount rate.
Here are the two projects:

Project A starts with an initial investment to make a tech product, followed by a growing income stream, until the product becomes obsolete and is terminated.
Project B starts with an initial investment to make a different product, and makes no sales, but the whole product is expected to be sold in five years to some other company for a large payoff of $14 million.
Which project, assuming both carry the same risk, should the financial analyst recommend to her manager?
First, let’s analyze the discounted cash flows for Project A:

The sum of the discounted cash flows (far right column) is $9,707,166.
Therefore, the net present value (NPV) of this project is $6,707,166 after we subtract the $3 million initial investment.
Now, let’s analyze Project B:

The sum of the discounted cash flows is $9,099,039.
Therefore, the net present value (NPV) of this project is $6,099,039 after we subtract the $3 million initial investment.
We can conclude that from a financial standpoint, Project A is better, since it has a higher net present value.
Even though Project B will bring in $14 million in cash over its lifetime and Project A will only bring in $12 million, Project A is more valuable because of the earlier timing of those expected cash flows.
Thus, you should advise your manager to pick Project A to invest in for this year, if she can only invest in one.
Of course, in the real world, there could still be circumstances that might lead to the manager picking project B instead. There could be non-financial reasons to invest in that project, such as assisting with long-term strategic positioning, or trying to enter a new market, or something of that nature.
But in terms of which project is inherently more profitable assuming the cash flow expectations are accurate, the answer is Project A.
How to Price Bonds with DCF
Bonds have a large secondary market, and their prices change based on the prevailing interest rates.
The prices of those bonds on the secondary market are determined by discounted cash flow analysis:

- Bond Price refers to what investors are currently willing to pay for a bond.
- The Coupon refers to the payments made as part of the bond agreement to the bondholder for each year.
- i is the interest rate in decimal form. This is the yield to maturity that the bond buyer is targeting.
- Value at Maturity is the final payment the bondholder gets back at the end, or the “par value” of the bond.
Depending on the frequency of the coupon payments, there are several variants of this formula that can re-organize it into an easier form for the specific type of bond that is being priced.
The point is, at its core, bond pricing follows the same DCF formula as everything else that provides cash flows.
The higher the interest rate “i” for the bonds, the lower the bond price will be, assuming the coupon and value at maturity are unchanged. This is why when the Federal Reserve raises interest rates, the prices of existing bonds on the secondary market may decrease. Similarly, when the Federal Reserve reduces interest rates, existing bonds may increase in price.
How to Calculate the Fair Value of a Stock
One of the most common applications of discounted cash flows is for stock analysis. Wall Street analysts delve deep into the books of companies, trying to determine what the future cash flows will be and thus what the stock is worth today.
You can apply the same method that we used for the whole business example. You just have to add an extra step of dividing the answer by the number of existing shares to determine the fair value per share.
Here’s a streamlined input model I use for stock analysis, called StockDelver :

Source: StockDelver
It breaks down the growth estimate from top to bottom, starting with volume and pricing, and moving down towards analyzing the growth of earnings per share (EPS). You can easily substitute free cash flow (FCF) for EPS if you want.
A common principle in engineering is that you solve a hard problem by breaking it into little pieces and solving those little pieces individually, which makes the whole thing a lot easier. That’s how this works.
Rather than throwing a wild guess out there at how fast the business might grow, you examine the history of its revenue growth, changes in profit margin, and changes in share count, to build a model for how it is likely to grow in the future. You also should examine investor presentations and annual reports by the company, to see what management expects going forward in terms of growth in those various areas.
Keep in mind that these are forward-looking estimates. Don’t get too caught up in details or get too specific, since you can’t precisely predict the future anyway. It’s a back-of-the-envelope calculation for fair value based on conservative estimates of what is likely to occur.
Ask yourself:
- How has sales volume changed in the past? How will it probably change in the future? Is this a cyclical industry with ups and downs or a defensive and smooth-growing one?
- Is there any reason to expect pricing to differ from inflation going forward? Has company management offered an estimate of top line (revenue) growth going forward?
- How has the margin changed? Is there any reason to expect it to change going forward? Does the company have fixed costs, or do their costs change with volume? Does management have a specific plan for margin improvement?
- Is the company buying back shares, or issuing shares? Will this trend likely continue? What did company management say about this?
- Is the dividend payout ratio low or high? Has it been growing faster than EPS? Does it have room to safely grow more?
Once you have all those inputs, you can use that to determine the fair price to pay for a stock. Here’s the output for this example:

This stock is worth about $69.32, assuming the growth estimates are accurate.
If you can buy shares of the stock for lower than that amount, it should result in a good rate of return over the long term.
Limitations of the Discounted Cash Flow Method
Once you have a system for evaluating whole businesses or individual stocks or projects or whatever your application may be, the math is easy. The hard part is predicting the future.
Estimating all the future cash flows that an investment should produce, discounting them to their present value, and summing them all together into the fair value of the investment, is both an art and a science.
If your investment achieves the future cash flows that you expect, then this equation will mathematically solve the variable you are looking for, whether it’s the fair price or the expected rate of return. If you know the future cash flows and your target rate of return, this will scientifically tell you the maximum you should pay for the investment.
The problem is that your estimate of future cash flows needs to be accurate, which is why this is also an art. If you are wrong about the future cash flows that you’ll receive, then the equation won’t be useful for you. Sometimes projects fail, and sometimes businesses encounter obstacles that nobody expected, and these things can disrupt cash flow. Alternatively, a product might sell 10x more than anyone thought, and the future cash flows could be far higher than anyone dared to hope.
Since none of us can see the future, the future cash flows that we place into the equation are only estimates. The best we can do is break the problem into small pieces, and ensure that our estimates for those pieces are reasonable.
To compensate for this, experienced investors do two things.
First, they apply a margin of safety. If they calculate that a stock is worth $50, they only buy it if it’s under $45. If they calculate a business is worth $1 million, they’ll walk away from the offer unless they can get it for $900,000. That way, even if the company doesn’t perform quite as well as they expected, they have a margin for error to still get the rate of return they’re hoping for.
Second, they diversify into numerous investments. No matter how much work you do, an investment could turn out badly. By splitting their wealth up into multiple projects, businesses, stocks, or properties, they reduce their risk as a whole.
When these two methods are combined, it means that you systematically evaluate the fair value of investments, only buy them at prices that are well below their fair value, and diversify enough so that even when you’re wrong occasionally, you still come out ahead.
Final Words
Discounted cash flow analysis is a powerful framework for determining the fair value of any investment that is expected to produce cash flow. Just about any other valuation method is an offshoot of this method in one way or another.
It works for private businesses, publicly traded stocks, projects, real estate, and any other investment that is expected to produce cash flow later in exchange for cash flow today.
If you want to apply it to stocks, check out StockDelver , which is my digital book and streamlined set of Excel calculators for valuing stocks.
In addition, if you want to get information on undervalued sectors or attractively-priced stocks, join my free investment newsletter and get a detailed update on market conditions and investment opportunities. It publishes approximately every 6 weeks.
Further Reading:
- How to Determine if a Market is Overvalued
- How to Value Gold and Silver
- Contrarian/Value Investing: Why it Outperforms
Join the Free Investing Newsletter
Get the insider newsletter, keeping you up to date on market conditions, asset allocations, undervalued sectors, and specific investment ideas every 6 weeks.
No spam, no nonsense. Ever.
Brought to you by:
Discounted Cash Flow Analysis
By: Michael J. Schill
This technical note outlines the principles and application of proper discounted cash flow (DCF) analysis in the context of evaluating business investment projects. The note provides several specific…
- Length: 11 page(s)
- Publication Date: Jan 6, 2015
- Discipline: Finance
- Product #: UV6921-PDF-ENG
What's included:
- Educator Copy
$4.95 per student
degree granting course
$8.95 per student
non-degree granting course
Get access to this material, plus much more with a free Educator Account:
- Access to world-famous HBS cases
- Up to 60% off materials for your students
- Resources for teaching online
- Tips and reviews from other Educators
Already registered? Sign in
- Student Registration
- Non-Academic Registration
- Included Materials
This technical note outlines the principles and application of proper discounted cash flow (DCF) analysis in the context of evaluating business investment projects. The note provides several specific examples, emphasizes building intuition for DCF modeling, and reviews several common errors novices to the subject make in such analysis.
Jan 6, 2015 (Revised: Jan 7, 2016)
Discipline:
Darden School of Business
UV6921-PDF-ENG
We use cookies to understand how you use our site and to improve your experience, including personalizing content. Learn More . By continuing to use our site, you accept our use of cookies and revised Privacy Policy .
- Search Search Please fill out this field.
- What Is Discounted Cash Flow?
- How DCF Works
- Advantages and Disadvantages
The Bottom Line
- Corporate Finance
- Financial Ratios
Discounted Cash Flow (DCF) Explained With Formula and Examples
:max_bytes(150000):strip_icc():format(webp)/jason_mugshot__jason_fernando-5bfc261946e0fb00260a1cea.jpg "dcf analysis case study")
Yarilet Perez is an experienced multimedia journalist and fact-checker with a Master of Science in Journalism. She has worked in multiple cities covering breaking news, politics, education, and more. Her expertise is in personal finance and investing, and real estate.
:max_bytes(150000):strip_icc():format(webp)/YariletPerez-d2289cb01c3c4f2aabf79ce6057e5078.jpg "dcf analysis case study")
What Is Discounted Cash Flow (DCF)?
Discounted cash flow (DCF) refers to a valuation method that estimates the value of an investment using its expected future cash flows .
DCF analysis attempts to determine the value of an investment today , based on projections of how much money that investment will generate in the future.
It can help those considering whether to acquire a company or buy securities. Discounted cash flow analysis can also assist business owners and managers in making capital budgeting or operating expenditures decisions.
Key Takeaways
- Discounted cash flow analysis helps to determine the value of an investment based on its future cash flows.
- The present value of expected future cash flows is arrived at by using a projected discount rate.
- If the DCF is higher than the current cost of the investment, the opportunity could result in positive returns and may be worthwhile.
- Companies typically use the weighted average cost of capital (WACC) for the discount rate because it accounts for the rate of return expected by shareholders.
- A disadvantage of DCF is its reliance on estimations of future cash flows, which could prove inaccurate.
Investopedia / Jiaqi Zhou
How Does Discounted Cash Flow (DCF) Work?
The purpose of DCF analysis is to estimate the money an investor would receive from an investment, adjusted for the time value of money .
The time value of money assumes that a dollar that you have today is worth more than a dollar that you receive tomorrow because it can be invested. As such, a DCF analysis is useful in any situation where a person is paying money in the present with expectations of receiving more money in the future. For example, assuming a 5% annual interest rate, $1 in a savings account will be worth $1.05 in a year. Similarly, if a $1 payment is delayed for a year, its present value is 95 cents because you cannot transfer it to your savings account to earn interest.
Discounted cash flow analysis finds the present value of expected future cash flows using a discount rate . Investors can use the concept of the present value of money to determine whether the future cash flows of an investment or project are greater than the value of the initial investment.
If the DCF value calculated is higher than the current cost of the investment, the opportunity should be considered. If the calculated value is lower than the cost, then it may not be a good opportunity, or more research and analysis may be needed before moving forward with it.
To conduct a DCF analysis, an investor must make estimates about future cash flows and the ending value of the investment, equipment, or other assets.
The investor must also determine an appropriate discount rate for the DCF model, which will vary depending on the project or investment under consideration. Factors such as the company or investor's risk profile and the conditions of the capital markets can affect the discount rate chosen.
If the investor cannot estimate future cash flows or the project is very complex, DCF will not have much value and alternative models should be employed.
For DCF analysis to be of value, estimates used in the calculation must be as solid as possible. Badly estimated future cash flows that are too high can result in an investment that might not pay off enough in the future. Likewise, if future cash flows are too low due to rough estimates, they can make an investment appear too costly, which could result in missed opportunities.
Discounted Cash Flow Formula
The formula for DCF is:
D C F = C F 1 ( 1 + r ) 1 + C F 2 ( 1 + r ) 2 + C F n ( 1 + r ) n where: C F 1 = The cash flow for year one C F 2 = The cash flow for year two C F n = The cash flow for additional years r = The discount rate \begin{aligned}&DCF = \frac{ CF_1 }{ ( 1 + r ) ^ 1 } + \frac{ CF_2 }{ ( 1 + r ) ^ 2 } + \frac{ CF_n }{ ( 1 + r ) ^ n } \\&\textbf{where:} \\&CF_1 = \text{The cash flow for year one} \\&CF_2 = \text{The cash flow for year two} \\&CF_n = \text{The cash flow for additional years} \\&r = \text{The discount rate} \\\end{aligned} D CF = ( 1 + r ) 1 C F 1 + ( 1 + r ) 2 C F 2 + ( 1 + r ) n C F n where: C F 1 = The cash flow for year one C F 2 = The cash flow for year two C F n = The cash flow for additional years r = The discount rate
Example of DCF
When a company analyzes whether it should invest in a certain project or purchase new equipment, it usually uses its weighted average cost of capital (WACC) as the discount rate to evaluate the DCF.
The WACC incorporates the average rate of return that shareholders in the firm are expecting for the given year.
For example, say that your company wants to launch a project. The company's WACC is 5%. That means that you will use 5% as your discount rate.
The initial investment is $11 million, and the project will last for five years, with the following estimated cash flows per year.
Using the DCF formula, the calculated discounted cash flows for the project are as follows.
Adding up all of the discounted cash flows results in a value of $13,306,727. By subtracting the initial investment of $11 million from that value, we get a net present value (NPV) of $2,306,727.
The positive number of $2,306,727 indicates that the project could generate a return higher than the initial cost—a positive return on the investment. Therefore, the project may be worth making.
If the project had cost $14 million, the NPV would have been -$693,272. That would indicate that the project cost would be more than the projected return. Thus, it might not be worth making.
Dividend discount models, such as the Gordon Growth Model (GGM) for valuing stocks, are other analysis examples that use discounted cash flows.
Advantages and Disadvantages of DCF
Discounted cash flow analysis can provide investors and companies with an idea of whether a proposed investment is worthwhile.
It is an analysis that can be applied to a variety of investments and capital projects where future cash flows can be reasonably estimated.
Its projections can be tweaked to provide different results for various what-if scenarios. This can help users account for different projections that might be possible.
Disadvantages
The major limitation of discounted cash flow analysis is that it involves estimates, not actual figures. So the result of DCF is also an estimate. That means that for DCF to be useful, individual investors and companies must estimate a discount rate and cash flows correctly.
Furthermore, future cash flows rely on a variety of factors, such as market demand , the status of the economy, technology, competition, and unforeseen threats or opportunities. These can't be quantified exactly. Investors must understand this inherent drawback for their decision-making.
DCF shouldn't necessarily be relied on exclusively even if solid estimates can be made. Companies and investors should consider other, known factors as well when sizing up an investment opportunity. In addition, comparable company analysis and precedent transactions are two other, common valuation methods that might be used.
How Do You Calculate DCF?
Calculating the DCF involves three basic steps. One, forecast the expected cash flows from the investment. Two, select a discount rate, typically based on the cost of financing the investment or the opportunity cost presented by alternative investments. Three, discount the forecasted cash flows back to the present day, using a financial calculator, a spreadsheet, or a manual calculation.
What Is an Example of a DCF Calculation?
You have a discount rate of 10% and an investment opportunity that would produce $100 per year for the following three years. Your goal is to calculate the value today —the present value—of this stream of future cash flows.
Since money in the future is worth less than money today, you reduce the present value of each of these cash flows by your 10% discount rate. Specifically, the first year’s cash flow is worth $90.91 today, the second year’s cash flow is worth $82.64 today, and the third year’s cash flow is worth $75.13 today. Adding up these three cash flows, you conclude that the DCF of the investment is $248.68.
Is Discounted Cash Flow the Same As Net Present Value (NPV)?
No, it's not, although the two concepts are closely related. NPV adds a fourth step to the DCF calculation process. After forecasting the expected cash flows, selecting a discount rate, discounting those cash flows, and totaling them, NPV then deducts the upfront cost of the investment from the DCF. For instance, if the cost of purchasing the investment in our above example were $200, then the NPV of that investment would be $248.68 minus $200, or $48.68.
Discounted cash flow is a valuation method that estimates the value of an investment based on its expected future cash flows. By using a DFC calculation, investors can estimate the profit they could make with an investment (adjusted for the time value of money). The value of expected future cash flows is first calculated by using a projected discount rate. If the discounted cash flow is higher than the current cost of the investment, the investment opportunity could be worthwhile.
- Valuing a Company: Business Valuation Defined With 6 Methods 1 of 37
- What Is Valuation? 2 of 37
- Valuation Analysis: Meaning, Examples and Use Cases 3 of 37
- Financial Statements: List of Types and How to Read Them 4 of 37
- Balance Sheet: Explanation, Components, and Examples 5 of 37
- Cash Flow Statement: How to Read and Understand It 6 of 37
- 6 Basic Financial Ratios and What They Reveal 7 of 37
- 5 Must-Have Metrics for Value Investors 8 of 37
- Earnings Per Share (EPS): What It Means and How to Calculate It 9 of 37
- P/E Ratio Definition: Price-to-Earnings Ratio Formula and Examples 10 of 37
- Price-to-Book (PB) Ratio: Meaning, Formula, and Example 11 of 37
- Price/Earnings-to-Growth (PEG) Ratio: What It Is and the Formula 12 of 37
- Fundamental Analysis: Principles, Types, and How to Use It 13 of 37
- Absolute Value: Definition, Calculation Methods, Example 14 of 37
- Relative Valuation Model: Definition, Steps, and Types of Models 15 of 37
- Intrinsic Value of a Stock: What It Is and Formulas to Calculate It 16 of 37
- Intrinsic Value vs. Current Market Value: What's the Difference? 17 of 37
- The Comparables Approach to Equity Valuation 18 of 37
- The 4 Basic Elements of Stock Value 19 of 37
- How to Become Your Own Stock Analyst 20 of 37
- Due Diligence in 10 Easy Steps 21 of 37
- Determining the Value of a Preferred Stock 22 of 37
- Qualitative Analysis 23 of 37
- How to Choose the Best Stock Valuation Method 24 of 37
- Bottom-Up Investing: Definition, Example, Vs. Top-Down 25 of 37
- Financial Ratio Analysis: Definition, Types, Examples, and How to Use 26 of 37
- What Book Value Means to Investors 27 of 37
- Liquidation Value: Definition, What's Excluded, and Example 28 of 37
- Market Capitalization: What It Means for Investors 29 of 37
- Discounted Cash Flow (DCF) Explained With Formula and Examples 30 of 37
- Enterprise Value (EV) Formula and What It Means 31 of 37
- How to Use Enterprise Value to Compare Companies 32 of 37
- How to Analyze Corporate Profit Margins 33 of 37
- Return on Equity (ROE) Calculation and What It Means 34 of 37
- Decoding DuPont Analysis 35 of 37
- How to Value Private Companies 36 of 37
- Valuing Startup Ventures 37 of 37
:max_bytes(150000):strip_icc():format(webp)/NPV-final-509066b4f3734259a55f52281d155c0b.png "dcf analysis case study")
- Terms of Service
- Editorial Policy
- Privacy Policy
- Your Privacy Choices
- The Academy

Discounted Cash Flow (DCF) Analysis in Real Estate Explained

In commercial real estate, the discounted cash flow analysis is at the core of property valuations, which ultimately shapes investment decisions made by real estate firms.
But because of how real estate deals are typically financed (especially by major private equity firms), the way this is applied in practice isn’t all that straightforward.
So in this article, we’ll break down how a discounted cash flow analysis comes into play when investors value commercial properties, why commercial real estate firms tend to prefer analyzing a different metric when evaluating opportunities, and how you can talk through this concept clearly and concisely within a real estate interview.
If video is more your thing, you can watch the video version of this article here :
Defining “Discounted Cash Flow”
So to step back and start by defining what a discounted cash flow analysis actually is, this involves taking the cash flows that are projected to be generated by a commercial property, and then discounting those cash flows using a predetermined discount rate and the amount of time that has elapsed since the initial capital investment.
In the vast majority of cases, commercial real estate investors and investment firms will come up with valuations for properties using an Excel-based financial model, often a multi-tab template that looks something like this:
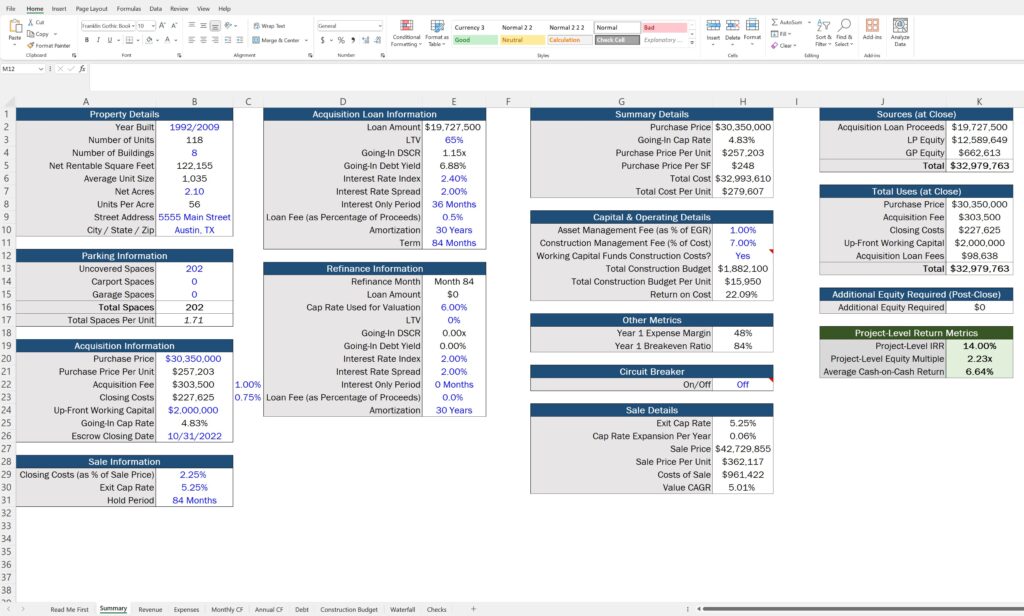
This model will be used to make projections about future property performance and what the cash flows generated by the property are going to be, using assumptions around things like rent growth, vacancy, leasing, operating expenses, and the terms of the debt that will be used to finance the deal.
These cash flows are then going to result in distributions to investors, that are putting their money to work in real estate with the goal to earn a targeted rate of return, and this is where the discount rate starts to come into play.
The Discount Rate
The discount rate represents the time-weighted, annualized return on capital invested that investors would require to make an investment worthwhile.
Now, we have a video that covers the process of choosing a discount rate in much more detail (link here ), but in general, higher levels of risk will usually result in higher required rates of return (and ultimately a higher discount rate), and lower levels of risk will usually result in lower required returns (and ultimately a lower discount rate), all else being equal.
And where these discount rates come into play within the discounted cash flow analysis is that these are applied to the projected future cash flows of a property , to determine if an investor is ultimately going to hit their required returns based on the timing and the amounts of projected distributions.
To use an example to illustrate this, let’s take a look at a deal where investors would require a 15% annualized, time-weighted return on a real estate investment that’s planned to be held for 5 years. Let’s also say that the property is projected to generate $100,000 per year in operating cash flow and an additional $3,000,000 of net sale proceeds at the end of that 5 year period.
And to run a DCF analysis on this deal given this information, what we need to do is take each of these cash flows in each year of the projected hold period and discount these values at that 15% rate, based on the amount of time that’s elapsed since the start of the analysis.
And the way we can calculate this is to take the cash flow generated in each year of our hold period and divide this by one plus the discount rate, and then take this to the power of the number of years that have elapsed since the initial acquisition:
Annual Cash Flow / (1 + Discount Rate)^Number of Years Since Acquisition
In this case, in year one, we’d need to take that $100,000 in net cash flow and divide this (1+15%), and then take this to the power of one, resulting in just under $87,000 for our discounted cash flow value in this year.
And to calculate this in year 2, we now need to factor in that 2 years have elapsed since the initial acquisition, multiplying that same $100,000 value by (1+15%)^2, which gets us just a little over $75,000 for our discounted cash flow value in this period.
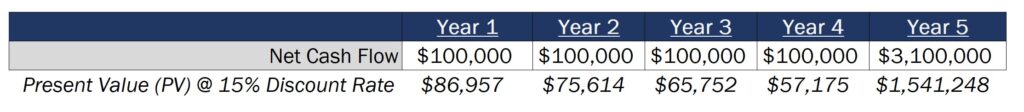
As you can see, this $100,000 amount continues to be discounted even further in years 3 and 4 as that exponent in the denominator continues to increase, ultimately leading to our $3,100,000 sum of operating cash flow and net sale proceeds in year 5 only accounting for a little over $1,500,000 within our DCF analysis.
Now once we have these discounted cash flow amounts, all we need to do to finish out our DCF analysis is find the sum of these values, or $1,826,746 in this case.
And what this tells us is that, based on these cash flows, assuming that each of these occurs at the end of each year for a full 5-year hold period and our investor requires a time-weighted, annualized return of fifteen percent on the deal, that investor could contribute up to $1,826,746 into the transaction and still hit their return target (assuming our projections are correct).
Why The Internal Rate of Return (IRR) is Preferred
However, since this $1,826,746 figure represents only the up-front equity investment the investor could make in the deal, this doesn’t tell us the actual purchase price we could pay for the property after factoring in debt.
So instead of using a discount rate and backsolving to an equity investment directly, many commercial real estate investors will use a target IRR in their models to come up with valuations instead, since this incorporates all cash flows and loan proceeds into this figure.
The IRR, or internal rate of return, represents the discount rate at which the net present value of a set of cash flows is equal to zero, essentially getting us to that same $1,826,746 up-front investment producing a 15% IRR.
However, because an initial equity investment in a real estate deal is usually going to be based on a mixture of a purchase price, closing costs, and loan proceeds, using a target IRR allows an investor to see their projected returns in a model much more easily, and can ultimately guide their offers in a more direct way.
This is why, if you open up the models used by some of the biggest investment and development firms in the industry, the IRR is almost always going to be the focal point and you won’t necessarily even see a net present value (NPV) calculation within the entire template. The IRR allows an investor to analyze the same time-weighted, annualized returns that the standard DCF analysis allows, but in a much more dynamic way, and makes it significantly easier to see the impacts of different purchase prices on a property’s projected returns.
Putting It All Together
To sum this all up, a discounted cash flow analysis takes a discount rate, or an investor’s targeted, annualized, time-weighted return on capital invested, and applies that to each projected cash flow on a deal based on the amount of time that has elapsed since the initial investment was made.
And from there, the sum of these cash flows represents the initial equity contribution that could be made by investors that would ultimately result in achieving those returns.
So if you’re asked a question during an interview that sounds something along the lines of, “Walk me through a DCF,” this is how you can describe this concept in a way that goes a layer deeper than just talking through general formulas, and how this is applied in a real estate context.
And if you’re in the process of preparing for interviews and want to make sure you’re ready for an Excel modeling exam that might be given to you during the process, or you just want to see how all of these things come together within a full real estate pro forma model, as always, make sure to check out our all-in-one membership training platform, Break Into CRE Academy .
A membership to the academy will give you instant access to over 120 hours of video training on real estate financial modeling and analysis. You’ll get access to hundreds of practice Excel interview exam questions, sample acquisition case studies, and you’ll also get access to the Break Into CRE Analyst Certification Exam, which covers topics like real estate pro forma and development modeling, commercial real estate lease modeling, equity waterfall modeling, and many other real estate financial analysis concepts, that will help you prove to employers, that you have what it takes, to tackle the responsibilities of an analyst or associate, at a top real estate firm.
To learn more about the Academy, you can see all the details here .
Thanks for reading!
What NOT to Say in a Real Estate Interview
How to stand out in a real estate interview, grab the free real estate financial modeling crash course.
Learn The Three Pillars of Real Estate Financial Modeling & How To Build Models on Autopilot

Get instant access to the crash course
Learn the three key pillars of real estate financial modeling - and how to use them to build models from scratch.
You'll also receive access to free weekly videos to help you master real estate financial modeling & advance your career
- First Name *
- Name This field is for validation purposes and should be left unchanged.
Privacy Overview
Cash Flow Valuation and ESG: Case Study
- First Online: 23 June 2023
Cite this chapter

- Frédéric Le Meaux 2
Part of the book series: Sustainable Finance ((SUFI))
604 Accesses
This chapter provides the reader with a method to integrate ESG in a discounted cash flow (DCF) model. It explains how readers should proceed to rigorously do a pre-analysis and gather data. It then guides readers in choosing a framework. After choosing a framework the reader will be guided through materiality assessment and implementation in the DCF model. Finally, we give the reader templates that can be used to integrate ESG in a DCF model.
This is a preview of subscription content, log in via an institution to check access.
Access this chapter
- Available as PDF
- Read on any device
- Instant download
- Own it forever
- Available as EPUB and PDF
- Durable hardcover edition
- Dispatched in 3 to 5 business days
- Free shipping worldwide - see info
Tax calculation will be finalised at checkout
Purchases are for personal use only
Institutional subscriptions
Principles for Responsible Investment (PRI). (2016). A practical guide to ESG integration for equity investing . Accessed February 21, 2023, from https://www.unpri.org/listed-equity/a-practical-guide-to-esg-integration-for-equity-investing .
Download references
Author information
Authors and affiliations.
Amundi, Paris, France
Frédéric Le Meaux
You can also search for this author in PubMed Google Scholar
Editor information
Editors and affiliations.
ESSCA, School of Management, Boulogne-Billancourt, France
Dejan Glavas
Rights and permissions
Reprints and permissions
Copyright information
© 2023 The Author(s), under exclusive license to Springer Nature Switzerland AG
About this chapter
Le Meaux, F. (2023). Cash Flow Valuation and ESG: Case Study. In: Glavas, D. (eds) Valuation and Sustainability. Sustainable Finance. Springer, Cham. https://doi.org/10.1007/978-3-031-30533-7_5
Download citation
DOI : https://doi.org/10.1007/978-3-031-30533-7_5
Published : 23 June 2023
Publisher Name : Springer, Cham
Print ISBN : 978-3-031-30532-0
Online ISBN : 978-3-031-30533-7
eBook Packages : Economics and Finance Economics and Finance (R0)
Share this chapter
Anyone you share the following link with will be able to read this content:
Sorry, a shareable link is not currently available for this article.
Provided by the Springer Nature SharedIt content-sharing initiative
- Publish with us
Policies and ethics
- Find a journal
- Track your research
- Video Tutorials
- Knowledge Base
- Group Licenses
- Why Choose Us?
- Certificates
- Discounted Cash Flow Analysis (DCF) Tutorials
Knowledge Base: Discounted Cash Flow Analysis (DCF) Tutorials
Dcf – terminal value – gordon growth method intuition (24:35), the mid-year convention and mid-year discounting in a dcf with stub periods, unlevered free cash flow tutorial: definition, examples, and formulas (20:30), wacc, cost of equity, and cost of debt in a dcf (17:55).
IMAGES
VIDEO
COMMENTS
And if you want in-depth case studies backed by real-world data and research, the Core Financial Modeling course delves into valuation/DCF analysis in even greater detail: Core Financial Modeling Learn accounting, 3-statement modeling, valuation/DCF analysis, M&A and merger models, and LBOs and leveraged buyout models with 10+ global case studies.
The Discounted Cash Flow Model, or "DCF Model", is a type of financial model that values a company by forecasting its cash flows and discounting them to arrive at a current, present value. DCFs are widely used in both academia and in practice. Valuing companies using a DCF model is considered a core skill for investment bankers, private ...
How the DCF Works Overview ♦ Based off any available financial data (both historical and projected), the DCF, • First, projects the Company's expected cash flow each year for a finite number of years • Second, sums all the projected cash flows from the first step • And lastly, discounts the result from the second step by some rate to yield the value in terms of present day $ dollars
The DCF Excel model presented herein is a relatively straightforward cash flow model. The model can be modified through the addition of a number of bells and whistles to increase its precision or account for the nuances of a proposed project (e.g., multiple buildings, phased construction, mixed-use projects, rent rolls).
That's the key answer to the original question; $837,286 is the maximum you should pay for the stake in the business, assuming you want to achieve 15% annual returns, and assuming your estimates for growth are accurate. And the sum of just the first 25 years of discounted cash flows for this example is $784,286.
The date on which we're performing our Amazon valuation analysis is June 14, 2022. As of the last closing date, Amazon shares were trading for $102.31 at market close. Current Share Price (6/14/22) = $102.31. The current share price as of the latest close date reflects a ~40% decline since the end of 2021.
This section compares DCF valuation using WACC to the market multiples approaches. Mercury Athletic: Valuing the Opportunity, a brief case, uses the potential acquisition of a footwear subsidiary to teach students DCF valuation using WACC and compares the results with those drawn from market multiples approaches.The alternative case, Healthineers: A Strategic IPO, covers the valuation of a ...
A DCF model is a specific type of financial modeling tool used to value a business. DCF stands for D iscounted C ash F low, so a DCF model is simply a forecast of a company's unlevered free cash flow discounted back to today's value, which is called the Net Present Value (NPV). This DCF model training guide will teach you the basics, step ...
Discounted cash flow models typically consider three values: DCF —Discounted cash flow, which is the sum of all future discounted cash flows that an investment is expected to produce. CF —Cash flow for a given year. r —Discount rate, or the target rate of return on the investment expressed in decimal form. Here's the basic discounted ...
DCF Implied Share Price Calculation. Since we have the diluted shares outstanding and the implied equity value, we can calculate the DCF-derived share price using the formula below. DCF-Derived Share Price = Implied Equity Value ÷ Diluted Shares Outstanding. In conclusion, NVIDIA should be worth $133.73 per share under our base case ...
7 Step of Discounted Cash Flow Valuation Model. Step #1 - Projections of the Financial Statements. Step #2 - Calculating Free Cash Flow to Firm. Step 3- Calculating the Discount Rate. Step 4 - Calculating the Terminal Value. Step 5 - Present Value Calculations.
Related. This technical note outlines the principles and application of proper discounted cash flow (DCF) analysis in the context of evaluating business investment projects. The note provides several specific examples, emphasizes building intuition for DCF modeling, and reviews several common errors novices to the subject make in such analysis.
Table of Contents: 0:42: The Big Idea Behind Valuation and DCF Analysis 4:48: Case Study Description 6:24: Revenue Projections 13:44: Expense and Cash Flow Projections 20:23: Unlevered FCF Projections 29:43: Summary and Preview
Discounted cash flow (DCF) is a valuation method used to estimate the attractiveness of an investment opportunity. DCF analyses use future free cash flow projections and discounts them, using a ...
Liquidation value - The amount that will be realized on sale of an asset or a group of assets when an actual/hypothetical termination of the business is contemplated/assumed. Liquidation value can be carried out under the premise of. Orderly transaction - normal marketing period, or. Forced transaction - a shortened/no marketing period.
Discounted Cash Flow Valuation ii List of figures and tables Table 1. Long term credit rating scales: Source: adapted from HSBC handbook, 2008 Table 2. Trading comparables analysis Table 3. Transaction multiple analysis Table 4. Case Study: Calculation of the enterprise value Table 5. Case Study: Sensitivity Analysis WACC, perpetual growth rate
Discounted Cash Flow (DCF) analysis is a fundamental financial tool used by businesses and investors to assess the value of an investment or project. ... (DCF) analysis. This case study will ...
Walk me through a DCF Step 3 - Discount the cash flows to get the present value. In step 3 of this DCF walk-through, it's time to discount the forecast period (from step 1) and the terminal value (from step 2) back to the present value using a discount rate. The discount rate is almost always equal to the company's weighted average cost ...
Annual Cash Flow / (1 + Discount Rate)^Number of Years Since Acquisition. In this case, in year one, we'd need to take that $100,000 in net cash flow and divide this (1+15%), and then take this to the power of one, resulting in just under $87,000 for our discounted cash flow value in this year. And to calculate this in year 2, we now need to ...
This advanced financial modeling course has several objectives including: Use Amazon's financial statements to build an integrated 3-statement financial forecast. Learn how to structure an advanced valuation model effectively. Set up all the assumptions and drivers required to build out the financial forecast and DCF model.
As of the time of this case study, using our own forward estimates for Jazz's financials, the company traded at an LTM EV / EBITDA multiple of 21.5x, a 1 -year forward multiple of 14.9x, and a 2-year forward multiple of 10.9x; its revenue multiples in the same time frame were 9.8x, 7.7x, and 5.9x, respectively. Return to Top. Investment Thesis
Abstract. This chapter provides the reader with a method to integrate ESG in a discounted cash flow (DCF) model. It explains how readers should proceed to rigorously do a pre-analysis and gather data. It then guides readers in choosing a framework. After choosing a framework the reader will be guided through materiality assessment and ...
1/ (1+WACC)^ (time) The time for this particular example is three years. So the discount factor for year 3 is 0.746. I have to multiply the discount factor with the free cash flow to get the present value. So 0.746 * 294.14 = 219.4923Crs. Notice that I've also calculated the present value of the terminal growth value.
Discounted Cash Flow Analysis (DCF) Tutorials; Knowledge Base: Discounted Cash Flow Analysis (DCF) Tutorials ... Into Wall Street is the only financial modeling training platform that uses real-life modeling tests and interview case studies to give you an unfair advantage in investment banking and private equity interviews - and a leg up once ...