- Close Email Address Password Show password Forgot your password? Sign In Create an account

Choose your country or region:
- België /Belgique
- Česká Republika
- Deutschland
- Magyarország
- United Kingdom
Asia - Australasia
- Mainland China
- New Zealand
- Philippines
- South Korea (한국)
- Thailand (ไทย)
- América Latina
- United States
Middle East - Africa
- Middle East & North Africa
- East, Central & West Africa
- South and Southern Africa
- Ships Next Day
- Claros Portal
- Worldwide Locations
- Order Status
- Express Order
Successfully added to cart
Water Analysis Handbook

The Water Analysis Handbook (WAH) is the result of more than 85 years of research and method development. With over 300 illustrated, step-by-step instructions, this is your comprehensive source for water analysis procedures. From instruments to reagents, meters to probes, media to general lab supply, this handbook outlines everything you need to perform each procedure, simplifying the water analysis process.
WAH Downloads
Abbreviations and Conversions Table Common in Written Chemical Procedures
Acid-Base, Acid and Base Determination Method 8200 and Method 8233
Acid-Base, Sodium Hydroxide for meq/L of Acid; Sulfuric Acid for meq/L of Base. Method 8288 and Method 8289
Acidity for Water, Wastewater and Seawater
Acidity, Methyl Orange-Sodium Hydroxide with a Buret Method 8219
Acidity, Methyl orange and Phenolphthalein (Total) Acidity-Method 8201 and Method 8202
Acidity, Phenolphthalein-Sodium Hydroxide with a Buret Method 8010
Alkalinity for Water, Wastewater and Seawater
Alkalinity, Buret Titration Method 8221
Alkalinity, Phenolphthalein and Total Alkalinity Method 8203
Alkalinity, Total, Colorimetric Method, TNTplus™ 870, Method 10239
Aluminum Aluminon Method 8012
Aluminum Chromazurol S Method 10215
Aluminum PP Method 8326
Aluminum for Water
Arsenic Silver Dientyldithiocarbamate Method 8013
Atrazine Immunoassay Method 10050
Bacteria Membrane Filtration Method, Pre-poured Agar Plate
Bacteria Test Guidelines
Bacteria, Hydrogen Sulfide Producing, Presence/Absence Method 8506
Bacteria, Hydrogen Sulfide Producing-Most Probable Number Method 10032
Barium Turbidimeter Method 8014
Barium for Water, Wastewater, Oil-field water and Seawater
Benzotriazole and Tolyltriazole for Water
Benzotriazole/Tolyltriazole UV Photolysis Method 8079
Boron Azomethine-H Method LR
Boron Carmine Method 8015
Boron for Water and Wastewater
Bromine DPD Method 8016
Cadmium Cadion Method 10217
Cadmium Dithizone Method 8017
Carbon Dioxide for Water and Seawater
Carbon Dioxide, Buret titration Method 8223
Carbon Dioxide, Digital Titrator using Sodium Hydroxide Method 8205
Chelant, Free-Digital Titrator using Magnesium Chloride Method 8352
Chelant, Total-Bismuth Nitrate Method 8350
Chemical Analysis
Chemical Oxygen Demand for Wastewater
Chemical Oxygen Demand, Mn III for Water and Wastewater
Chloramine (Mono) Indophenol Method 10171
Chloramine (Mono) Indophenol Method 10172
Chloramine (Mono); Free Ammonia Method 10200
Chloride Mercuric Thiocyanate Method 8113
Chloride for Water and Wastewater
Chloride, Mercuric Nitrate Method 8206
Chloride, Silver Nitrate Buret Titration Method 8225
Chloride, Silver Nitrate Method 8207
Chlorine Demand/Requirement, DPD Reagent Method 10223
Chlorine Dioxide Chlorophenol Red method 8065
Chlorine Dioxide DPD Method 10126
Chlorine Dioxide Direct Reading Method 8138
Chlorine Dioxide Direct Reading Method 8345
Chlorine Dioxide for Water and Wastewater
Chlorine, Free DPD Method 10069
Chlorine, Free DPD Method 8021
Chlorine, Free DPD Rapid Liquid Method 10059
Chlorine, Free DPD TNT Method 10102
Chlorine, Free MR, USEPA DPD Method 10245
Chlorine, Free and Total TNTplus™, DPD Method. Free Chlorine: Method 10231; Total Chlorine: Method 10232
Chlorine, Free and Total for Water, Wastewater and Seawater
Chlorine, Free and Total-DPD-FEAS Method 8210
Chlorine, Free, Indophenol Method 10241
Chlorine, Free-Amperometric Buret Titration Method 8334
Chlorine, Free-Amperometric Forward Titration, Method 10024
Chlorine, Hypochlorite-Iodometric HR Method 10100
Chlorine, Total DPD Method 10014
Chlorine, Total DPD Method 10070
Chlorine, Total DPD Method 8167
Chlorine, Total DPD Method 8370
Chlorine, Total DPD Rapid Liquid Method 10060
Chlorine, Total DPD TNT Method 10101
Chlorine, Total- DPD, MR, Method 10250
Chlorine, Total-Amperometric Back Titration Method 10025
Chlorine, Total-Amperometric Buret Titration Method 8168
Chlorine, Total-Amperometric Forward Titration, Method 10026
Chlorine, Total-Iodometric Method 8161
Chlorine, Total-Iodometric using Sodium Thiosulfate Method 8209
Chromate, Titration using Sodium Thiosulfate Method 8211
Chromium for Water and Wastewater
Chromium, Hexavalent Method 8023
Chromium, Hexavalent-1,5-diphenylcarbohydrazide Method 10218. Chromium, Total-1,5-Diphenylcarbohydrazide Method 10219
Chromium, Total Alkaline Hypobromite Oxidation Method 8024
Cobalt 1-(2-Pyridylazo)-2-Naphthol (PAN) Method 8078
Cobalt for water
Coliforms, Presence/Absence-P/A Broth Method 8319. P/A Broth with MUG Method 8364
Coliforms-E. coli, Membrane Filtration (modified m-TEC) Method 8367
Coliforms-E. coli, Membrane Filtration Method 8367
Coliforms-Fecal, A-1 Medium, Most Probable Number (MPN) Method 8368
Coliforms-Fecal, Membrane Filtration (m-FC and m-FC/RA) Method 8074
Coliforms-Total and E. coli, Membrane Filtration Method 10029
Coliforms-Total and E.coli, Lauryl Tryptose with MUG Broth, Most Probable Number (MPN) Method 8091
Coliforms-Total, Fecal and E.coli, Lauryl Tryptose Broth, Most Probable Number (MPN) Method 8001
Coliforms-Total, Fecal and E.coli, Lauryl Trypyose Broth, Most Probable Number Method 8001A
Coliforms-Total, Fecal and E.coli-Membrane Filtration, m-Endo, Method 8074
Color, ADMI-ADMI Weighted Ordinate Method 10048
Color, True & Apparent, Platinum-Cobalt Standard Method 8025
Color, True and Apparent, Low Range, Platinum-Cobalt Standard Method (8025)
Conductivity, Direct Measurement Method 8160
Copper Bicinchoninate Method 8506 and Method 8026
Copper Porphyrin Method 8143
Copper for Water, Wastewater and Seawater
Copper, Bathocuproine Method, TNTplus™ 860, Method 10238
Cyanide Pyridine-Pyrazalone Method 8027
Cyanide for Water, Wastewater and Seawater
Cyanuric Acid, Turbidimetric Method 8139
Definitions of USEPA Approved and Accepted
Direct Measurement ISE, TISAB Solution, Method 8359
Dissolved Oxygen HRDO HR Method 8166
Dissolved Oxygen Indigo Carmine LR Method 8316
Dissolved Oxygen Ultra High Range Method 8333
Dissolved Oxygen for Water, Wastewater, and Seawater
Dissolved Oxygen, Azide Modification of Winkler Method 8215 and Method 8332
Dissolved Oxygen, Direct Measurement, Clark-type Amperometric Sensor, Method 8157
Dissolved Oxygen, Direct Measurement, LDO Probe, Method 10360
Dissolved Oxygen-Azide Modification of Winkler Method 8229
Enterococci (Coliforms) Membrane Filtration, Proposed Method 1600
Fluoride SPADNS Method 8029
Fluoride for Water and Seawater
Fluoride in Acid Solutions, Direct Measurement ISE Electrode Method 8323
Fluoride in Drinking Water, Direct Measurement ISE, Powder Pilow or TISAB Solution, Method 8323
Fluoride, SPADNS 2 Method 10225
Formaldehyde MBTH Method 8110
Formaldehyde for Water
No resources available at this time.
Hardness Calcium & Magnesium; Calmagite Colorimetric Method 8030
Hardness Calcium & Magnesium; Chlorophosphonazo Colorimetric Method 8374
Hardness for Water, Wastewater and Seawater
Hardness, Calcium-Buret Titration Method 8222
Hardness, Calcium-Titration Method using EDTA Method 8204
Hardness, Total Sequential-Buret Titration Method 8338
Hardness, Total, Sequential, Titration using EDTA, Method 8329
Hardness, Total-Calcium & Magnesium Chlorophosphonazo Rapid Liquid Method 8374
Hardness, Total-ManVer 2 Buret Titration Method 8226
Hardness, Total-Titration using EDTA Method 8213
Heterotrophic Bacteria, Membrane Filtration Method, m-TGE Broth with TTC Indicator-Method 8242
Heterotrophic Bacteria, Membrane Filtration Method, m-TGE Broth, Method 8242
Heterotrophic Bacteria, Membrane Filtration, m-HPC, Method 8242
Heterotrophic Bacteria, Membrane Filtration, m-TSB-USP, Method 8242
Heterotrophic Bacteria, Pour Plate, Plate Count Agar, Method 8241
Heterotrophic Bacteria, Pour Plate, m-HPC, Method 8242
Heterotrophic Bacteria, Pour Plate, m-TGE with TTC, Method 8242
Heterotrophic Bacteria, Pour Plate, m-TGE, Method 8242
Heterotrophic Bacteria, Pour Plate, m-TSB/USP, Method 824
Hydrazine for Water and Boiler Water
Hydrazine p-Dimethylaminobenzaldehyde Method 8141
International Guideline Comparison between International Drinking Water and FDA Bottled Water
Iodine DPD Method 8031
Iron FerroZin ® Rapid Liquid Method 8147
Iron Ferrozine Method 8147
Iron for Water and Seawater
Iron, Ferrous 1-10 Phenanthroline Method 8146
Iron, TNTplus™ 858, Phenanthroline Method 10229
Iron, TitraVer Titration Method 8214
Iron, Total FerroMo Method 8365
Iron, Total FerroVer ® Method 8008
Iron, Total TPTZ Method 8112
Laboratory Practices
Langelier and Agressive Indices for Method 8073
Lead Dithizone Method 8033
Lead LeadTrak™ Fast Column Extraction Method 8317
Lead PAR Method 10216
Lead for Water and Wastewater
MPN (Most Probable Number) Dilution Guidelines
Manganese 1-(2-Pyridylazo)-2-Naphthol PAN Method 8149
Manganese Periodate Oxidation Method 8034
Manganese for Water and Wastewater
Membrane Filtration Guidelines
Mercury Cold Vapor Mercury Concentration Method 10065
Mercury, Cold Vapor
Molybdenum Mercaptoacetic Acid Method 8036
Molybdenum Ternary Complex Method 8169
Molybdenum, Molybdate for Water
Monochloramine for Water and Wastewater
Monochloramine; Nitrogen, Free Ammonia
Nickel 1-(2-Pyridylazo)-2-Napthol (PAN) Method 8150
Nickel Dimethylglyoxime Method 10220
Nickel Heptoxime Method 8037
Nickel for Water
Nitrate Cadmium Reduction LR Method 8192
Nitrate Cadmium Reduction Method 8039
Nitrate Cadmium Reduction Method 8171
Nitrate Chromotropic Acid TNT Method 10020
Nitrate Dimethylphenol HR Method 10206
Nitrate UV Screening Method 10049
Nitrate, Dimethylphenol LR Method 10206
Nitrate, Direct Measurement ISE, Powder Pillow or TISAB Solution, Method 8358
Nitrite Diazotization LR Method 10019
Nitrite Diazotization LR Method 10207
Nitrite Diazotization LR Method 8507
Nitrite Ferrous Sulfate HR Method 8153
Nitrite, Ceric Acid Titration Method 8351
Nitrite, Diazotization, HR, TNTplus™ Method 10237
Nitrogen Total Inorganic-Titanium Trichloride Reduction Method 10021
Nitrogen Total Kjeldahl-Nessler Method 8075
Nitrogen Total-Persulfate Digestion HR Method 10208
Nitrogen, Ammonia for Water, Wastewater and Seawater
Nitrogen, Ammonia-Direct Measurement ISE Electrode, Method 10001
Nitrogen, Ammonia-Known Addition ISE Electrode, Method 10002
Nitrogen, Ammonia-Nessler Method 8038
Nitrogen, Ammonia-Salicylate HR Method 10031
Nitrogen, Ammonia-Salicylate HR TNT Method 10205
Nitrogen, Ammonia-Salicylate LR TNT Method 10023
Nitrogen, Ammonia-Salicylate LR TNT Method 10205
Nitrogen, Ammonia-Salicylate Method 8155
Nitrogen, Ammonia-Salicylate ULR TNT Method 10205
Nitrogen, Free Ammonia-Indophenol Method 10201
Nitrogen, Kjeldahl for Water and Wastewater
Nitrogen, Nitrate for Water and Wastewater
Nitrogen, Nitrite for Water and Wastewater
Nitrogen, Simplified TKN (s-TKN™), Method 10242
Nitrogen, Total for Water, Wastewater and Seawater
Nitrogen, Total-Persulfate Digestion HR Method 10072
Nitrogen, Total-Persulfate Digestion LR Method 10071
Nitrogen, Total-Persulfate Digestion LR TNT Method 10208
Nitrogen, Total-Persulfate Digestion UHR TNT Method 10208
Oil and Grease, Solid Phase Extraction Method 10300
Oli and Grease Hexane Extractable Gravimetric Method 10056
Organic Carbon, Total-Direct LR Method 10129
Organic Carbon, Total-HR Direct Method 10128
Organic Carbon, Total-MR Direct Method 10173
Organic Constituents UV Absorbing (UV-254), Direct Reading Method 10054
Organic Constituents, UV Transmission (UV-254), Direct Reading Method 10243
Oxidation Reduction Potential (ORP), Direct Measurement-ORP Electrode-Method 10228
Oxygen Demand, Biochemical, Dilution LBOD Measurement, Method 10230
Oxygen Demand, Biochemical-Dilution Method 8043
Oxygen Demand, Chemical, Mercury-Free Reactor Digestion, TNTplus™ 825, Method 10236
Oxygen Demand, Chemical-Manganese III Reactor Digestion Method 10067 (with Chloride Removal)
Oxygen Demand, Chemical-Manganese III Reactor Digestion Method 10067 (without Chloride Removal)
Oxygen Demand, Chemical-Reactor Digestion Method 8000
Oxygen Demand, Chemical-Reactor Digestion Method 8000, TNTPlus™
Oxygen Demand, Chemical-Reactor Digestion ULR TNT Method 10211
Oxygen Demand, Chemical-UHR Reactor Digestion Method 10212
Oxygen Scavengers Iron Reduction Method 8140
Oxygen Scavengers for Water
Ozone Indigo Method 8311
Ozone for Water
Peracetic Acid (PAA) 1 and Hydrogen Peroxide (H 2 O 2 )
pH, Electrode Method 8156
pH Indicators for Water and Wastewater
Phenols 4-Aminoantipyrine Method 8047
Phenols for Water, Wastewater, and Seawater
Phosphonates Persulfate UV Oxidation Method 8007
Phosphonates for Water
Phosphorus for Water, Wastewater and Seawater
Phosphorus, Acid Hydrolyzable Digestion-Acid Digestion Method 8180
Phosphorus, Acid Hydrolyzable-PhosVer™ 3 with Acid Hydrolysis TNT Method 8180
Phosphorus, Reactive (Orthophosphate) Amino Acid Method 8178
Phosphorus, Reactive (Orthophosphate) Molybdovanadate Method 10214
Phosphorus, Reactive (Orthophosphate) Molybdovanadate Method 8114
Phosphorus, Reactive (Orthophosphate) Molybdovanadate TNT Method 8114
Phosphorus, Reactive (Orthophosphate) PhosVer ® TNT Method 8048
Phosphorus, Reactive (Orthophosphate) and Total-Ascorbic Acid, TNTplus™ 843, LR Method 10209 (Reactive) and Method 10210 (Total)
Phosphorus, Reactive (Orthophosphate) and Total-Ascorbic Acid, TNTplus™ 844, Method 10209 (Reactive) and Method 10210 (Total)
Phosphorus, Reactive (Orthophosphate) and Total-Ascorbic Acid, TNTplus™ 845, UHR Method 10209 (Reactive) and Method 10210 (Total)
Phosphorus, Reactive (Orthophosphate)-PhosVer 3 (Ascorbic Acid) Method 8048
Phosphorus, Reactive-Ascorbic Acid Rapid Liquid LR Method 10055
Phosphorus, Reactive-Molybdovanadate Rapid Liquid HR Method 8114
Phosphorus, Total Molybdovanadate Method with Acid Persulfate Digestion HR TNT Method 10127
Phosphorus, Total, Digestion-Acid Persulfate Digestion Method 8190
Phosphorus, Total-PhosVer ® with Acid Persulfate Digestion TNT Method 8190
Potassium Tetraphenylborate Method 8049
Potassium for Water and Wastewater
Pseudomonas (Coliform), Membrane Filtration Method 8026
Quaternary Ammonium Compounds-Direct Binary Complex Method 8337
Salinity, Mercuric Nitrate Method 10073
Sample Pretreatment by Digestion
Selenium Diaminobenzidine Method 8194
Selenium for Water and Wastewater
Silica Heteropoly Blue ULR Method 8282
Silica for Water and Seawater
Silica-Heteropoly Blue LR Method 8186
Silica-Heteropoly Blue Rapid Liquid ULR Method 8282
Silica-Silicomolybdate HR Method 8185
Silver, Colorimetric Method 8120
Sodium, Direct Measurement ISE Electrode, Method 8359
Solids, Nonfilterable Suspended Solids; Total and Volatile-Gravimetric Method 8158 and Method 8164
Solids, Settleable Matter-Direct Measurement Method 8165
Solids, Total Filterable (Total Dissolved Solids), Gravimetric Method 8163
Solids, Total Volatile and Fixed-Gravimetric Method 8276
Solids, Total-Gravimetric Method 8271
Solids, Volatile Dissolved and Fixed Dissolved-Gravimetric Method 8277
Sulfate SulfaVer 4 Method 8051
Sulfate for Water, Seawater and Oil-field Water
Sulfate, Turbidimetric, TNTplus™ 864, Method 10227
Sulfate, Turbidimetric, TNTplus™ 865, Method 10227
Sulfide Methylene Blue Method 8131
Sulfide for Water, Wastewater and Seawater
Sulfite for Water, Wastewater and Seawater
Sulfite, Iodate-Iodide Buret Titration Method 8071
Sulfite, Iodate-Iodide Method 8216
Surfactants, Anionic (Detergents)-Crystal Violet Method 8028
Suspended Solids, Photometric Method 8006
Tannin and Lignin Tyrosine Method 8193
Total Aerobic Bacteria, Yeasts and Molds-Paddle Testers
Total Organic Carbon for Water and Wastewater
Total Petroleum Hydrocarbons (TPH) Immunoassay Method 10050
Toxicity, ToxTrak™ Method 10017
Trihalomethane Formation Potential (THMFP) THM Plus Method 10224
Trihalomethanes, THM Plus™ Method 10132
Volatile Acids, Buret Titration Method 8291
Volatile Acids, Esterification Method 8196
Volatile Acids, Esterification, TNTplus™ 872, Method 10240
Volatile Acids, Sodium Hydroxide Method 8218
Water Management and Safety
Water Analysis Guide (includes an application guide, abbreviations and conversions, lab practices, chemical analysis, sample pretreatment by digestion, bacteria analysis, and waste management/safety)
Zinc for Water and Wastewater
Zinc, Zincon Method 8009

- Previous Article
INTRODUCTION
Scoping review, statistical methods and approaches, practical example on surface water quality in the athabasca oil sands, acknowledgements, data availability statement, statistical tools for water quality assessment and monitoring in river ecosystems – a scoping review and recommendations for data analysis.
- Article contents
- Figures & tables
- Supplementary Data
- Open the PDF for in another window
- Guest Access
- Cite Icon Cite
- Permissions
- Search Site
Stefan G. Schreiber , Sanja Schreiber , Rajiv N. Tanna , David R. Roberts , Tim J. Arciszewski; Statistical tools for water quality assessment and monitoring in river ecosystems – a scoping review and recommendations for data analysis. Water Quality Research Journal 1 February 2022; 57 (1): 40–57. doi: https://doi.org/10.2166/wqrj.2022.028
Download citation file:
- Ris (Zotero)
- Reference Manager
Robust scientific inference is crucial to ensure evidence-based decision making. Accordingly, the selection of appropriate statistical tools and experimental designs is integral to achieve accuracy from data analytical processes. Environmental monitoring of water quality has become increasingly common and widespread as a result of technological advances, leading to an abundance of datasets. We conducted a scoping review of the water quality literature and found that correlation and linear regression are by far the most used statistical tools. However, the accuracy of inferences drawn from ordinary least squares (OLS) techniques depends on a set of assumptions, most prominently: (a) independence among observations , (b) normally distributed errors , (c) equal variances of errors , and (d) balanced designs . Environmental data, however, are often faced with temporal and spatial dependencies, and unbalanced designs, thus making OLS techniques not suitable to provide valid statistical inferences. Generalized least squares (GLS), linear mixed-effect models (LMMs), and generalized linear mixed-effect models (GLMMs), as well as Bayesian data analyses, have been developed to better tackle these problems. Recent progress in the development of statistical software has made these approaches more accessible and user-friendly. We provide a high-level summary and practical guidance for those statistical techniques.
Correlation and linear regression are commonly used to assess water quality data.
Environmental data, however, are often characterized by temporal and spatial dependency structures in the data thus making ordinary least squares techniques inappropriate.
Generalized least squares, linear mixed, and generalized linear mixed-effect models, as well as Bayesian techniques, may be more suitable for such data.
Graphical Abstract

Anthropogenic activity influences the biological, chemical, and physical components of the environment. Environmental monitoring systematically measures these components over time to determine if changes have occurred or are occurring ( Yoccoz et al. 2001 ). Among the many measurement outcomes used in monitoring, such as atmospheric deposition ( Horb et al. in press ) or wildlife health ( Roberts et al. in press ), ambient water quality monitoring is intended to characterize broader chemical changes and enable the identification of potential risks to water resources, including its ability to support aquatic life or suitability for consumption, recreation, or other uses ( Eckner 1998 ). While any identified changes can provide context for evaluation of more localized monitoring activities such as end-of-pipe compliance monitoring ( Walker et al. 2002 ) or to evaluate the influence of diffuse exposure pathways ( Arciszewski et al. in press ), the incorporation of water quality into a monitoring program also has other advantages. Water samples can easily be obtained, and an increasing number of reliable analysis methods enable a wide range of chemical analytes to be quantified. This has led, in some cases, to the accumulation of large and often publicly available datasets (e.g., Open Government 2017 ). These datasets are typically evaluated via statistical analyses and comparison with relevant jurisdictional water quality guidelines including, but not limited to, local watershed or sub-watershed management framework targets and limits, provincial limits, and federal limits (e.g., Glozier et al. 2018 ).
While some purpose-driven data collection and analysis have clear techniques and criteria for assigning significance, such as measurements of E. coli in surface waters ( Eckner 1998 ), water quality analyses can also include undirected analyses to detect unknown, changing, or unusual conditions ( Wintle et al. 2010 ). Similarly, data may also be routinely collected in water quality programs without a specific statistical evaluation framework developed a priori . Additionally, water quality programs can continue on for decades, increasing the likelihood of changes in sampling methods, frequency, locations, and analytical precision, which may limit the use of statistical analyses ( Helsel et al. 2020 ). As with any data, analyzing water quality data requires careful consideration of both what the investigators hope to learn from the data and the state of the dataset itself.
Despite the potential challenges, most water quality research primarily utilizes conventional statistical tools based on the method of ordinary least squares (OLS). Techniques using OLS are popular because of their statistical power, familiarity, their analytical solvability, and computational simplicity ( McElreath 2020 ). OLS techniques, however, can also be quite restrictive because of statistical assumptions, which are often challenging to satisfy in environmental and field-based datasets. Those assumptions are (a) independence among observations (independence assumption), (b) normally distributed errors (normality assumption), (c) equal variances of errors (homoscedasticity assumption), and (d) a balanced design (identical sample size among factor levels) in the case of Analysis of Variance (ANOVA). In such cases when statistical assumptions cannot easily be satisfied, applying more appropriate methodologies, including mixed-effect models, can facilitate more effective decision-making by minimizing potential uncertainty in results of environmental data analyses.
In this work, we quantified the usage of specific statistical methods for the analysis of water quality data via a scoping review of literature. This review informs subsequent discussion around statistical assumptions and the selection of appropriate methods where those assumptions are violated. We further provide a high-level summary and practical guidance for those statistical techniques using a real-world water quality dataset. Analyses were carried out in the R Language for Statistical Computing ( R Core Team 2021 ) and all scripts are provided in Supplementary Material S1.
In this study, we conducted a scoping review of literature to quantify the number of statistical techniques used in water quality (WQ) research and identify patterns over time. Contrary to a full systematic review, a scoping review is conducted to identify the available literature on a topic in a systematic way but does not attempt to appraise the quality of the identified studies and their methodology ( Arksey & O'Malley 2005 ; Grant & Booth 2009 ; Peters et al. 2020 ).
The research question for the scoping review was ‘What statistical methods have been commonly used in analysis of water quality data?’, and conversely, ‘What suitable methods have not been used?’. Primary studies that focused on investigation of water quality or monitoring of water quality in ecosystems were identified by conducting a search using a pre-established list of statistical techniques and keywords. Eighteen statistical methods were identified as a basis for initial identification of studies including: Analysis of Variance (ANOVA), Bayesian Analysis, Cluster Analysis, Control Charts, Correlation, Correspondence Analysis, Factor Analysis, Kruskal–Wallis, Machine Learning, Mann-Kendall, Mann–Whitney, Generalized Linear Mixed-Effect Models (GLMMs), Linear Mixed-Effect Models (LMMs), Principal Component Analysis (PCA), Non-metric Multidimensional Scaling (NMDS), Regression, Simulation and Forecasting, and t -test. WQ studies that did not employ any of these methods were reviewed for additional or alternate methods, which were the basis for separate follow-up searches of the water quality literature. The Web of Science Core Collection database and Google Scholar were used to conduct this review covering a time frame from Jan 1, 1990 to Sep 27, 2020.
Frequencies of each statistical approach were plotted to determine the most common techniques for assessment of water quality in river ecosystems ( Figure 1(a) ). Many articles used more than one statistical approach (e.g., Pearson correlation in conjunction with linear regression analysis), and, in these cases, a single paper is counted in multiple categories. Of 24,819 identified references that assessed WQ in water ecosystems, 11,024 (44.4%) mentioned using at least one statistical approach. To address any potential bias, of 13,795 remaining articles, we randomly selected 580 (∼4%), for which full-texts were reviewed and new statistical methods were identified ( Figure 1(b) ). All references were reviewed by one reviewer and verified for inclusion by a second independent reviewer.

Number of papers identified by the scoping review, grouped by statistical techniques. (a) Classified papers through title and abstract search; (b) full-text search of a random sample of 580 papers that did not mention statistical techniques in the title and abstract.
The four most used statistical approaches included various simulation and forecasting methods ( N =5,374, 34.4%), correlation ( N =3,701, 23.7%), linear regression ( N =1,727, 11.1%), and PCA ( N =1,258, 8.1%), accounted for 77.3% of the entire classified literature ( Figure 1 ). Of the simulation techniques, the most commonly used method was the Soil and Water Assessment Tool (SWAT), a watershed scale-based model that has a continuous daily time-step ( Neitsch et al. 2011 ; Shawul et al. 2013 ; Worku et al. 2017 ) accounting for 19.8% of all identified simulation-specific papers.
Multivariate ordination techniques including correspondence analysis, factor analysis and cluster analysis, were used in 10.1% ( N =1,577) of publications ( Figure 1 ). Our review recorded the first use of Bayesian methods to analyze WQ in 1993 ( Varis et al. 1993 ) in a study considering different analytical techniques for a WQ forecasting system. In the 20 years that followed, only 83 papers mentioned using Bayesian analysis. In the 8 years that precede present-day, 197 papers were identified, indicating that the Bayesian approaches have become more frequently used, with published papers incorporating this family of methods steadily increasing ( Figure 2 ).

Number of papers identified by technique and year over the total number of papers recorded for the year. Techniques grouped by analytical categories.
Multilevel models are another group of statistical methods whose popularity has steadily been increasing in published WQ studies, particularly in recent years ( Figure 2 ). This family of analyses includes popular methods such as linear mixed-effect (LMMs) and generalized linear mixed-effect models (GLMMs). Multilevel models were first introduced by Laird & Ware (1982) to better address incorrect analysis of datasets using common statistical procedures such as t -test or ANOVA when certain statistical assumptions are not met, such as statistical independence among data points. Hawkins et al. (2010) described this problem and noted that, while ‘replication is a critical component in any type of assessment, its use in ecological assessment and monitoring has differed in important ways from its use in classic controlled experiments’. In ecological field experiments, while replicate samples taken within a site are often regarded as independent measures, they are in fact pseudoreplicates ( Hawkins et al. 2010 ). Consequently, analyzing such data using a t -test or similar approach inflates the likelihood of observing a statistically significant difference in means (increasing the probability of a Type I error). This phenomenon of pseudoreplication was defined by Hurlbert (1984) as ‘the use of inferential statistics to test for treatment effects with data from experiments where either treatments are not replicated or experimental units are not statistically independent’. By comparison, multilevel models avoid this problem as they do not require balanced data and they allow explicit modeling and analysis of between- and within-individual variation.
The first use of linear multilevel models (LMM) for water quality analysis in our paper sample was by Tate et al. (2003) , who looked at the effect of cattle feces distributions on water quality. Similar to the use of Bayesian approaches, multilevel models began to notably increase in popularity from 2012 onward, with only 10 WQ studies using the method between 2003 and 2012.
An understanding of how to select the most appropriate statistical methods is critical if practitioners are to make informed decisions. When inappropriate or suboptimal methods are applied to even the most robust datasets, consequences may include drawing false conclusions, including missing environmentally critical changes. To facilitate an improved understanding by practitioners, we briefly describe the difference between traditional or frequentist statistics and Bayesian statistics (Section 3.1). We then highlight key statistical assumptions within the traditional statistical framework and what other tools are available if these assumptions are not sufficiently met (Section 3.2). We further provide resources in the form of required functions and references to run those methods in the R Language for Statistical Computing (R Core Team 2021 ). Lastly, we use a publicly available water quality dataset to demonstrate the use case for more flexible statistical approaches such as multilevel models over traditional tools such as t -tests, ANOVA and simple linear regression techniques (Section 4).
Frequentist vs. Bayesian statistics
In contrast, the goal of Bayesian statistics is to estimate a probability distribution of unknown parameters given the observed data and some prior knowledge about those parameters in question. Incorporating prior knowledge into the calculation of the distribution of parameters is the defining feature of Bayesian statistics, and a key argument for why this approach could produce more realistic evaluations of data (i.e., because our prior knowledge is seldom zero, as is assumed in frequentist analysis). In Bayesian statistics, parameters are considered random variables and can therefore be modeled probabilistically and displayed in a distribution function unlike in frequentist statistics where parameters are assumed to be fixed. Bayesian statistics can answer questions such as ‘What is the probability that dissolved metal concentrations fall below a certain threshold level in a river ecosystem?’ Written probabilistically, we are asking ‘What is the probability of our hypothesis given the data, or P(hypothesis|data)?’ This is not possible in frequentist statistics, where we can only make statements about the probability of the observed data given a hypothesis, i.e., P(data|hypothesis) . In most cases, attaching a probability to a hypothesis, such as ‘there is a 70% probability that metal concentrations are above threshold levels’, feels more intuitive than attaching a probability to the observed data, such as ‘there is a 5% probability or less of observing our data if we assume metal concentrations are within threshold levels’ (frequentist interpretation of probability). The fact that the Bayesian interpretation of probability feels more intuitive may also explain the often-documented misinterpretation of the frequentist p -values ( Kruschke & Liddell 2018 ). Whether researchers should choose frequentist or Bayesian analysis should depend on the research context and questions and not simply on preference. For an in-depth discussion about Bayesian data analyses using R, see Kruschke (2015) and McElreath (2020) . We also provide a conceptual explanation of the Bayesian analysis approach with a simple dataset in Supplementary Material S2.
Implications of statistical assumptions on method selection
Linear regression is a well-known statistical technique routinely used to analyze data. Linear regression models a mean outcome or response variable as a linear function of, or conditioned on, one or more predictor variables using a straight line of best fit. While many methods are available to describe best-fit lines, the most common is the OLS method. The mathematical foundation of the OLS regression is the minimization of the sum of squared differences (or residuals) of the observed data to the regression line. Similar to other statistical techniques, OLS regression relies on assumptions. The method of least squares provides unbiased parameter estimates if the errors are independent (uncorrelated) and normally distributed around the regression line with a mean of zero and constant variance. While diagnostic methods to evaluate for statistical assumptions can be numerical, graphical methods are generally considered more versatile and informative ( Faraway 2016 ) which is usually done by inspecting the residuals for any obvious patterns that may be present and may reflect uncaptured systematic bias ( Zuur et al. 2010 ; Zuur & Ieno 2016 ).
While OLS models are constrained by assumptions that must be tested, they can be powerful tools when assumptions are met and can be easily calculated. For environmental scientists, however, field-collected data often present limitations on the use of simple linear regression techniques. Field data often do not meet assumptions because either measurements could not be taken, or measurements were in close proximity to each other and are not independent, or the observed response variable may not follow a normal distribution and may not even be linear at all, or any combination of the three. In such cases, using linear regression techniques could lead to biased parameter estimates and conclusions. Implications of violation of statistical assumptions of constant variance, normality, linearity, and independence are discussed in Sections 3.2.1 through 3.2.4, respectively and more appropriate techniques suitable for analyzing water quality data are provided.
Violation of the constant variance assumption
Whenever the assumption of constant variance (homoscedasticity) is violated, but the other assumptions hold, generalized least squares (GLS) techniques represent a more appropriate alternative. Constant variance is assumed across all values/levels of the predictor variable(s). Lack of homoscedasticity may result in biased standard errors and p -values. GLS allows errors to be correlated and/or have unequal variances as it allows us to model the within-group correlation and/or heteroscedasticity structure and therefore results in more accurate p -values. While it is possible to use variance stabilizing transformations to satisfy the constant variance assumptions in OLS models, it is generally not recommended since potentially important characteristics of the sampled data are removed ( Bolker et al. 2009 ; Zuur et al. 2009 ; Feng et al. 2014 ). Instead, choosing the appropriate statistical tool would be more appropriate. In R, GLS models can be run using the gls() function of the nlme package ( Pinheiro et al. 2020 ).
Violation of the assumption of normality
Quite often in environmental research the distributions of the collected sample data do not appear to be normally distributed at each value or at each level of the predictor variable. In fact, we often have only one observation at each value of a continuous predictor variable and cannot say anything about the normality assumption. Hence, in order to assess whether the data meets this assumption, we need to fit a model first and then inspect the distribution of the pooled residuals. Quite frequently those distributions look left or right skewed, or show other ‘non-normal’ attributes. Sometimes transforming the data (i.e., performing a mathematical operation on the data, such as taking the logarithm) can force data to comply with OLS model assumptions; however, by altering the original scale of the data, important information about the sample may be removed and any subsequent statistical tests are only valid on the transformed scale ( Feng et al. 2014 ). It can also make the interpretation of results cumbersome and unintuitive (e.g., reporting significant differences in ‘log transformed metal concentration’). In some cases, data transformations may even be incalculable, such as when many zeros are part of the data ( Bolker et al. 2009 ).
Generalized linear models (GLMs) offer an alternative as they accommodate response variables with non-normal error distributions ( Nelder & Wedderburn 1972 ; McCullagh & Nelder 1989 ; Faraway 2016 ; Dobson & Barnett 2018 ). The functional differences between OLS models and GLMs are (a) the response variable in GLMs can take on any distribution that is a member of the exponential family of probability distributions and (b) GLMs use a so-called link function, which describes how the mean of that response distribution and a linear combination of the predictors are related ( Faraway 2016 ).
Two very common GLMs are known as logistic regression, when observed data are binary, and Poisson regression, when observed data represent counts. Another very useful GLM, especially when data are continuous with no upper bound but truncated at zero, such as in concentrations, heights, and weights, is the gamma GLM. The gamma distribution is a very flexible continuous probability distribution that accommodates data with a wide variety of shapes. In R, GLMs can be run using the glm() function.
Lastly, another very useful technique is called beta regression. Beta regression can accommodate datasets containing proportion and percentages and as such provides support for data that naturally fall in between zero and one. In R, beta regression can be run using the betareg() function of the betareg package ( Cribari-Neto & Zeileis 2010 ).
Violation of the assumption of linearity
It is common in nature for observations to not follow linear trends. In these cases, neither OLS models nor GLMs are appropriate analytical tools. In these cases, non-linear least squares ( Baty et al. 2015 ) or generalized additive modeling represent suitable alternatives ( Zuur & Ieno 2016 ; Stasinopoulos et al. 2017 ; Wood 2017 ). Generalized additive models (GAMs) are GLMs with a linear predictor involving one or more smoothing functions at each covariate. Smoothing functions allow relationships within GAMs to be sinuous or wiggly, and thus permit great flexibility for modeling non-linear relationships. The risk when using non-linear or generalized additive models, however, comes in the form of overfitting, i.e., when too many smoothing functions are added into the model. The general problem with overfitting is that the model becomes less and less useful in generalizing the results and predicting future observations. In R, GAMs can be run, for example, using the mgcv package ( Wood 2017 ).
Violation of the assumption of independence
Very often in field based or environmental research the assumption of independence cannot be satisfied. In this case, multilevel models are the most appropriate choice as they allow us to account for temporally and spatially repeated measurements as well as for unbalanced datasets, i.e., when the target variable has more observations in one specific class than the others. Furthermore, they enable assessments of variation among plants, animals, ecosystems, and other groupings or clusters, and do not require data averaging before conducting the analysis. Multilevel regression models represent by far the most useful models in science. In fact, McElreath (2020) argues that ‘[…] multilevel regression deserves to be the default form of regression. Papers that do not use multilevel models should have to justify not using a multilevel approach’ (p. 15). Multilevel models such as LMMs and GLMMs require the inclusion of random effects and optionally fixed effects ( Pinheiro & Bates 2000 ; Bolker et al. 2009 ). Fixed effects are those variables for which parameters such as the mean or the slope are estimated, while random effects are grouping terms that account for the dependency structure in the data and estimate the variation within those groups. In R, such models can be run for example using the lme4 package ( Bates et al. 2015 ) and the function lmer() and glmer() or the glmmTMB package ( Brooks et al. 2017 ) with the glmmTMB() function. The glmmTMB() function also allows us to specify various covariance structures to deal with autocorrelation ( https://cran.r-project.org/web/packages/glmmTMB/vignettes/covstruct.html ).
Other challenges in the analyses of water quality data
While solutions to violations of statistical assumptions are available, other challenges can also affect the availability of techniques. A common problem in water quality analyses is the occurrence of censored observations and many censoring limits ( Helsel 2006 , 2012 ). Some approaches to overcome these limits include non-parametric techniques, but robust approaches which can address all possible constraints common in water quality datasets are not widely available, although they can be combined with other techniques to identify changes in environmental indicators ( Arciszewski et al. 2018 ). Similar to the selection of techniques described above, the use of techniques for censored data is based on the attributes of the data and the desires of the investigators.
To demonstrate the issues with respect to statistical assumptions when analyzing environmental data, we chose a multi-year, multi-station surface water quality monitoring project along the Athabasca River in northeastern Alberta. The goal of this monitoring project was to assess surface water quality (including spatial and temporal trends) in relation to potential impacts of oil-sands mining activities ( Glozier et al. 2018 ). Multiple water samples were taken at six sampling stations along the Athabasca River ( Figure 3 ) over an 8-year period. The experimental design could be described as a crossed-nested multilevel design with six sampling stations along the Athabasca River sampled over a time period from 2011 to 2018 (i.e., crossed) and sampling dates (month-day) nested in years. Our hypothetical research question was whether there are significant differences in vanadium (V) concentrations along the sampling stations and among years. In the Oil Sands Region, the mobilization of V is associated with both industrial development and natural exposures ( Glozier et al. 2018 ; Gopalapillai et al. 2019 ) and is suitable and useful to illustrate the approaches advocated here.

Locations of water quality sampling stations (M2–M7) monitored in the Mainstem Athabasca Water Quality Program, as part of the joint Canada-Alberta governments’ Oil Sands Monitoring program.
The data are publicly available ( https://data.ec.gc.ca/data/substances/monitor/surface-water-quality-oil-sands-region/mainstem-water-quality-oil-sands-region ). From there we downloaded the following file: ‘MainstemWaterQuality-LTWQM-M2-M7-Metals45-EPA-2011-2018-v2’ and prepared it for data analysis in R ( R Core Team 2021 ). All R scripts for data preparation, descriptive statistics as well as the statistical analyses can be found in Supplementary Material S1. All analyses were conducted in R version 4.1.2 (2021-11-01) – ‘Bird Hippie’ with packages updated on Jan 4, 2022.
The first step in our example is to visualize the raw data ( Figure 4 ). Visualizing the raw data can help determine which statistical analyses might be most appropriate and whether there are any underlying problems in the data. Figure 4(a) shows the data points across years and grouped by sampling stations. To quickly check whether the data show any signs of seasonality we uniquely colored the points representing the quarters, i.e., Jan to Mar, Apr to Jun, Jul to Sep, and Oct to Dec. This information could be helpful at the data analysis stage, for example by identifying additional model terms that potentially explain variation due to seasonality and hence improve the overall fit of the model. In the context of water quality in rivers, such variables could be water displacement and water depth. These data suggest that a generic variable, such as season or quarter, can be used to account for effects of flow where no stream gauges are present.

Raw data visualization of vanadium concentrations in the Athabasca River.
Figure 4(b) visualizes the data using boxplots. Boxplots are an effective way to check the variation and shape of the data. At this point, some expected patterns emerge from the box plots, such as increases in concentrations between M2 and M7 in 2016, but it also becomes clear that this dataset has various problems such as missing data, skewed data, as well as unbalanced data (see also Table 1 ). Figure 4(c) shows yet another visualization of the raw data, which are known as density curves. Density curves can help identify skewness, multimodality and other issues with respect to the data distribution and hence can help choose the appropriate distribution for the final statistical model.
Number of sampling dates by year and sampling station
Note: Within each sampling date, multiple transect measurements were taken.
Lastly, since the data show nesting structures (e.g., sampling dates nested in years) as well as multiple measurements along a transect (potential violation of the assumption of independent sampling), it becomes clear that analyzing this dataset using an OLS approach, e.g., ANOVA, linear regression, etc., is not advisable. Instead, multilevel models should be employed ( Zuur et al. 2009 ). For our example, we decided to use a GLMM since it can account (a) for the nesting structure, (b) for the dependency structure, and (c) for the non-normal distribution of the data. For this model, we used the gamma distribution since it is naturally truncated at zero, which makes sense since we have concentration data that cannot be negative. One frequently observed problem when using OLS techniques on data that cannot be negative, e.g., biomass, height, or concentrations, is that confidence intervals can extend into the negative. This is not possible when using the gamma distribution. Another benefit of the gamma distribution is its ability to model highly left as well as right skewed data.
Model output for the generalized linear mixed-effect model using the glmmTMB() function
CI=95% confidence interval, p = p -value.
Significant p-values are indicated in bold (α = 0.05).
The model results were significant for Year but not for Station ( Table 3 ). The next step is to check the fit and usefulness of the model given the underlying data. This assessment was done using the DHARMa package ( Hartig 2021 ). The ‘DHARMa’ package uses a simulation-based approach to create readily interpretable scaled (quantile) residuals for fitted (generalized) linear mixed models. The default output of the simulateResiduals() function is a plot with two panels. The first (left) panel is a QQ plot to detect overall deviations from the expected distribution. If the chosen distribution provides a perfect fit, all data points would fall on the red line. The second (right) panel plots the residuals against the predicted values. If no residual patterns are detected, the model fits the data accurately only leaving random errors. If residual patterns are present (indicated by red wiggly lines), removing or adding model terms (fixed effects and/or random effects) can help capture unexplained systematic variation. Figure 5 shows the residual plot for our model. Both the QQ plot residuals, as well as the residuals vs. the predicted values, showed significant deviations from what would be expected if the model would adequately describe the data. This information needs to be kept in mind when judging the usefulness of the model as well as when interpreting significant differences and p -values.
Analysis of deviance table with Chi-Square score, degrees of freedom and p -value for the fixed effect terms, station_id and year (yr)

Residual diagnostic plots. Please refer to the online version of this paper to see this figure in colour: https://doi.org/10.2166/wqrj.2022.028 .
The next step was to calculate mean values based on the fitted model. This can be done using estimated marginal means. Those mean values are also known as lsmeans (or least squares means) in other statistical software packages. In R, estimated marginal means were calculated using the emmeans package and the emmeans() function ( Lenth 2020 ). The next step was to add letters to the mean values using the cld() function of the multcomp package to indicate significant differences for the factor Year ( Figure 6 ).

Output of the generalized linear model fit using the glmmTMB() function. Estimated marginal means for Station (a) and Year (b). Error bars represent 95% confidence intervals.
Next, we also fitted the same model as a Bayesian model using the brms R package and the brm() function ( Bürkner 2017 , 2018 ; Table 4 and Figure 7 ). The brms package provides straightforward tools for fitting Bayesian models, following the identical model specification syntax as in lme4 ( Bates et al. 2015 ) or glmmTMB ( Brooks et al. 2017 ). Since this an illustrative example only, we used flat (uninformative) priors for this analysis, hence both models resulted in almost identical outcomes. Table 5 shows the default flat priors used by the brm() function given the model specification. This information can be requested using the get_priors() function and modified in accordance with the investigators' prior beliefs. Furthermore, choosing minimally informative priors over flat priors is generally recommended when running a Bayesian analysis ( Lemoine 2019 ). Model validation in a Bayesian context is done by inspecting the posterior distributions, MCMC (Markov chain Monte Carlo) chains as well as by conducting posterior predictive checks. Functions for conducting these model checks are available in the brms package, such as plot() and pp_check() .
Model out for the Bayesian multilevel model using the brm() function
CI=95% credible interval.
Default priors of the fitted model
The brms package does not require to specify the priors. In this case, it uses default priors given the specified model. This output can be generated using the get_priors() function.

Output of the Bayesian generalized linear model fit using the brm() function. Posterior predictive means for Station ID (a) and Year (b). Error bars represent the 95% credible intervals. Note: credible intervals are a Bayesian version of the frequentist confidence intervals but are not interpreted in the same way.
In both analyses, we found similar point estimates and 95% confidence/credible intervals for vanadium concentration for sampling station and year ( Figures 6 and 7 ). The frequentist approach suggested that there are significant differences between sampling years but not sampling stations ( Figure 6 ). The Bayesian analysis does not provide frequentist p -values and significant differences. Instead, it generates posterior probability distributions for all model terms, which contain all possible vanadium concentrations given the data and prior information. This allows the researcher to make probabilistic statements about hypotheses given the data, such as ‘what is the probability of observing a specific metal concentration for a given sampling station?’. This is in contrast to frequentist statistics where statements are made about the probability of observing the collected data given a null hypothesis (see Section 3.1). It should also be noted that the interpretation of the aforementioned confidence and credible intervals for frequentist and Bayesian inference is different. In a frequentist setting, a confidence interval represents one possible interval that either contains the true population parameter or not. A 95% confidence interval means that (on average) out of 100 identically repeated experiments, 95 calculated confidence intervals will contain the true population parameter (see simulation in Supplementary Material S3). On the other hand, the Bayesian 95% credible interval contains all possible vanadium concentrations at a given sampling station with 95% probability. This is possible since Bayesian analysis treats parameters as random variables and computes posterior probability distributions, which include all possible values of that parameter given the data. To learn more about how to report Bayesian data analyses in scientific publications, please refer to the Bayesian analysis reporting guidelines by Kruschke (2021 ).
Lastly, we would also note that there may be cases where datasets simply cannot be meaningfully analyzed even using the most sophisticated inferential statistical techniques due to various problems with the underlying data collection. In such instances, a thorough descriptive statistical approach, including raw data visualizations, may still be very useful in extracting important information.
In this study, we conducted a scoping review of literature to quantify the number of statistical techniques used in water quality (WQ) research and identify patterns over time. We further built on the results and highlighted useful statistical techniques for water quality assessment with simple guidance for practitioners.
The most frequently used statistical approaches included simulation and forecasting methods, correlation, linear regression, and PCA. Simulation techniques do not provide direct information on water quality, but rather provide results and trends in the context of water processes and functioning of water systems. Similarly, PCA provides descriptive rather than inferential information and is most commonly used in exploratory data analysis as well as being a tool for dimensionality reduction. Correlation and regression may appear more appealing techniques to infer water quality, however, field data typically are not normally distributed or independent. As a result, the estimates and conclusions may be biased.
Consequently, multilevel models that do not require balanced data and that allow explicit modelling and analysis of between- and within-individual variation are more appropriate because they better address analyses of datasets when traditional statistical assumptions are not met, which is frequently observed in ecological research. Moreover, Bayesian inference may be suitable for decision making especially when there is prior information available on datasets that are being analyzed.
When inappropriate or suboptimal methods are applied to even the most robust datasets, consequences may include drawing false conclusions, including missing environmentally critical triggers or changes. In agreement with recommendations of McElreath (2020) , we suggest that multilevel models in ecological datasets, including water quality analyses, should be the default statistical approach.
The authors acknowledge the financial support of the Oil Sands Monitoring Program (OSM). While this work was funded by OSM, it does not necessarily reflect the position of the Program. We thank Eleanor Stern for abstract and full-text screening for the scoping review. We also want to thank Dr Florian Hartig for comments on an earlier version of this manuscript.
All relevant data are included in the paper or its Supplementary Information.
Supplementary data

Affiliations
- ISSN 2709-8044 EISSN 2709-8052
- Open Access
- Collections
- Subscriptions
- Subscribe to Open
- Editorial Services
- Rights and Permissions
- Sign Up for Our Mailing List
- IWA Publishing
- Republic – Export Building, Units 1.04 & 1.05
- 1 Clove Crescent
- London, E14 2BA, UK
- Telephone: +44 208 054 8208
- Fax: +44 207 654 5555
- IWAPublishing.com
- IWA-network.org
- IWA-connect.org
- Cookie Policy
- Terms & Conditions
- Get Adobe Acrobat Reader
- ©Copyright 2024 IWA Publishing
This Feature Is Available To Subscribers Only
Sign In or Create an Account
# Type at least 1 character to search # Hit enter to search or ESC to close

No products in the cart.
Product Categories
- New Products
- Dissolved Oxygen
- Conductivity
- Temperature
- Oxygen (gas)
- Atlas Iot - Raspberry Pi Software
- AtlasDesktop
- Dosing Pumps
- Color Sensing
- Flow Meters
- Float Switches
- Probe Mounting
- EZO-Complete
- Waterproofing
- Carrier Boards
- Calibration Solutions
- Electrical Isolation
- Embedded Solutions
- EZO™ Accessories
Featured Products

- Distributors
- Calculators
- Privacy Policy
- Return Policy
A Complete Guide To Water Analysis Methods In Industries
- November 3, 2023

Share This Post
Water analysis refers to the process of testing and evaluating the quality of water. It involves examining various physical, chemical, and biological properties to determine the quality of water. These results help to identify any potential health risks or environmental concerns associated with the water source being analyzed.
Water analysis is a vital process used to assess the quality and composition of water. It is a critical step to ensure that water is safe and clean for drinking, industrial use, agriculture, and aquatic ecosystems, just to name a few. The water analysis process involves measuring various parameters (like pH, conductivity, etc) and contaminants present in the water to ensure its safety for consumption and suitability for specific applications.
What Is The Need For Water Analysis Methods?
One of the main reasons why water analysis is important is to ensure that the water we consume on a daily basis, is safe for drinking. Contaminated water can pose serious health risks, as the water may contain harmful bacteria, viruses, chemicals, or heavy metals. Therefore, if we conduct regular water analysis, we can identify any potential threats and take appropriate measures to treat or filter the water and improve the quality, before it reaches our taps. This is particularly vital for more vulnerable people such as children, pregnant women, and people who have compromised immune systems. These people are typically more susceptible to waterborne diseases.

Water analysis is also essential for environmental monitoring and protection. By analyzing the water in rivers, lakes, and oceans, scientists and environmentalists can assess the health of aquatic ecosystems and identify any pollutants or contaminants that may be affecting aquatic life. This information helps in planning effective conservation and management strategies to preserve these fragile ecosystems.
Water analysis also provides valuable data for research purposes, such as studying various aspects of water quality and its impact on different ecosystems and species. This data helps in understanding the long-term effects/trends, identifying emerging contaminants, and developing new technologies or treatment methods to address water-related challenges.
The Importance Of Water Analysis Methods In Industries
Water analysis methods are crucial for a wide range of industries that rely on water for their operations, like the food and beverage industry . In this industry, water is used extensively in daily operations, such as cleaning, cooking, and ingredient preparation. Therefore, it is essential to analyze the quality of water at different points along the process to ensure that it meets the required standards for consumption and production. By completing a water analysis, you can detect any contaminants or impurities that may affect the taste, safety, and overall quality of the final product(s).

Another industry that heavily relies on water analysis methods is the pharmaceutical industry . Water is a critical component in the manufacturing of pharmaceutical products, including drugs and vaccines in equipment such as bioreactors . The purity and quality of water used in these processes are of utmost importance to ensure the safety of the end products.
The agriculture industry is also heavily dependent on water analysis methods. Irrigation is a vital stage in agriculture, and therefore, water quality plays a significant role in crop growth and yield. Analyzing the water used for irrigation helps pinpoint any harmful substances, such as pesticides or heavy metals, that may be present in the water. This allows farmers to take appropriate measures to mitigate any negative impacts on their crops, ensure the safety of their produce, and prevent contaminating surrounding areas from surface runoff.
Additionally, power generation and oil refineries require water analysis methods to monitor the quality of water used for cooling systems and steam generation. Contaminants in water can easily lead to corrosion, scaling, and fouling of equipment, which can result in reduced efficiency and increased maintenance costs. Therefore, regular water analysis is essential to maintain smooth operations and follow safety precautions.
Types Of Water Analysis Methods
Water quality analysis is a practice that involves examining the properties and parameters of water to ensure its safety and cleanliness.
Chemical Water Analysis Methods

Chemical analysis is a fundamental part of water quality analysis. It requires testing for different chemical parameters to identify contaminants and assess their levels in water. Some of the commonly tested chemical parameters include ammonia, chloride ion, nitrite, nitrate, phosphate, and water hardness.
Chloride Ion: The concentration of chloride ions in water can indicate contamination levels and the potential presence of saline water. High chloride ion levels can lead to a salty taste in water and may cause corrosion in water pipelines. These not only negatively affect the quality of water, but they can also incur higher maintenance costs.
Ammonia: Ammonia is often a byproduct of organic matter decomposition and can often be found in water sources. Ammonia concentrations increase with the use of chloramine in water disinfection processes. High levels of ammonia in drinking water can have adverse health effects, and its presence may lead to distinctive tastes and odors.
Nitrite & Nitrate: Nitrite and nitrate are forms of nitrogen that can be found in water due to organic matter decomposition and atmospheric nitrogen fixation. Nitrite can be toxic, especially in high concentrations, and can cause health issues such as “blue baby syndrome” in infants. Nitrate, on the other hand, enhances the growth of aquatic plants and can contribute to water eutrophication in natural water systems, where excessive plant growth in ponds and lakes takes place.
Phosphate: Phosphate is present in water in various forms, including dihydrogen phosphate (H2PO4-), polyphosphate (polyP), and organic phosphate. Phosphate fundamentally comes from agricultural waste, sewage, and industrial effluents. While phosphate itself is not toxic, high concentrations can lead to water eutrophication.
Hardness: Water hardness refers to the presence of calcium and magnesium salts in water. Temporary hardness is caused by carbonate and bicarbonate ions, while permanent hardness is due to chloride and sulfate ions. Hard water can have certain benefits for drinking purposes, but excessive levels of certain ions can be a nuisance because of scale buildup.
Physical Water Analysis Methods

Physical analysis of water involves assessing its various physical properties, such as temperature, color, turbidity, and conductivity. These parameters provide valuable information about the clarity and suitability of water for various purposes.
Temperature: Water temperature plays a significant role in various physical and biological processes as it affects the dissolved oxygen content, the solubility of gases, and the growth of aquatic organisms. Temperature measurements are simple, yet essential for understanding the overall health and functioning of aquatic ecosystems.
Color: The color of the water can indicate the presence of suspended or dissolved substances. Apparent color refers to the color caused by suspended matter, while true color is caused by dissolved solids. Also, excessive color in water can be aesthetically unpleasant and may indicate the presence of organic compounds that can interfere with disinfection processes.
Turbidity: Turbidity is important as it measures the extent to which light is absorbed or scattered by suspended particles in water . It indicates the presence of particulate matter, such as sediment (like soil), algae, or organic particles, and can easily be measured with a turbidity meter . The problem with high turbidity levels is that high turbidity can affect the aesthetics of water and cause issues with disinfection processes.
Conductivity: Conductivity measures the ability of water to conduct an electrical current, which is influenced by the presence of dissolved salts, minerals, and other ions. The greater the number of ions, the higher the conductivity level . Conductivity provides insights into the overall mineral content and salinity of water and its suitability for various applications and industries.
Biological Water Analysis Methods
Biological analysis focuses on assessing the presence of microorganisms and other biological indicators in water. These indicators can provide an understanding of the overall health and safety of the water. A good example is bacteria testing.

Bacteria testing is essential in determining the safety and potability (suitability for drinking) of water. One of the most common bacteria tested for is E. coli, which is an indicator of fecal contamination. High levels of E. coli in water can indicate the presence of harmful pathogens that can pose serious health issues when consumed. Bacteria testing helps in identifying potential microbial contamination like E.coli and ensures the safety of water for drinking and other uses.
The Role Of Water Testing Laboratories
Water testing laboratories have a crucial role in water quality analysis. These specialized facilities are equipped with advanced instruments and trained personnel to perform a wide range of tests and analyses. Laboratories provide environments that ensure accurate and reliable results, which are essential for making informed decisions regarding water management and treatment.

Water testing laboratories also offer a comprehensive suite of tests, and follow standardized protocols and quality control measures to ensure the accuracy and precision of their results. Water analysis labs therefore can provide expert guidance and interpretation of the data obtained to help industries understand the implications of poor water quality and take appropriate actions.
Water Analysis: Understanding Analytical Methods
Analytical methods are procedures designed to measure the concentration of specific contaminants in water samples. These methods provide a structure for collecting, preserving, and storing samples, in addition to separating, identifying, and quantifying contaminants. Analytical methods also establish quality control criteria and outline the reporting standards.
Analytical methods serve many purposes, including demonstrating regulation compliance, meeting monitoring objectives, and providing data for water samples that require routine analysis. These methods typically have upper and lower limits within which the concentration of drinking water contaminants should be. They also incorporate quality control measures to ensure accurate and reliable results.
Development & Evaluation Of Water Analysis Methods
Abbreviations:
- ASTM: American Society for Testing & Materials
- DIN: German Institute of Norms
- EN: European Unions
- EPA: Environmental Protection Agency (US)
- ISO: International Organization for Standardization
- SCA: Standing Committee of Analysts (Blue Books)
- SLMB: Swiss Book for the Analysis of Food
- USP: United State Pharmacopoeia
Analytical methods used in water analysis are developed by various organizations, including governmental bodies like the EPA, consensus method organizations such as Standard Methods and ASTM International, universities, water labs, and commercial distributors.
The EPA evaluates methods developed by others through its Alternate Test Procedure Program . This program assesses the accuracy, precision, and reliability of analytical methods from different sources.
EPA approval of methods occurs when regulating new contaminants or through other rulemaking actions. The accelerated approval process is employed to streamline the approval of drinking water analytical methods. Laboratories supporting public water systems are required to use EPA-approved methods for analyzing samples to demonstrate compliance with drinking water regulations.
Major Parameters & Corresponding Water Analysis Methods
Water analysis encompasses the measurement of various parameters and contaminants. Below are some of the most common parameters that are analyzed and the corresponding analytical methods.
Electrical Conductivity

Electrical conductivity is a key parameter used to assess the salinity and total dissolved solids in water. It provides insights into the water’s ability to conduct an electric current.
Several standard methods are employed to determine electrical conductivity in water samples, including ASTM D 1125 , EPA 120.1, ISO 7888, DIN EN 27888, and USP 645.

The pH value of water indicates its acidity or alkalinity and is an essential parameter to assess water quality .
ASTM D 5464, EPA 150.2, DIN EN ISO 10523, SCA 14, and SLMB 602.1 are some of the standard methods used to measure the pH value of water.
Fluoride is a naturally occurring mineral that, when present at excessive levels, can have detrimental effects on human health. The analysis of fluoride in water samples is crucial to ensure that its concentration falls within acceptable limits.
ASTM D 1179, ASTM D 3868, DIN 38405-4, EPA 340.2, ISO 10359-1, SCA 62, and SLMB 626.1 are some of the standard methods employed for fluoride analysis.
Ammonium & Total Kjeldahl Nitrogen
Ammonium and Total Kjeldahl nitrogen (TKN) are parameters used to assess the presence of nitrogen compounds in water samples. They provide insights into the levels of organic and inorganic nitrogen in water, which can indicate pollution and potential health risks.
ASTM D 1426, ASTM D 3590, DIN 38406-5, EPA 350.2, EPA 350.3, EPA 351.3, EPA 351.4, ISO 5663, ISO 5664, ISO 6778, SCA 126, and SLMB 631.1 are some of the standard methods employed for the analysis of ammonium and TKN.
Ion Chromatography
Ion chromatography is a widely used technique for the analysis of anions and cations in water samples. It involves the separation and quantification of various ions, providing insights into the chemical composition of the water.
ASTM D 4327, ASTM D 5085, ASTM D 5257, ASTM D 5542, ASTM D 5996, ASTM D 6581, ASTM D 6919, EPA 218.6, EPA 300.0, EPA 300.1, EPA 314.0, EPA 317.0, DIN EN ISO 10304-1, DIN EN ISO 10304-3, DIN EN ISO 10304-4, DIN EN ISO 14911, DIN EN ISO 15061, SCA 631.1, and SLMB 658.1 are some of the standard methods employed for ion chromatography.
Instrumental Methods Used In Labs
Apart from the field-testing methods, instrumental methods are used in laboratory settings to analyze water samples. These methods employ sophisticated electronic instrumentation to measure trace levels of contaminants and provide rapid and accurate results.

- Ion chromatography: Measures trace levels of anions
- Atomic absorption spectroscopy, inductively coupled ion spectroscopy, and x-ray fluorescence spectroscopy: Detects trace levels of different elements
- Gas chromatography: Used to quantify volatile compounds
- High-pressure liquid chromatography: Used to separate and detect trace organic compounds in antimicrobial systems
- Total organic carbon: Used to determine the number of organics in water where leaks or organic fouling of resins has occurred
- Nuclear magnetic resonance spectroscopy: Used to evaluate the structure of organic polymers and other water treatment chemicals
- Fourier-transform infrared analysis: Used to identify and quantify the composition of boiler and cooling system deposits
How To Prepare & Collect Samples For Water Analysis
To ensure accurate and meaningful results, proper sample collection and preparation are essential in water analysis.
Firstly, it’s important to understand the different methods of water analysis. Various tests and parameters can be measured, such as pH level, dissolved oxygen, turbidity, and the presence of contaminants like bacteria or heavy metals. Depending on the specific analysis you want to perform, you should select the appropriate method and collect the sample accordingly.
To start with, make sure you have the necessary equipment before collecting water samples. You will need clean and sterile bottles or containers to avoid contamination. It’s recommended to use glass or high-quality plastic containers that are specifically designed for water sampling. You should also have gloves, a waterproof marker, and labels to properly identify and record the samples.

Next, it’s important to choose the correct sampling location. The location should be representative of the water source you are analyzing. For example, if you are testing the quality of tap water in your home, you should collect the sample directly from the tap. If you are analyzing water from a river or lake, choose a spot that is away from any potential sources of contamination, such as industrial areas or sewage outlets.
When collecting the water sample, always take precautions to minimize any potential contamination. Start by rinsing the sampling container thoroughly with the same water source you are collecting from. This helps remove any impurities or residues that may affect the analysis results. Then, carefully fill the container without allowing it to touch any surfaces or come into contact with your hands.
It’s important to collect enough water for the analysis. The amount required may vary depending on the specific test or analysis method. Generally, it’s recommended to collect at least 500 milliliters (ml) of water for most standard tests. However, for more comprehensive analyses or if you need multiple tests done, you may need larger samples.
After collecting the sample, ensure that it is properly labeled and recorded. Labeling should include important information such as the location, date, and time of collection. This information is crucial for accurate data interpretation and comparison with future analyses.
Finally, take proper care of the collected samples until they reach the laboratory for analysis. Keep them in a cool and dark place to minimize any potential changes in their properties. If possible, transport them in a cooler with ice packs to maintain their temperature during transit.
Samples should be cooled to room temperature before testing, typically ranging from 21-26°C (70-80°F) – a temperature of 25°C is recommended for the majority of water analysis methods . Filtration through 0.2-2.5 µm filters may be necessary to remove particulate matter and ensure the purity of the sample.
Water Collection Methods
One common method for collecting water samples is the grab sampling technique . This involves using a clean container, such as a glass bottle or a plastic bag, to directly collect a sample of water from a specific source.
It is important to choose a container that is free from any contaminants that could alter the composition of the water being collected. To ensure accuracy, it is recommended to collect multiple grab samples from different locations within the water source. This helps to account for any variations in water quality that may exist across the area being sampled.
Another method for collecting water samples is the composite sampling technique . This involves collecting multiple grab samples over a specific period, usually 24 hours, and combining them into one representative sample.

The purpose of composite sampling is to obtain an average composition of the water over a given period. This method is often used when monitoring water quality over an extended period or when testing for contaminants that may fluctuate throughout the day.
Water analysis methods play a vital role in assessing the quality and safety of water for various applications. By employing standardized water analytical methods, industries can ensure accurate and reliable results, promoting the overall health and well-being of communities and ecosystems.

If you have any questions regarding water quality analysis, or what water quality testing kits we offer, do not hesitate to contact the world-class team at Atlas Scientific .
Conductivity Probes & Circuits

pH Probes & Sensors

Subscribe To Our Newsletter
Get product updates and learn from the best, more to explore.

The Importance Of ORP In Wastewater Treatment
Oxidation-reduction potential (ORP) is a control parameter frequently used in water treatment systems such as wastewater treatment which works to monitor the effectiveness of the disinfection process. This way, ORP can be used to measure the oxidizing or reducing potential of the wastewater, ensuring the correct amount of additives like chlorine or hydrogen peroxide are

The Importance Of pH In Hair Products
By maintaining the correct pH balance as it affects the condition of hair cuticles, you can preserve the health and vitality of your hair. When the pH level inside hair deviates from the optimal pH range, it can cause issues with breakage, diminished appearance (shine), and frizz. So, next time you select a new hair
Want to learn more about our products?
Atlas scientific | all rights reserved © 2024.
To track your order please enter your Order ID in the box below and press the "Track" button. This was given to you on your receipt and in the confirmation email you should have received.
Billing email
- be_ixf; dotnet_sdk; dotnet_sdk_1.4.12
- iy_2024; im_05; id_02; ih_15; imh_04; i_epoch:1714687484549
- ixf-compiler; ixf-compiler_1.0.0.0
- py_2024; pm_04; pd_14; ph_13; pmh_01; p_epoch:1713124866319
- bec-built-in; bec-built-in_1.0.0; bodystr
- pn_tstr:Thu May 02 15:04:44 PDT 2024; pn_epoch:1714687484549
Water Quality Parameters
Water quality parameters include chemical, physical, and biological properties and can be tested or monitored based on the desired water parameters of concern. Parameters that are frequently sampled or monitored for water quality include temperature, dissolved oxygen, pH, conductivity, ORP, and turbidity. However water monitoring may also include measuring total algae, ISEs (ammonia, nitrate, chloride), or laboratory parameters such as BOD, titration, or TOC.
Ammonia, Ammonium

Biochemical Oxygen Demand (BOD)

Blue-Green Algae

Chlorophyll

Colorimetry & Photometry Parameters

Conductivity
Resistivity, Salinity, Specific Conductance, Total Dissolved Solids

Dissolved Oxygen

Life Science Parameters
Ammonium, Choline, Ethanol, Galactose, Glucose, Glutamine, Glutamate, Glycerol, Hydrogen peroxide, Lactate, Lactose, Methanol, Potassium, Sucrose, Xylose

Oil, Hydrocarbon

ORP / Redox

Photosynthetic Active Radiation (PAR)

Temperature

Total Organic Carbon (TOC)

Featured Products
Prodss multiparameter digital water quality meter.
The Ultimate Sampling Handheld. Portable Digital Meter for DO, Conductivity, Salinity, TDS, pH/ORP, Turbidity, Algae, Temperature and more
$2,053.50 - $2,701.50
EXO2 Multiparameter Sonde
Multiparameter Water Quality Sonde for Unattended Monitoring (7 sensor ports, including a central wiper port)
Request Pricing
IQ SensorNet 2020 3G Controller
Modular water quality monitoring system for a complete sensor network that measures up to 20 parameters
Pontoon Vertical Profiling System
Ideal for Ponds, Lakes, Reservoirs, and Certain Coastal Applications
ProSolo Optical Dissolved Oxygen Meter
Portable Optical Dissolved Oxygen, Conductivity, Salinity, and Temperature Digital Handheld Meter
2900M Online Monitor & Control System
Two Chemistry Online Monitor & Control System
MultiLab 4010-3W
Three channel benchtop multiparameter instrument with wireless capability
HYCAT Autonomous Surface Vehicle
Autonomous Surface Vehicle
Amazon Bubbler
Self-contained Continuous Flow Bubbler with Fully Integrated Pressure Sensor
$4,103.00 - $4,464.00
IQ SensorNet Alyza Analyzer PO4
IQ SensorNet Orthophosphate Analyzer
Click through the PLOS taxonomy to find articles in your field.
For more information about PLOS Subject Areas, click here .
Loading metrics
Open Access
Peer-reviewed
Research Article
Water quality assessment and source identification of the Shuangji River (China) using multivariate statistical methods
Roles Conceptualization, Formal analysis, Investigation, Methodology, Writing – original draft
Affiliation School of Ecology and Environment, Zhengzhou University, Zhengzhou, China
Roles Data curation, Resources, Supervision, Writing – review & editing
* E-mail: [email protected]
Affiliation School of Architecture, Zhengzhou University, Zhengzhou, China
Roles Writing – review & editing
Roles Data curation, Funding acquisition, Project administration, Resources, Supervision, Writing – review & editing
- Junzhao Liu,
- Dong Zhang,
- Qiuju Tang,
- Hongbin Xu,
- Shanheng Huang,
- Dan Shang,
- Published: January 22, 2021
- https://doi.org/10.1371/journal.pone.0245525
- Peer Review
- Reader Comments
Multivariate statistical techniques, including cluster analysis (CA), discriminant analysis (DA), principal component analysis (PCA) and factor analysis (FA), were used to evaluate temporal and spatial variations in and to interpret large and complex water quality datasets collected from the Shuangji River Basin. The datasets, which contained 19 parameters, were generated during the 2 year (2018–2020) monitoring programme at 14 different sites (3192 observations) along the river. Hierarchical CA was used to divide the twelve months into three periods and the fourteen sampling sites into three groups. Discriminant analysis identified four parameters (CODMn, Cu, As, Se) loading more than 68% correct assignations in temporal analysis, while seven parameters (COD, TP, CODMn, F, LAS, Cu and Cd) to load 93% correct assignations in spatial analysis. The FA/PCA identified six factors that were responsible for explaining the data structure of 68% of the total variance of the dataset, allowing grouping of selected parameters based on common characteristics and assessing the incidence of overall change in each group. This study proposes the necessity and practicality of multivariate statistical techniques for evaluating and interpreting large and complex data sets, with a view to obtaining better information about water quality and the design of monitoring networks to effectively manage water resources.
Citation: Liu J, Zhang D, Tang Q, Xu H, Huang S, Shang D, et al. (2021) Water quality assessment and source identification of the Shuangji River (China) using multivariate statistical methods. PLoS ONE 16(1): e0245525. https://doi.org/10.1371/journal.pone.0245525
Editor: Bing Xue, Institute for Advanced Sustainability Studies, GERMANY
Received: July 4, 2020; Accepted: January 3, 2021; Published: January 22, 2021
Copyright: © 2021 Liu et al. This is an open access article distributed under the terms of the Creative Commons Attribution License , which permits unrestricted use, distribution, and reproduction in any medium, provided the original author and source are credited.
Data Availability: All relevant data are within the manuscript and its Supporting Information files.
Funding: This study was supported by Major Science and Technology Program for Water Pollution Control and Treatment of China (No. 2017ZX07602-001-002).
Competing interests: We declare that we have no financial and personal relationships with other people or organizations that can inappropriately influence our work, there is no professional or other personal interest of any nature or kind in any product, service and/or company that could be construed as influencing the position presented in, or the review of, the manuscript entitled.
Introduction
Water is the material basis for the existence of earth creatures, and water resources are the primary condition for maintaining the sustainable development of the earth’s ecological environment [ 1 ]. With the increasing consumption of water resources, the contradiction between the supply and demand of water resources has intensified, which puts forward greater requirements for the utilization and protection of surface water resources [ 2 ].
The surface water quality of a region depends to a large extent on environmental factors (temperature changes, precipitation and soil erosion) and human input (discharge of municipal and industrial wastewater and over-exploitation of water resources) [ 3 ]. Among them, the discharge of urban sewage and industrial wastewater is a continuous source of pollution, so effective control of sewage discharge is of great significance to the improvement of water quality [ 4 , 5 ].
Surface water runoff is a seasonal phenomenon that is mainly affected by the climate of the basin [ 6 ]. In addition, seasonal changes in precipitation, surface runoff, interflow, groundwater flow, and pumping in and pumping out have a strong influence on the river flow and the subsequent pollutant concentration in the river [ 7 ]. Therefore, correct identification of potential sources of surface water quality pollution is the basis and prerequisite for water quality management.
Shuangji River is a polluted river. Its main source of water comes from urban sewage treatment plants and paper-making sewage treatment plants. It not only plays an important role in assimilating or removing urban and industrial wastewater and farmland runoff, but is also the main inland water resources used for household, industrial, and irrigation purposes [ 8 ], Therefore, it is necessary to prevent and control river pollution and have reliable water quality information for effective management. Given the spatial and temporal changes in river water chemistry, regular monitoring programmes are needed to reliably estimate water quality [ 9 ]. This leads large and complex data matrices composed of a large number of physical and chemical parameters, which are often difficult to interpret, making it challenging to draw meaningful conclusions [ 10 ].
Multivariate statistical analysis is a branch developed from classical statistics and is a comprehensive analysis method [ 11 , 12 ]. It can analyze the statistical laws of multiple objects and multiple indicators when they are related to each other, including cluster analysis (CA) [ 13 ], discriminant analysis (DA) [ 14 ], principal component analysis (PCA) [ 15 ] and factor analysis (FA) [ 16 ]. Multivariate statistical analysis is a suitable tool for multi-component chemical and physical measurements for meaningful data reduction and interpretation [ 17 ]. It is a valuable tool for identifying factors and sources that may affect water systems and cause changes in water quality [ 18 ].
In this article, we took the Shuangji River as the research object for the first time, set up 14 main detection points along the river and detected and analyzed 19 physical and chemical parameters in water samples. The detection time lasted for 2 years. Different multivariate statistical techniques were used to analyse the obtained datasets, to analyse the similarity or dissimilarity between monitoring periods or monitoring points, to identify the water quality variables that cause the spatial and temporal changes of river water quality, and to determine the impact of water sources (natural and anthropogenic factors).
Materials and methods
The Shuangji River (N-34°22′-34°30′, E-113°13′-113°37′), a tributary of the Huai River, originates from the eastern side of Wuzhiling in northwestern Xinmi County and flows through 57 administrative villages in 8 towns in Xinmi County, covering 57 kilometres and controlling the Xinmi River Basin, which has an area of 868 km 2 ( Fig 1 ). The Weishui River (T1), Zhaoyangshui River (T2), Liquan River (T3), Yang River (T4), Ze River (T5), and Wu River (T6) are the main branches of the Shuangji River ( Fig 1 ). The three sides of Xinmi County are located in the eastern part of Henan Province, which is surrounded by mountains on three sides. The terrain is high in the west and low in the east. It is a closed watershed with no external water supply. The average annual rainfall is 660 mm. The Shuangji River is basically free of external runoff recharge, and the main body of the river is affected by domestic sewage and industrial wastewater (Shuangji River is an open river and can be used without any permit. Anyone can study and use the Shuangji River. Therefore, the study of the Shuangji River in this article does not require a permit).
- PPT PowerPoint slide
- PNG larger image
- TIFF original image
https://doi.org/10.1371/journal.pone.0245525.g001
Sampling collection and pretreatment
The design of the sampling network covers the identification of a wide range of key locations, including tributaries and water inputs that have a greater impact on the river [ 19 ], and reasonably represent the water quality of the river system ( Fig 1 ). Sites T1, T2, T3, T4, T5 and T6 are the main tributaries entering the Shuangji River. Sites M1, M2, M3, M4, M5, M6, M7 and M8 are the key points on the main bank of the Shuangji River, where site M8 is under municipal control and provides the exit water of Xinmi County. Sites M1-M3 and T1-T3 are closer to the urban area, and the main source of pollution is urban sewage entering the river. Sites M4, M5, T4 and T5 are located in the industrial zone, and the paper industry in their vicinity is relatively developed; as a result, the pollution is mainly due to paper industry wastewater entering the river. Sites M6-M8 are downstream of the river and have no inflow of external water.
The dataset included 19 water quality parameters that were monitored by sampling at 14 monitoring points for 2 years (2018–2020). The factors monitored in this study included pH, dissolved oxygen (DO), chemical oxygen demand (COD), ammonia-nitrogen (NH 3 -N), total phosphorus (TP), chemical oxygen demand (CODMn), fluoride (F), petroleum hydrocarbons (oil), linear alkylbenzene sulfonates (LAS), copper (Cu), zinc (Zn), cadmium (Cd), arsenic (As), mercury (Hg), hexavalent chromium (Cr 6+ ), total cyanides (CN), volatile phenols (VP), sulphide (S) and selenium (Se). When collecting water quality samples, a standard open barrel sampler (1.5 litre capacity) was used to collect water samples. This sampler can collect water samples from different depths of water to ensure the representativeness of the data. Before collecting the water sample, the 2 litre polyethylene plastic bottle was washed with metal-free soap, rinsed several times with distilled water, soaked in 10% nitric acid for 24 hours, and finally rinsed with ultrapure water for sampling. All water samples collected were first stored in an insulated cooler and placed in a refrigerator at 4°C and sent to the laboratory for analysis on the day the water samples were collected.
Analytical procedure
The water quality parameters, analytical units and analytical methods are summarized in Table 1 . The pH value and DO value of each water sample were determined on site using digital pH values (JY-PH6.0) and DO measuring instruments (YT-RJY). Water samples of approximately 1000 mL were taken at each sampling point in the field and filtered through a polycarbonate filter (0.45 μm pore size). The pretreatment of the sample was divided into two parts. One part of the sample was used for physical and chemical parameters and anion analysis and was directly tested, while the other part was first treated with 2 mL of concentrated HNO 3 before being subjected to metal analysis. All samples were analysed within 48 hours. The COD was measured by the dichromate reflux method (DH310C1COD) [ 20 ], and NH 3 -N was measured with Nessler’s reagent (NH 3 N-1040) [ 21 ]. The TP was measured by ammonium molybdate spectrophotometry (HM-812) [ 22 ], and the CODMn was measured by the permanganate index method (Thermo Scientific 3131) [ 23 ]. Fluoride (F) was measured using an ion-selective electrode ( BHF5300 ) [ 24 ], and the total cyanides were analysed using pyridine barbituric acid spectrophotometry (TCN-508) [ 25 ], while sulphide (S) was determined using methylene blue spectrophotometry (ST201A) [ 26 ]. Petroleum hydrocarbons (Oil) were measured using infrared spectrophotometry (GC1290) [ 27 ]. The linear alkylbenzene sulfonates (LAS) were measured using methylene blue spectrophotometry (UltiMate3000) [ 28 ], and volatile phenols (VP) were measured using spectrophotometric determination with 4-amino-antipyrin (BELL) [ 29 ].
https://doi.org/10.1371/journal.pone.0245525.t001
The main cation was determined by subjecting the acid-treated water samples to a 20-fold dilution with ultrapure water. For the trace elements and toxic elements, the volume of the water samples was reduced by a factor of four at 60°C on an electric hot plate. Cu and Zn were determined by a flame atomic absorption spectrometer (FAAS) using an ethane-air flame (CAAM-2001N) [ 30 ], while Hg was determined by cold-vapor atomic absorption spectrometry (CVAAS) (Ultima Expert) [ 31 ]. Cd and Cr were measured using an electrothermal atomic absorption spectrometer (ETAAS) (Avio 200) [ 32 ], while As and Se were analysed using the hydride generation method (HGAAS) (AA-6033C) [ 33 ]. The accuracy of the analytical data were ensured by triplicate samples, blank test controls and careful standardization. The ion balance of each sample was within ±5%.
Data treatment and multivariate statistical methods
Although water sampling was conducted every month at all sites, due to the impact of the COVID-19 pandemic and bad weather, some points could not be sampled, and the missing data were replaced by the average value. The basic statistics of the two-year water quality dataset (3192 observations) are shown in Table 2 . The data for multivariate statistical analysis usually conform to a normal distribution; therefore, before conducting the multivariate statistical analysis, each variable was tested for conformity to the normal distribution by analysing the skewness and kurtosis statistics. The test results showed that all factors were in line with or close to the normal distribution. The ranges of skewness and kurtosis were—0.45 to 0.91 and—0.97 to 0.53, respectively. For CA and PCA, taking into account the differences in the magnitude and measurement units of different water quality indicators, all selected parameters were also z-scale normalized with mean = 1 and variance = 0.
https://doi.org/10.1371/journal.pone.0245525.t002
In this study, all data were analysed through a variety of multivariate statistical analysis techniques to explore the parameters that caused changes in water quality at different temporal and spatial scales [ 34 ]. For effective pollution control and water management, a large amount of water quality data needs to be explained. Controlling river pollution and mastering reliable water quality information are necessary for effective management. Multivariate analysis of river water quality datasets by CA, DA, PCA and FA, CA, PCA, and FA were applied to experimental data and normalized by z-scale conversion to avoid misclassification due to large differences in data dimensions, and DA was applied to the original data. All mathematical and statistical calculations were performed using Excel 2010, IBM SPSS Statistics 26.0 and Statistica 12 [ 35 – 37 ].
Cluster analysis
Cluster analysis (CA) is a multivariate statistical method for classifying objects according to their distance or proximity [ 38 ]. The system objects can be classified into categories or clusters based on the similarity or difference of their objects [ 39 ]. The hierarchical CA method adopted in this paper is the most widely used clustering method. This method clusters the closest or most similar objects into clusters through successive aggregation and finally groups these clusters into larger clusters. The Euclidean distance usually indicates whether two samples are similar, and the "distance" can be expressed by the "difference" between the analysis values of the two samples [ 40 ]. In this study, the Ward method was used with the squared Euclidean distance as a measure of similarity, and a hierarchical aggregate CA was performed on a normalized dataset. The distance between clusters was determined using analysis of variance, and the sum of squares of the two clusters generated in each step was minimized. CA analyses river water quality datasets to group spatial and temporal variability by similarities, thereby creating a spatiotemporal tree among samples. The dendrogram provides a visual summary of the clustering process, showing an image of each group and those in its vicinity, while the dimensions of the original data are greatly reduced. The link distance is reported as Dlink/Dmax, which represents the quotient of the link distance divided by the maximum distance and multiplied by 100 in a specific case to standardize the link distance on the y-axis. The standardized data were clustered by the Ward method and square Euclidean distance [ 41 ].
Discriminant analysis
In this study, three groups of temporal (three seasons) and spatial (three sampling areas) evaluations were selected, and the analysis parameters used to assign the measurement of one monitoring point to one group (season or monitoring area) were taken as n. The discriminant analysis of the original data was run in standard mode, forward stepwise mode and backward stepwise mode to construct discriminant functions to evaluate the temporal and spatial changes in river water quality. The site (spatial) and season (temporal) are group-dependent variables, and all measurement parameters are independent variables.
Principal component analysis (PCA)/factor analysis (FA)
Principal component analysis (PCA) is actually a dimensionality reduction method. Its main purpose is to use fewer variables to explain most of the variation in the original data and to convert many highly correlated variables into independent or unrelated variables [ 44 ]. Usually, new variables that are fewer in number than the original variables and that can explain the variation in most of the data, the so-called principal components, are used to explain the comprehensive index of the data. The basic idea of principal component analysis is to first draw a "best" fitting line for n points so that the sum of squares of the vertical distance of these n points to the line is the smallest and is called the first principal component of this line [ 45 ]. Then, the second principal component that is independent of the first principal component and has the smallest square sum of vertical distances from n points is found. Analogously, until m principal components are obtained, the value of m is usually such that the variance of the first few principal components accounts for more than 85% of the total variance [ 46 ].
Factor analysis (factor analysis) is a multivariate statistical method that uses a few potential random variables—factors—to describe the covariance relationship among many variables [ 47 ]. In this paper, the factor obtained by the rotation of the maximum variance criterion is a linear combination of the original variables [ 48 ]. Under the premise of ensuring the least information loss, the original data are described as accurately as possible to achieve the dimensionality reduction of multivariate data. In general, the analysis results only select factors with eigenvalues greater than 1.
Results and discussion
Temporal/spatial similarities and grouping.
The dendrogram generated by the time cluster analysis divided 12 months into three clusters at (Dlink/Dmax) *100 <70, and there were significant differences between the clusters ( Fig 2 ). The first cluster (first period) included June and July, corresponding to the high water flow period; the second cluster (2nd period) included August, September, October and November, corresponding to the flat water flow period; the third cluster (3rd period) contained all the remaining months (December, January to May), corresponding to the low water flow period. Therefore, the temporal change in river water quality depends largely on local climatic conditions (spring, summer, autumn, winter) and hydrological conditions (low flow, average flow, and high flow periods). Obviously, the Shuangji River Basin is a typical seasonal river in North China. Since the Shuangji River is mainly a polluted river, the main body of the river comes from the sewage treatment plant along the bank, and the change in water quality reflects the change in the treatment effect of the sewage treatment plant. In summer, the sewage treatment plant has a better treatment effect, and the summer rainfall is large, and the river flow is large, so the river water quality in summer is better and divided into one category. In winter, the sewage treatment plant has poor water quality due to temperature and operation, and the rainfall is small, and the river flow is small. Therefore, the river water quality in winter is poor and divided into one category.
https://doi.org/10.1371/journal.pone.0245525.g002
The spatial CA also generated a dendrogram with three clusters at (Dlink/Dmax)*100<50 ( Fig 3 ). Group A comprised M1 and M2; group B comprised T6 and M3 to M8; group C comprised T1 to T5. It can be clearly seen from the Fig 3 that one group was the main branch of river (M1 to M8), while the other type was the tributaries of the river (T1 to T6). The tributary water sources of the Shuangji River mainly come from the drainage of upstream coal mines and reservoirs. Compared with the main river, the tributary water sources are very clean and were therefore classified as a cluster. The main river category was divided into three categories at (Dlink/Dmax)*100<30. The first category included M1 and M2, which were highly polluted areas. The second category included M3, M4 and M5, which were in moderately polluted areas. Among the pollution sources, the main source of pollution in the high-pollution areas was that the surrounding rural domestic sewage was directly discharged into rivers and urban sewage after treatment by sewage treatment plants. Due to the improvement in urban living standards, urban domestic water consumption has exceeded the carrying capacity of sewage treatment plants, and a new sewage treatment plant is currently under construction, resulting in poor water quality in the upper Shuangji River. The medium-pollution areas were mainly polluted by the industrial wastewater discharged into the river (It can also be known from the data in Table 2 ). The main discharge enterprise was the paper factory, and the main pollution factor was COD. However, due to the recent strict national requirements for wastewater discharge, the wastewater of the paper mill has been discharged through the factory to meet the standard discharge, which has not caused much river pollution, resulting in the areas being only moderately polluted. The low-pollution area was located in the lower reaches of the Shuangji River in Xinmi County. There was no external water pollution. The river has passed the purification of constructed wetlands and its own self-purification ability to achieve better water quality, so it belongs to the low-pollution area.
https://doi.org/10.1371/journal.pone.0245525.g003
Temporal/spatial variations in river water quality
The temporal variation was evaluated using DA, with the clusters based on CA. DA aims to test the importance of discriminant functions and to determine the most important variables related to the differences between clusters. As shown in Table 3 , the Wilks’ lambda and chi-square values of each discriminant function ranged from 0.273 to 0.808 and from 34.834 to 202.505. The p-level value was lower than 0.01, indicating that the time DA was reliable and effective.
https://doi.org/10.1371/journal.pone.0245525.t003
The discriminant functions (DFs) and classification matrices (CMs) obtained by the standard, forward stepwise and backward stepwise modes of DA are shown in Tables 4 and 5 . Both the standard mode and the forward stepwise mode were able to achieve discriminant accuracy rates of 80%, using 19 and 15 factors, respectively. However, the backward stepwise mode used only four factors (CODMn, Cu, As and Se) to achieve a discriminant accuracy rate close to 70%. The temporal DA showed that the four factors CODMn, Cu, As and Se were the most important parameters to distinguish the three periods obtained by clustering and accounted for most of the expected temporal changes in water quality.
https://doi.org/10.1371/journal.pone.0245525.t004
https://doi.org/10.1371/journal.pone.0245525.t005
The box plot of the four important parameters obtained by the backward discriminant analysis are shown in Fig 4 . The average values of CODMn, Cu, As and Se showed the highest values in the first time period and showed a downward trend in the second and third time periods due to hydrological conditions (high flow period, flat flow period and low flow period), showing the characteristics of point pollution sources.
The (a)- (d) temporal variations: CODMn, Cu, As and Se.
https://doi.org/10.1371/journal.pone.0245525.g004
The results of the spatial analysis of DA were similar those of CA. The Wilks’ lambda and chi-square values of each discriminant function were between 0.063 to 0.448 and 129.962 to 432.084 (p<0.01), respectively, indicating that the spatial discriminant analysis was credible and valid ( Table 6 ).
https://doi.org/10.1371/journal.pone.0245525.t006
The methods for obtaining the discriminant functions and classification matrices of the spatial DA were the same as those for the temporal DA and used the standard, forward stepwise, backward stepwise modes. The results are shown in Tables 7 and 8 . The standard stepwise mode and the forward stepwise mode used 19 and 17 discriminant variables, respectively, and discriminant accuracy rates of 97.62% and 97.62% were obtained. However, in the backward step-by-step mode, the DA used only 7 discriminant parameters to produce a discriminant accuracy rate of 92.86%, which indicated that COD, TP, CODMn, F, LAS, Cu, and Cd were important parameters of the spatial variables.
https://doi.org/10.1371/journal.pone.0245525.t007
https://doi.org/10.1371/journal.pone.0245525.t008
Box and whisker plots of the discriminant parameters recognized by DA are given in Fig 5 . In these seven groups of graphs, the minimum value of all factor averages is group C because group C was a tributary of the Shuangji River, and the main water sources were from coal mines and reservoirs, which belonged to the clean water quality group. Among them, the maximum values of the average values of COD, TP, CODMn and LAS were all in group A because group A is the water quality of the upper Shuangji River, and the main sources of pollution in this area were the direct discharge of rural domestic sewage into the river and urban sewage plant drainage, which belonged to the group with poor water quality. The maximum value of the average value of F and COD was group B, and the main source of pollution was industrial wastewater.
The (a)-(g) spatial variations: COD, TP, CODMn, F, LAS, Cu and Cd.
https://doi.org/10.1371/journal.pone.0245525.g005
Principal component analysis/factor analysis
Before factor analysis, the Kaiser-Meyer-Olkin (KMO) and Bartlett’s sphericity tests were performed to check the correlation and partial correlation between variables to judge whether the data were suitable for factor analysis [ 49 ]. The value of the KMO statistic ranges between 0 and 1 [ 50 ]. In the actual analysis, when the KMO statistic is above 0.7, the effect of the factor analysis of the data is considered to be better. The KMO result was 0.755, and Bartlett’s sphericity result was 1342.53 (p<0.05), showing that PCA can play an effective role in reducing dimensionality.
FA/PCA analysis is aimed at the standardized data and compares and analyses the composition patterns between water samples to determine the important factors that affect each water sample [ 51 ]. The PCA of all datasets yielded six (principal component)PCs, which explained 68% of the total variance with eigenvalues > 1 ( Table 1 ). The first PC (29.7% of the total variance) was correlated (loading >0.7) with COD, TP, Cu and VP. The third PC (9.2% of total variance) was correlated (loading>0.7) with LAS. However, the second, fourth, fifth and sixth PCs, although they accounted for the total variance of 10.4%, 7.2%, 5.9% and 5.5%, respectively, were not correlated (loading>0.7) with any of the parameters. Combining the local industrial structure and distribution, it characterizes emissions related to industrial industries such as handmade paper manufacturing, coking, chemical raw materials and chemical products manufacturing, and metal products, which are consistent with the current main industrial industries in Xinmi (Henan Province).
The Scree plot determines the number of PCs to keep by understanding the underlying data structure [ 52 ]. In this study, the Scree plot ( Fig 6 ) showed a significant change in slope after the sixth eigenvalue. The original variable on the PC subspace is called the load, which was consistent with the correlation coefficient between the PC and the variable.
https://doi.org/10.1371/journal.pone.0245525.g006
The axis of rotation defined by PCA will produce a new set of factors, each of which mainly involves a subset of the original variables, and the degree of overlap is as small as possible, so the original variables were divided into several independent groups [ 53 ]. Therefore, factor analysis (FA) of the current Shuangji River dataset further reduces the contribution of the nonsignificant variables obtained from the PCA. The maximum variance rotation of the PC (original) explained the six different VFs with eigenvalues> 1, explaining approximately about 68% of the total variance. After the rotation by the maximum variance method, the value of PC was further revealed, and in VF, the participation of the original variable was clearer ( Table 9 ). Liu et al. (2003) [ 54 ] classified the factor loadings as ‘strong’, ‘moderate’, and ‘weak’, which corresponded to absolute loading values of > 0.75, 0.75–0.50 and 0.50–0.30, respectively.
https://doi.org/10.1371/journal.pone.0245525.t009
VF1 (17.7% of the total variance) had strong positive loadings on Cu and S and moderate positive loadings on NH 3 -N and TP, indicating pollution from mineral composition and domestic sewage. This is because the main source of rivers in Xinmi City is drainage from domestic sewage plants, and the main source of pollution is domestic pollution sources, and the upstream of the tributaries are mainly coal and metal industries, causing some heavy metal pollution. VF2 (12.6% of total variance) had strong positive loadings on Cd and moderate positive loadings on Se and COD, indicating that the source was industrial wastewater pollution. This is related to the main paper industry, metal products, and steel casting manufacturing industries along the Shuangji River. VF3 (10.7% of total variance) had strong positive loadings on F and Oil and moderate positive loadings on Cr 6+ , mainly manifested as fluoride pollution and heavy metal pollution. This clustering indicates that the source of pollution was the discharge of wastewater from the chemical industry, which is related to some chemical industries and metal manufacturing industries along the river. VF4, which explained 9.9% of the total variance, had moderate positive loadings on CODMn, NH 3 -N and Zn, indicating that the pollution was from mineral-related hydrochemistry and domestic sewage, mainly from the discharge of wastewater from paper-making enterprises, domestic sewage, and metal manufacturing wastewater into the river along the coast. VF5 (8.9% of total variance) had moderate positive loadings on pH and LAS, which can be interpreted as coming from detergents and personal necessities in domestic sewage. VF6, which explained 7.9% of the total variance, had moderate negative loadings on DO. This finding suggests that the pollutants in the water consumed a large amount of oxygen.
The FA/PCA results indicated that most changes were composed of soluble salts (natural) and organic pollutants (artificial). FA/PCA indicated that the main pollutants are COD, CODMn, NH 3 -N, TP, Cu,Cr 6+ , Zn, S, Se, Cd, F, Oil and LAS. These pollutants mainly come from domestic sewage discharge COD, CODMn, NH 3 -N, TP; papermaking wastewater discharge COD, CODMn; textile industry, chemical product manufacturing wastewater discharge F, Oil and LAS; metal product manufacturing, optoelectronic device manufacturing and other industrial wastewater discharge Cu, Cr 6+ , Zn, S, Se and Cd. The FA can identify the parameters that have the greatest contributions to changes in river water quality. The method of assessing the spatiotemporal changes in water quality based on FA/PCA have been applied to water quality evaluation at an early stage.
Conclusions
Water quality monitoring programmes generate complex multi-dimensional data, which requires multivariate statistical processing to analyse and interpret its basic information. In this study, different multivariate statistical techniques were used to evaluate the spatial and temporal variations in the surface water quality of the Shuangji River. Cluster analysis (CA) divided the 12 months and 14 sampling points into three categories according to the similarity of river water quality characteristics and pollution. It provided an effective basis for the classification of surface water in the studied area and can effectively reduce the number of sampling points to analyse the river under the premise of lower loss of information. Discriminant analysis (DA) provides the best results for spatial and temporal analysis. It used only four factors (CODMn, Cu, As, Se) to distinguish the seasons temporally and achieved a 68% (79% reduction) accuracy rate and used only seven parameters (COD, TP, CODMn, F, LAS, Cu, and Cd) to allocate the three areas and achieve a 93% (63% reduction) accuracy rate. Although the FA/PCA pointed out the 7 parameters required to explain 68% of the data variability (37% of the original 19 parameters), only a small amount of data was reduced. However, the six VFs obtained from the PC indicated that the quality parameters of the river water were mainly divided into natural (soluble salts) and anthropogenic (organic pollution) components. Therefore, multivariate statistical techniques are an excellent exploration tool for analysing and interpreting complex datasets related to water quality and understanding their temporal and spatial changes.
Supporting information
S1 raw data..
https://doi.org/10.1371/journal.pone.0245525.s001
Acknowledgments
In this study, the authors are grateful for the data support provided by the Xinmi Branch of Zhengzhou Bureau of Ecology and Environment.
- View Article
- Google Scholar
- PubMed/NCBI
- 22. LANYongchao DKMZ. The relationship betwwen ENSO cycle and high and low—flow in the upper Yellow River. 地理学报: 英文版. 2003 2003-01-01;13(1):105–11.
- 26. Tri Wahyuni E. Photodegradation of Detergent Anionic Surfactant in Wastewater Using UV/TiO<sub>2</sub>/H<sub>2</sub>O<sub>2</sub> and UV/Fe<sup>2+</sup>/H<sub>2</sub>O<sub>2</sub> Processes. American Journal of Applied Chemistry. 2016;4(5):174.
- 36. Water quality assessment and source identification of Daliao river basin using multivariate statistical methods.
- 38. Cruz RCD, Eler MM. Using a cluster analysis method for grouping classes according to their inferred testability: An investigation of CK metrics, code coverage and mutation score.; 2017 2017-01-01: IEEE; 2017. p. 1–11.
- 39. Assessment of heavy metals pollution using multivariate statistical analysis methods in Wadi El Bey (Tunisia.
- 43. Potentially toxic metals in lotic systems with aptitude for aquaculture at the watershed Mantaro River, Peru.
Thank you for visiting nature.com. You are using a browser version with limited support for CSS. To obtain the best experience, we recommend you use a more up to date browser (or turn off compatibility mode in Internet Explorer). In the meantime, to ensure continued support, we are displaying the site without styles and JavaScript.
- View all journals
- My Account Login
- Explore content
- About the journal
- Publish with us
- Sign up for alerts
- Open access
- Published: 29 April 2024
Sensitivity analysis of natural convection in a porous cavity filled with nanofluid and equipped with horizontal fins using various optimization methods and MRT-LB
- H. Sajjadi 1 ,
- N. Mansouri 2 ,
- S. N. Nabavi 1 ,
- A. Amiri Delouei 1 &
- M. Atashafrooz 3
Scientific Reports volume 14 , Article number: 9847 ( 2024 ) Cite this article
175 Accesses
Metrics details
- Energy science and technology
- Engineering
- Mathematics and computing
- Nanoscience and technology
In the present study, natural convection heat transfer is investigated in a porous cavity filled with Cu/water nanofluid and equipped with horizontal fins. Optimization and sensitivity analysis of the fin’s geometry, porous medium and nanofluid properties to maximize heat transfer rate is the aim of this work. To achieve this purpose, a design space is created by input parameters which include length, number of fins, distance between fins, porosity, Darcy number and volumetric fraction of the nanoparticles. Several tools have been used to implement optimization methods including the Taguchi method (TM) for design points generation, sensitivity analysis of design variables by using signal-to-noise ratio (SNR) and analysis of variance (ANOVA), response surface method (RSM) for interpolation and regression by using nonparametric regression, and genetic algorithm (GA) for finding optimum design point. The double multi-relaxation time lattice Boltzmann method (MRT-LBM) is used to analyze and simulate the flow field and heat transfer in each design point. The results show that the optimal configuration leads to an average Nusselt number of 5.56. This optimal configuration is at the length of fins L/2, the number of fins 2, the distance between fins L/12, porosity 0.8, Darcy number 0.1, and the volumetric fraction of the nanoparticles 0.02. By using the SNR results, the Darcy number and the number of fins have the most and the least effect in maximizing the average Nusselt number, respectively. The ANOVA results and global sensitivity analysis (GSA) findings further validated this conclusion.
Optimization of wavy trapezoidal porous cavity containing mixture hybrid nanofluid (water/ethylene glycol Go–Al2O3) by response surface method

MHD mixed convection and heatlines approach of nanofluids in rectangular wavy enclosures with multiple solid fins

The baffle shape effects on natural convection flow and entropy generation in a nanofluid-filled permeable container with a magnetic field
Introduction.
Natural convection heat transfer has many applications in different areas like electronic cooling, solar systems, heating, ventilation and air conditioning, etc. Since the natural convection heat transfer coefficient is very low, various techniques are offered to increase this defect. One appropriate way to increase the heat transfer coefficient is to use porous material. These structures by having large heat transfer areas improve the heat transfer rate between fluid and solid. Although porous media has superb thermal efficiency, they have low thermal conductivity. To compensate for this deficiency, two solutions can be applied, using extended surfaces like fins and baffles or adding nanoparticles with a higher thermal conductivity.
There have been done various numerical simulation to investigate the effect of porous media, nanofluids and fins on natural convection heat transfer 1 , 2 , 3 , 4 , 5 , 6 , 7 , 8 , 9 , 10 , 11 . In many of these studies square cavity was utilized to peruse fluid flow, heat transfer, mass transfer and interaction between them. Hossein et al. 12 investigated the effect of the length and distance between fins on heat transfer and fluid flow in a cavity with CU/water nanofluids and showed that the existence of fins has a great effect on heat transfer and fluid flow in the cavity. The effect of the Hartmann number on fluid flow and heat transfer in the cavity without and with fins has also been studied. Al-Farhany et al. 13 investigated the impact of length and distance between fins on conjugate natural convection in a porous cavity. Their results showed that the Nusselt number increases with the increase of Rayleigh number, Darcy number and fin length. The results also indicated that the greater distance between the fins when the fins are at their maximum length is the best structure for heat transfer. Arani and Roohi 14 investigated natural convection heat transfer in a square cavity with a baffle filled with two types of copper and aluminum nanofluids. Their results showed that due to the higher heat transfer coefficient of copper conductivity, the effect of adding these particles on the heat transfer rate in this case is much higher than the presence of aluminum oxide particles. Mahmoodi and Asef 15 also studied natural convection heat transfer in a square cavity with a baffle filled with Cu/water nanofluid. They investigated the effect of baffle position, Rayleigh number and volume fraction of nanoparticles. Their results showed that the appropriate position of the baffle is different in various Rayleigh numbers, and where Ra = 1000, the heat transfer rate is maximized when the baffle is in the center of the hot wall. Hamida and Hatami 16 compared the position of fins in a channel filled with mixed nanofluid and under the effect of an electric field. The number of fins was 4–8, and the distance between them was 2–4 cm and they used Galkin finite element method to investigate the problem. The results showed that the maximum Nusselt number happened when hybrid titanium oxide-aluminum oxide with 0.05 volume fraction was used.
Ahmed et al. 17 investigated the effect of some parameters including nanoparticle volume fraction, Darcy number, number of undulation and amplitude of waviness for a wavy walled porous cavity filled with Cu-Al 2 O 3 /water hybrid nanofluid. The results showed that the Darcy number is an important parameter on fluid flow and temperature. They also showed that the heat transfer rate increased by increasing nanoparticle volume fraction. Their result illustrated that the growth in the undulation and wavy contraction ratio causes a decrease in the fluid flow while it increases the local Nusselt number on the wavy wall. Izadi et al. 18 used a periodic magnetic field on a hybrid nanofluid in the porous cavity. They concluded that magnetic field inclination angle and periodical magnetic field wave length can control heat transfer performance within the liquid and solid phases. The effect of magnetohydrodynamics forced convection of nanofluid on heat transfer in a U-shaped cavity with a porous region and wavy wall was studied by Selimefendigil and Öztop 19 . The rise of magnetic field strength increased the average Nusselt number significantly. However, the impact is reduced by a higher Darcy number of the porous domain. Baghsaz et al. 20 studied the effect of nanoparticle sedimentation on characteristics of natural convection over time. They reported that the Nusselt number decreased during the nanoparticle sedimentation process.
Also, due to the widespread capability of the Lattice Boltzmann method (LBM) in the analysis of fluid flow and heat transfer, this methodology has garnered significant attention from numerous scholars to investigate the nanofluids flow and flow in porous mediums 21 , 22 , 23 , 24 . Sajjadi et al. 25 studied natural convection heat transfer in the porous cavity by using the double multi relaxation time Lattice Boltzmann method (MRT-LBM). They showed that the heat transfer rate increases with the rise of Darcy number, porosity, Rayleigh number and volume fraction of nanoparticles. It was also observed that the effect of Darcy number on the heat transfer rate increases with the increase of Rayleigh number. Sheikholeslami and Vajaraulu 26 used the LBM to investigate the effect of a magnetic field on free convection heat transfer in a porous cavity filled with nanofluids. The results showed that the temperature gradient decreases with the increase of the Hartmann number. MRT-LBM was utilized by Rahimi et al. 27 to investigate the effects of Rayleigh number, solid volume fraction, and four different arrangements of discrete active walls on the natural convection and entropy generation in the three-dimensional domain. They reported that the location of active walls has considerable effects on heat transfer performance, also Rayleigh number and solid volume fraction enhanced the average Nusselt number. Their results illustrate that increasing the Rayleigh number leads to higher entropy generation, while the increasing the solid volume fraction decreases entropy generation.
It can be beneficial to use the design of experiments (DOE) to reduce the costs of studying parameters and statistical and metamodeling methods to check the effect of different parameters and optimization. Taguchi method (TM) and response surface method (RSM) are two useful models in this regard. The TM, which was introduced by Taguchi 28 , combines statistical and mathematical techniques to design experiments, investigate the influence of variables on response and find optimum points. Sobhani et al. 22 investigated the radiation/natural convection in a cavity with a horizontal fin. Their results showed that the length and location of the fin have fewer effect compared to some operational variables like Rayleigh number. Hydrodynamics and heat transfer in a microchannel heat sink are studied by Bazkhane and Zahmatkesh 29 . Javadpour 30 optimized microchannel performance filled by nanofluid using TM and genetic algorithm (GA). RSM, which was introduced by Box and Wilson 31 is a metamodeling technique that is developed as a surrogate of the expensive simulation process to improve the overall computation efficiency. To minimize substantial computational cost, RSM enables the manipulation of a continuous response space based on the given design parameters and provides an opportunity to evaluate numerous design cases and assess the impact of the designated factors. This method widely applied for optimization in different types of issues as a useful outcome. For example, RSM was used for the optimization of natural ventilation in a building 32 , the configuration of a spacer in a spiral-wound membrane 33 , the membrane-based separation process of isopropanol/water solution 34 , etc.
To the best of the authors’ knowledge, no previous work has used combined LBM and RSM methods to assess and optimize the heat transfer of nanofluid in porous cavities with fins. The primary objective of this study is to conduct a sensitivity analysis and optimize the process of natural convection heat transfer. Therefore, the design points were selected using the TM, and MRT-LBM was applied to simulate the physics of fluid. Six variables including length, number and distance between fins, porosity, Darcy number and volumetric fraction of nanoparticles are considered as input factors and accordingly, the output parameter of the Nusselt number has been evaluated. Signal to noise ratio (SNR), analysis of variance (ANOVA), and the global sensitivity analysis (GSA) have been employed to assess the sensitivity of the system. In the concluding phase of this study, the optimal design point will be identified through the utilization of the TM and GA. Subsequently, a comparative analysis of the results will be conducted.
Methodology
Present geometry and governing equations.
In this research, a two-dimensional porous enclosure was utilized to investigate the behavior of fluid flow and heat transfer (Fig. 1 ). As shown in Fig. 1 , the left side of the cavity and fins have a constant temperature of \({T}_{h}\) , the right side has a constant temperature of \({T}_{c}\) and the top and bottom walls are adiabatic. All walls and fins are fixed and non-slip boundary condition is used for them. The physical and thermal boundary conditions can be summarized as follows:
At the hot wall of the cavity and the fins surface: \(U=V=0, {T}^{\prime}= {T}_{h}^{\prime}\)
At the cold wall of the cavity: \(U=V=0, {T}^{\prime}= {T}_{c}^{\prime}\)
At the insulation walls: \(U=V=0, \partial T/\partial y=0\)

Geometry of the problem.
Also, L is equal to unity. \({Y}_{f}\) is the distance between the first fin and south wall which is fixed and equal to L/4. \(H\) is the length of fins and \(D\) is the distance between fins.The enclosure contains Cu/water, which is treated as a Newtonian fluid. The flow is characterized as laminar, and the effects of viscous heat dissipation are not taken into account. So, the fundamental equations for continuity, momentum, and energy are provided in the following dimensionless equations, respectively 19 :
In Eq. 2 – 4 \((\varepsilon )\) is porosity which will be calculated in below equation:
Which \({V}_{void}\) is volume of voids and \({V}_{total}\) is total volume.
To obtain above dimensionless equations, the following variables were used:
MRT-LBM for flow field
For solving the collision step in LBM two main model have been presented; 1. Bhatnagar-Gross-Krook (BGK) model, which is the simplest collision model, where the distribution functions are relaxed towards a local equilibrium distribution at each lattice point. The relaxation time parameter controls the rate at which the distribution functions approach equilibrium. 2. Multiple Relaxation Time (MRT) model: in this model, the collision step is decomposed into multiple relaxation processes, allowing for more flexibility and control over the relaxation rates of different moments of the distribution functions which is more stable. So, in this study the MRT model with D2Q9 lattice (Fig. 2 a) is used to solve the velocity field. For incompressible fluid in this method, we have 19 :

The discrete velocity vectors for ( a ) D2Q9 ( b ) D2Q5.
In Eq. ( 7 ) \({f}_{i}\) is the velocity distribution function, \(\Delta t\) is the time step which is considered equal to the unity, \({c}_{i}\) is the discrete fluid particle velocity vector for D2Q9 model that is defined in Fig. 2 a and reported as:
where c is the lattice speed and equals to ∆x/∆t which also set equal to unity.
\({M}_{ij}\) is the transformation matrix, \({S}_{jk}\) is the diagonal matrix for relaxation rate for momentum distribution which is calculate as follow:
Which \({\tau }_{v}\) in Eqs. ( 11 ) can be obtained as:
MRT Lattice Boltzmann method for temperature field
The MRT Lattice Boltzmann method is employed in this study to solve the distribution function of temperature, similar to the flow field. Additionally, a D2Q5 lattice, as depicted in Fig. 2 b, is utilized 16 .
Here \({h}_{i}\) is the distribution function for the temperature and \({e}_{i}\) is the discrete fluid particle velocity vector for D2Q5 (Fig. 2 b) and is defined as:
And values of \({N}_{ij}\) is the transformation matrix and \({Q}_{jk}\) is the diagonal matrix which are can be obtained by:
Components of the matrix of relaxation time for the present study are defined as:
Lattice Boltzmann method for nanofluid
Due to the presence of nanoparticles in the base fluid, the thermophysical properties of the nanofluid are different from the base fluid (Table 1 ). Thermal expansion coefficient (β) of nanofluid is obtained from the following equation:
The heat capacitance ( \({c}_{p}\) ) and the effective density of the nanofluid are calculate:
Also, the dynamic viscosity of the nanofluid is obtained as
The effective thermal conductivity coefficient is also calculated from Eq. ( 22 ).
where in Eqs. ( 18 )–( 22 ), \(\phi \) is the volume fraction of the solid particles and subscripts \(s\) , \(nf\) and \(f\) are used for solid, nanofluid and base fluid, respectively.
Taguchi method (TM) and response surface method (RSM)
Geometric conditions and physical parameters can affect the output of issues. Studying the design variables separately causes the effect of changing different parameters simultaneously on the outputs of the problem to be ignored. Also, using full factorial analysis in design space is hugely time-consuming, especially for numerical methods which need considerable computational time and cost for each simulation. Owing to this fact, in this study, the TM and GA have been applied to investigate complex interactions between parameters and obtain outputs in the whole design space. This framework is conducted in four main steps:
In the first step, the input and output would be defined and the design of experiments (DOE) scheme will be implemented on input parameters to achieve design points effectively. The cost of parameters study and the chance of having overlapping data points decrease significantly by employing DOE. Here, the TM is utilized to design experiments for six input factors and in three levels. Taguchi suggested the L 27 orthogonal arrays table for this design space which are initial design points.
In step 2, numerical simulations based on MRT-LBM discussed in sections " MRT Lattice Boltzmann method for temperature field "–2.5 will be performed to calculate the response of design points.
In step 3, the obtained results of the previous step will be used to predict a relationship between variables and create a continuous space with a response that will give outputs at each point in the design space. The TM also uses a factor called SNR to express the quality of optimization problem and evaluate the performance of each experiment. The value of SNR expresses the dispersion of the simulated data around the nominal or target value by using the loss function. The SNR is divided into three types: the smaller the better, the larger the better, and the nominal the better, thus the calculation is different. In the present study, because the purpose is to enhance the output parameter (average Nusselt number), the larger the better type will be used which is computed according to as follows,
where \(n\) is the number of iteration experiments and \({y}_{i}\) is the output of the problem. To determine the effective variables and their contribution on the performance of the objectives an ANOVA is used.
Although valuable results can be obtained from the TM, this method is unable to predict the result in all design spaces. According to this fact, RSM will be applied to predict results in all domains. For this reason, some samples add to initial design points to enrich design space and obtain better results. Then by carrying non-parametric regression (NPR) a continuous design space will be created. NPR is a metamodeling technique that provides improved response quality. NPR belongs to a general class of Support Vector Method (SVM) type techniques. This model revolves around the concept of forming a narrow envelope, known as epsilon, around the output response surface and extending it. This envelope should encompass all or most of the design sample points. This method is one of the approaches that is more flexible, data-driven and suitable for noisy results compared to other metamodeling techniques like standard response surface and kriging model.
Finally, in step 4, optimum conditions will be achieved using GA and the optimum point achieved from TM optimization will be comparied by optimum point of GA.
Input and output parameters
The number of fins, the length of them and the distance between them are three main geometrical parameters related to fins, porosity and Darcy number are other geometrical parameters related to structure of the porous medium and volumetric fraction of the nanoparticles is an operational variable related to nanofluids. The number of fins is a discrete parameter which in the present study are 2, 3 and 4, the length of fins is L/6, L/3 and L/2, and distance between them is L/6, L/8 and L/12, porosity is 0.4, 0.6 and 0.8, volumetric fraction of the nanoparticles is 0.005, 0.01 and 0.02. The Darcy number is a dimensionless number which is normally used in heat transfer through porous media and equal to below equation:
where \(k\) is the permeability, which is capability of passing the fluid through the porous media, and \(d\) is the characteristic length. The Dary number is 0.001, 0.01 and 0.1 in the present work.
Average Nusselt number on the cold wall is the only output of this study and calculated as:
Validation and grid independence
A thorough testing process was carried out to ensure that the solution was not dependent on grid size. The average Nusselt number on the cold wall for specific conditions (DP = 1 in Table 5 ) was calculated at various grid resolutions and displayed in Table 2 . As shown in Fig. 3 . Uniform grid has been applied in the present study. The results indicated that there was not a significant change in the average Nusselt number as the grid resolution increased from N3 to N4, leading to the selection of a (120 × 120) grid resolution.

Grid distribution for N3.
To ensure the accuracy of the current work, validation was conducted in two areas by comparing it with previous research. Initially, the nanofluid solution was validated against the findings of Khanafer et al. 35 as depicted in Table 3 . The present approach successfully replicates the results for the nanofluid with a maximum error of under 5%, as shown in Table 3 .
The second validation involved assessing natural convection in a porous medium, and the current findings were compared with those of Nithiarasu et al. 36 and Guo et al. 37 in Table 4 . The results demonstrated a favorable alignment with the prior researches, with a maximum error of approximately 4%. This suggests that the current method is well-suited for flows in porous media.
Also, a qualitative verification of the present work and the previous one 22 is provided in Fig. 4 . As, it is obvious the temperature and velocity field have been captured well.

Temperature contours ( a ) and streamlines ( b ) for Ra = 10 4 in comparison with the previous work 22 .
Results and discussion
The results of the numerical simulation, the Taguchi method, the Response surface method, optimization, and sensitivity analysis are presented in the following sub-sections. Firstly, obtained design points and the Computational Fluid Dynamics (CFD) results corresponding to these points were presented. Then, TM and RSM were employed to achieve output value in a continuous design space. After that, the optimal points obtained with TM and GA are reported. Finally, the Analysis of Variance (ANOVA) and Global Sensitivity Analysis (GSA) were used to statistically analyze the effect of input parameters on output parameters.
Design points generation and CFD results
The TM is considered for generating initial design points in the design space. According to the Taguchi design concept, L 27 standard orthogonal array is used and 27 samples were chosen based on three levels and six factors which are, Length of fins ( \(H\) ), number of fins ( \(N\) ), distance between fins ( \(D\) ), porosity (ε), Darcy number ( \({\text{Da}}\) ) and volumetric fraction of the nanoparticles ( \(\varnothing \) ). The output parameter at each design point are obtained from MRT-LBM simulations. The input parameters in design points and the corresponding obtained output are presented in Table 5 . It will be noted that the final design space includes more than 27 points because 4 new points will be added to improve the final result accuracy.
In Figs. 5 and 6 , all 27 design points are shown. As can be observed, by changing each of the input parameters, the temperature contours and streamlines change, indicating the effect of these parameters on the heat transfer rate. For example, In Fig. 5 it is noticed by increasing the Darcy number and volumetric fraction of the nanoparticles, the isotherms lines become closer to both hot and cold walls and they become more horizontal which enhances convection in all domains in the cavity. As it was mentioned the Darcy number has a direct relationship with the permeability of the porous medium. By increasing permeability, the resistance to fluid flow is decreased, and velocity, flow recirculation, and thermal convection are enhanced. For low Darcy number heat transfer is primarily governed by conduction within the porous medium, with limited convective heat transfer.

Isotherms for ( a ) Case 1–3, ( b ) Case 4–6, ( c ) Case 7–9, ( d ) Case 10–12, ( e ) Case 13–15, ( f ) Case 16–18, ( g ) Case 19–21, ( h ) Case 22–24, ( i ) Case 25–27-VF of nanoparticles \(\varnothing \) = 0.005 solid, \(\varnothing \) = 0.01 dashed and \(\varnothing \) = 0.02 dashed-dot.

Streamlines for ( a ) Case 1–3, ( b ) Case 4–6, ( c ) Case 7–9, ( d ) Case 10–12, ( e ) Case 13–15, ( f ) Case 16–18, ( g ) Case 19–21, ( h ) Case 22–24, ( i ) Case 25–27-VF of nanoparticles \(\varnothing \) = 0.005 solid, \(\varnothing \) = 0.01 dashed and \(\varnothing \) = 0.02 dashed-dot.
Furthermore, the streamlines (Fig. 6 ) confirm the above results with expansion of streamlines and rising maximum stream function. Comparing Fig. 5 a–c shows that increasing the number of fins and porosity and decreasing distance between them in the stable height of fins, Darcy number and volumetric fraction, increase gradient of temperature near fins bottom-left cornel and upper-right cornel and consequently improve heat transfer. Similarly, comparing Fig. 5 a, d and g under equal number of fins, shows when the number of fins is equal to 2, increasing the height of fins helps heat transfer and circulation of flow around the hot wall. However, when the number of fins and the distance between them increases simultaneously, the fluid flow cannot approach the hot wall and as a result heat transfer declines. Moreover, in cases in which the amount of VF of nanoparticles increases, this change improves the conductivity of the working fluid, resulting in higher fluid velocity and more heat transfer from the heated walls to the cooled wall.
In cases with the larger average Nusselt number, the density of streamlines rises. Also in these cases, the streamlines are closer to the hot wall and the circles of flow can be in touch with the hot wall and back to sink.
TM and RSM results
From the numerical simulation results and using the TM at first the discrete design space will be converted to a continuous design line in orthogonal arrays. An advantage of SNR is obtaining the levels of parameters that enhance heat transfer. Figure 7 shows the results of SNR values for each factor at each level. Based on the TM, the level with the highest SNR value corresponds to the optimal value of the control parameter. Results show that the increasing length of fins ( \(H\) ), porosity (ε), Darcy number ( \({\text{Da}}\) ) and volume fraction of nanoparticles ( \(\varnothing \) ) increases the output parameter. However, when the number of fins and distance between ( \(D)\) them rise, the outlet decreases.

SNR for each factor at each level.
By using RSM, the discrete design space will be converted to a continuous design space. RSM creates the approximation functions by some mathematical and statistical tools to describe the design space. Here, design points are those obtained in the previous step (Taguchi method DOE) and the samples which are added to make better predictions (Table 6 ). Also, the GA method has been taken for regression and predicting output parameter in the whole design space.
To obtain a high-quality response surface, another level is created in the design space. With this method, conditions are created so that the response surface equation can have a higher order to create better predictability and curve fitting. In the previous step, there were only three levels that were suitable for fitting the curve with the quadratic polynomial. Table 6 shows the sample design points which added to the initial design points (Table 5 ).
Figure 8 shows the 3D response surface for the average Nusselt number on the cold wall as the function of input parameters. Note that in each plot, the output parameter is shown with two input parameters while the other input parameters have been considered constant at the mean value of its design range.

3D Response surfaces for the average Nusselt number as a function of input parameters.
Figure 8 a and b show that configuration and number of fins have a significant effect on the output parameter. For example, in Fig. 8 a it is noticeable that the average Nusselt number can change from 3.85 when the length of fins is 0.5 and the distance between fins is 0.167 to more than 4.4 when length of fins and distance between them are in the middle of their change interval. Also, when the length of fins increases the behavior of the output parameter is very different in each number of fins. Figure 8 c shows that when the porosity of the porous cavity increases approximately in each length of fins, the average Nusselt number goes up. This trend is for increasing of volume fraction of nanoparticles and Darcy number, too.
When the changeable parameters are the distance between fins and the number of them, as it is obvious in Fig. 8 f, the output parameter is dependent on the input parameters significantly. For instance, when the number of fins is equal to 4, increasing the distance between fins causes a sharp decrease in the Nusselt number. This is probably because by increasing the distance between the fins, the flow cannot approach the hot wall and vortices are not allowed to form. However, when the number of fins is equal to 2 and 3 the average Nusselt number first increases and then decreases with the increase of the distance between the fins. It is clear that by rising porosity, the volume fraction of nanoparticles and Darcy number, generally average Nusselt number increases. Interestingly, the response of output parameter to porosity and Darcy number is approximately similar.
Figure 9 a shows that by increasing porosity, in each number of fins, \({{\text{Nu}}}_{avg}\) will be increased when other input parameters are in the middle of their change interval. The results show that when the porosity and volume fraction of nanoparticles are changeable parameters in the problem, the maximum value of the \({{\text{Nu}}}_{avg}\) is placed somewhere in the middle of the range of changes (tending to the upper limit) (Fig. 9 b). But when the porosity is high and the volume fraction of nanoparticle is low or vice versa, this value decreases slightly. In Fig. 9 c, it can be seen that the increase of Darcy and Prosity number increases the output function. Also, at any fixed number of fins, the output increases with the increase of the Darcy number (Fig. 9 d). It is noticeable in Fig. 9 e. When Darcy number and volume fraction of nanoparticles are variables, the increase of both parameters increases the output, however, the effect of the first parameter is greater. It is obvious in Fig. 9 f that by increasing the volume fraction of nanoparticles to about 0.015, in each number of fins, first \({{\text{Nu}}}_{avg}\) will be increased then for more volume fraction of nanoparticles the heat transfer rate will decrease.

The results show that, generally, increasing porosity enhances heat transfer, except for very high porosity, in which heat transfer slightly decreases. This may occur because the conductivity decreases in high porosity. However, low porosity is associated with a high pressure drop and requires significant pumping power.
Optimization
In this section, the optimal points obtained by the TM and GA (based on the results of design points and predictions of RSM) where the \({{\text{Nu}}}_{avg}\) is maximum are reported. In addition, the points where this output parameter is minimum are also given. Table 7 indicates the optimum point in which the average Nusselt number is maximized and also the point where this parameter minimized.
Utilizing the RSM approach, the established continuous design space enables optimization with notable reductions in computational expenses. The GA is applied to optimize the output parameter, and the corresponding outcomes are presented in Table 8 . The conditions selected by the GA are very close to the point selected by the TM. The optimum point predicted by the TM showed a higher average Nusselt number. However, the error rate in Taguchi’s prediction was almost more compared to the prediction of the GA.
Figure 10 shows isotherm and streamlines for the optimum point obtained by the TM. For the optimum condition, as determined from the temperature contour (Fig. 11 a), the temperature gradian next to the hot and cold wall is much higher compared to the worst condition (Fig. 10 c). The density of streamlines in Fig. 11 b, which shows optimum point, is really high compared to when \({{\text{Nu}}}_{avg}\) is at its minimum value (Fig. 11 d).

Temperature contour ( a ) maximum point ( c ) minimum point and streamlines ( b ) maximum point ( d ) minimum point obtained based on TM.

Temperature contour ( a ) maximum point ( c ) minimum point and streamlines ( b ) maximum point ( d ) minimum point obtained based on GA.
Figure 11 shows isotherm (Fig. 11 a,c) and streamlines (Fig. 11 b,d) for optimum point obtained by GA. The things that were mentioned for the minimum and maximum points obtained by the TM can also be seen here. Since the optimal point obtained by this method (Fig. 11 a,b) is geometrically very similar to the previous optimal point (Fig. 10 a,b), the temperature contour and their streamlines are almost similar.
Sensitivity analysis
In this section, ANOVA and GSA are used to statistically investigate the effect of independent parameters on the output parameter. The type of ANOVA is used in this part is ANOVA by DOE which these design points are based on the same points that were used in the TM (L 27 orthogonal arrays). But GSA was applied to the available data in RSM.
As mentioned in section " Taguchi method (TM) and response surface method (RSM) ", ANOVA can be used to illustrate how the variables affect the output parameter by using the ratio of the variance of each variable to total variance. The larger F value (the ratio of two variances) shows that variation of input factor plays major role in performance of response parameter. The percentage of contribution is calculated by dividing F value of each section in total F value. Table 9 shows Darcy number by far is the most effective parameter with a contribution ratio of 79.37%. Following by porosity and length of fins in second and third place with a contribution ratio of 9.83% and 6.63%, respectively. Other parameters have negligible effect on the output parameter with a contribution of less than 2%.
Due to the complicated interaction between input parameters and the output response, employing a GSA is valuable for assessing the importance of the design parameters. GSA involves simultaneously varying all input factors and assessing sensitivity across the entire range of each input variables. Figure 12 illustrates the outcomes of the analysis. It should be noted that the positive values of the sensitivity analysis indicate that the response increases as the value of the input parameter increases. The negative sensitivity factor displays an inverse correlation in this relation. According to the results, it is obvious that Darcy number is the most effective parameter with the factor of 0.614. The second influential parameter on the output is porosity.

Global sensitivity of the input–output parameters.
The Taguchi method (TM) and genetic algorithm (GA) contributed greatly to reduce cost of numerical simulation for better understanding fluid flow and heat transfer in porous cavity filled by nanofluids. In this paper, by creating a design space consisting of six input parameters, included length, number and distance between fins, porosity, Darcy number and volumetric fraction of nanoparticles, an attempt was made to reach the appropriate physical and geometrical conditions to obtain maximum average Nusselt number. First, to reducing number of design points of experiments (DOE), TM was utilized. Then the double MRT-LBM was carried out on 27 initial design points generated by TM. After that, using the MRT-LBM results, TM and GA, the output parameter were answered in the entire design space. Regarding the obtained response surfaces, an optimization was accomplished and the sensitivity of the output variable from the input variables was investigated. According to the results, the following conclusions were drawn:
The best desing for increasing the heat transfer rate is: The length of fins ( \(H\) = L/2), the number of fins ( \(N=\) 2), the distance between fins ( \(D\) = L/12), porosity ( \(\varepsilon =\) 0.8), Darcy number ( \({\text{Da}}=\) 0.1), and volumetric fraction of the nanoparticles ( \(\varnothing =\) 0.02).
The worst position for heat transfer enhancement is: The length of fins ( \(H=\) L/6), the number of fins ( \(N=\) 4), the distance between fins ( \(D=\) L/6), porosity ( \(\varepsilon =\) 0.4), Darcy number ( \({\text{Da}}=\) 0.001), and volumetric fraction of the nanoparticles ( \(\varnothing =\) 0.005).
Darcy number is the most effective parameter compared other variables studied in his work on average Nusselt number with GSA 0.614 and ANOVA contribution of 79.37%.
Number of fins is the least effective parameter compared other variables studied in this work on heat transfer rate with GSA -0.083 and ANOVA contribution of 0.3%.
Prediction of GA is more accurate than the TM in comparison with the simulation results.
Data availability
The datasets used and/or analyzed during the current study available from the corresponding author on reasonable request.
Abbreviations
Velocity distribution function
Temperature distribution function
Permeability
Thermal conductivity
Dimensionless temperature
Temperature
Darcy number
Nusselt number
Rayleigh number
Dimensionless coordinates
Transformation matrix for flow field
Transformation matrix for temperature field
Dimensionless x–y directions coordinate velocity
X–y directions coordinate velocity
Signal-to-noise ratio
Thermal diffusivity
Thermal expansion coefficient
Kinematic viscosity
Dynamic viscosity
Indexes for the discrete direction
X- and y-coordinate system
Das, D., Roy, M. & Basak, T. Studies on natural convection within enclosures of various (non-square) shapes—A review. Int. J. Heat Mass Transf. 106 , 356–406 (2017).
Article CAS Google Scholar
Giwa, S. O. et al. A review of magnetic field influence on natural convection heat transfer performance of nanofluids in square cavities. J. Therm. Anal. Calorim. 145 (5), 2581–2623 (2021).
Ho, C. & Chang, J. Conjugate natural-convection–conduction heat transfer in enclosures divided by horizontal fins. Int. J. Heat Fluid Flow 14 (2), 177–184 (1993).
Article MathSciNet CAS Google Scholar
Öztop, H. F. et al. A brief review of natural convection in enclosures under localized heating with and without nanofluids. Int. Commun. Heat Mass Transf. 60 , 37–44 (2015).
Article Google Scholar
Rostami, S. et al. A review on the control parameters of natural convection in different shaped cavities with and without nanofluid. Processes 8 (9), 1011 (2020).
Izadi, M. et al. Natural convection of a magnetizable hybrid nanofluid inside a porous enclosure subjected to two variable magnetic fields. Int. J. Mech. Sci. 151 , 154–169 (2019).
Izadi, M. et al. LTNE modeling of Magneto-Ferro natural convection inside a porous enclosure exposed to nonuniform magnetic field. Phys. A Stat. Mech. Appl. 535 , 122394 (2019).
Shah, Z., Sheikholeslami, M. & Kumam, P. Simulation of entropy optimization and thermal behavior of nanofluid through the porous media. Int. Commun. Heat Mass Transf. 120 , 105039 (2021).
Miroshnichenko, I. V. et al. Natural convection of alumina-water nanofluid in an open cavity having multiple porous layers. Int. J. Heat Mass Transf. 125 , 648–657 (2018).
Abderrahmane, A. et al. The baffle shape effects on natural convection flow and entropy generation in a nanofluid-filled permeable container with a magnetic field. Sci. Rep. 14 (1), 2550 (2024).
Article MathSciNet CAS PubMed PubMed Central Google Scholar
Alsabery, A. I. et al. Natural convection of Al 2 O 3 -water nanofluid in a non-Darcian wavy porous cavity under the local thermal non-equilibrium condition. Sci. Rep. 10 (1), 18048 (2020).
Article CAS PubMed PubMed Central Google Scholar
Hussain, S., Jamal, M. & Geridonmez, B. P. Impact of fins and inclined magnetic field in double lid-driven cavity with Cu–water nanofluid. Int. J. Therm. Sci. 161 , 106707 (2021).
Al-Farhany, K. et al. Effects of fins on magnetohydrodynamic conjugate natural convection in a nanofluid-saturated porous inclined enclosure. Int. Commun. Heat Mass Transf. 126 , 105413 (2021).
Arani, A. A. A. & Roohi, E. Natural convection in a nanofluid-filled square cavity with an arc-shaped heated baffle. Comput. Therm. Sci. Int. J. 4 (2), 159–168 (2012).
Mahmoodi, M. & Hemmat Esfe, M. Buoyancy driven heat transfer of a nanofluid in a differentially heated square cavity under effect of an adiabatic square baffle. J. Heat Mass Transf. Res. 2 (2), 1–13 (2015).
Google Scholar
Hamida, M. B. B. & Hatami, M. Investigation of heated fins geometries on the heat transfer of a channel filled by hybrid nanofluids under the electric field. Case Stud. Therm. Eng. 28 , 101450 (2021).
Ahmed, S. E. & Rashed, Z. MHD natural convection in a heat generating porous medium-filled wavy enclosures using Buongiorno’s nanofluid model. Case Stud. Therm. Eng. 14 , 100430 (2019).
Izadi, M., Sheremet, M. A. & Mehryan, S. Natural convection of a hybrid nanofluid affected by an inclined periodic magnetic field within a porous medium. Chin. J. Phys. 65 , 447–458 (2020).
Selimefendigil, F. & Öztop, H. F. Magnetohydrodynamics forced convection of nanofluid in multi-layered U-shaped vented cavity with a porous region considering wall corrugation effects. Int. Commun. Heat Mass Transf. 113 , 104551 (2020).
Baghsaz, S., Rezanejad, S. & Moghimi, M. Numerical investigation of transient natural convection and entropy generation analysis in a porous cavity filled with nanofluid considering nanoparticles sedimentation. J. Mol. Liq. 279 , 327–341 (2019).
Sajjadi, H. et al. Optimization of heating and cooling system locations by Taguchi’s method to maximize or minimize the natural convection heat transfer rate in a room. Iran. J. Sci. Technol. Trans. Mech. Eng. 47 , 1599–1614 (2023).
Sobhani, M., Tighchi, H. A. & Esfahani, J. A. Taguchi optimization of combined radiation/natural convection of participating medium in a cavity with a horizontal fin using LBM. Phys. A Stat. Mech. Appl. 509 , 1062–1079 (2018).
Sajjadi, H. et al. Investigation of MHD natural convection in a porous media by double MRT lattice Boltzmann method utilizing MWCNT–Fe 3 O 4 /water hybrid nanofluid. Int. J. Heat Mass Transf. 132 , 1087–1104 (2019).
Rahimi, A. et al. Lattice Boltzmann simulation of free convection’s hydrothermal aspects in a finned/multi-pipe cavity filled with CuO-water nanofluid. Int. J. Numer. Methods Heat Fluid Flow 29 (3), 1058–1078 (2019).
Sajjadi, H. et al. Natural convection heat transfer in a porous cavity with sinusoidal temperature distribution using Cu/water nanofluid: Double MRT lattice Boltzmann method. Commun. Comput. Phys. 29 (1), 292–318 (2021).
Article MathSciNet Google Scholar
Sheikholeslami, M. & Vajravelu, K. Lattice Boltzmann method for nanofluid flow in a porous cavity with heat sources and magnetic field. Chin. J. Phys. 56 (4), 1578–1587 (2018).
Rahimi, A. et al. Lattice Boltzmann method based on Dual-MRT model for three-dimensional natural convection and entropy generation in CuO–water nanofluid filled cuboid enclosure included with discrete active walls. Comput. Math. Appl. 75 (5), 1795–1813 (2018).
Taguchi, G., Elsayed, E. A. & Hsiang, T. C. Quality Engineering in Production Systems (McGraw-Hill Companies, New York, 1988).
Bazkhane, S. & Zahmatkesh, I. Taguchi–based sensitivity analysis of hydrodynamics and heat transfer of nanofluids in a microchannel heat sink (MCHS) having porous substrates. Int. Commun. Heat Mass Transf. 118 , 104885 (2020).
Javadpour, S. M. et al. Optimization of geometry and nano-fluid properties on microchannel performance using Taguchi method and genetic algorithm. Int. Commun. Heat Mass Transf. 119 , 104952 (2020).
Box, G. E. & Wilson, K. B. in Breakthroughs in Statistics: Methodology and Distribution 270–310 (Springer, 1992).
Sofotasiou, P. et al. Towards an integrated computational method to determine internal spaces for optimum environmental conditions. Comput. Fluids 127 , 146–160 (2016).
Mansouri, N., Moghimi, M. & Taherinejad, M. Investigation on hydrodynamics and mass transfer in a feed channel of a spiral-wound membrane element using response surface methodology. Chem. Eng. Res. Des. 149 , 147–157 (2019).
Huang, Z. et al. Poly (vinyl alcohol)/ZSM-5 zeolite mixed matrix membranes for pervaporation dehydration of isopropanol/water solution through response surface methodology. Chem. Eng. Res. Des. 144 , 19–34 (2019).
Khanafer, K., Vafai, K. & Lightstone, M. Buoyancy-driven heat transfer enhancement in a two-dimensional enclosure utilizing nanofluids. Int. J. Heat Mass Transf. 46 (19), 3639–3653 (2003).
Nithiarasu, P., Seetharamu, K. & Sundararajan, T. Natural convective heat transfer in a fluid saturated variable porosity medium. Int. J. Heat Mass Transf. 40 (16), 3955–3967 (1997).
Guo, Z. & Zhao, T. A lattice Boltzmann model for convection heat transfer in porous media. Numer. Heat Transf. Part B 47 (2), 157–177 (2005).
Article ADS Google Scholar
Download references
Author information
Authors and affiliations.
Department of Mechanical Engineering, University of Bojnord, Bojnord, Iran
H. Sajjadi, S. N. Nabavi & A. Amiri Delouei
Department of Mechanical Engineering, Iran University of Science and Technology, Tehran, Iran
N. Mansouri
Department of Mechanical Engineering, Sirjan University of Technology, Sirjan, Iran
M. Atashafrooz
You can also search for this author in PubMed Google Scholar
Contributions
H.S., N.M. and S.N.N. wrote the main H.S., M.A. and A.A.D. analyzed the flow field by the MRT-LBM N.M. and S.N.N. considered the optimization methods and sensitivity analysis. All authors reviewed the manuscript.
Corresponding authors
Correspondence to H. Sajjadi or N. Mansouri .
Ethics declarations
Competing interests.
The authors declare no competing interests.
Additional information
Publisher's note.
Springer Nature remains neutral with regard to jurisdictional claims in published maps and institutional affiliations.
Rights and permissions
Open Access This article is licensed under a Creative Commons Attribution 4.0 International License, which permits use, sharing, adaptation, distribution and reproduction in any medium or format, as long as you give appropriate credit to the original author(s) and the source, provide a link to the Creative Commons licence, and indicate if changes were made. The images or other third party material in this article are included in the article's Creative Commons licence, unless indicated otherwise in a credit line to the material. If material is not included in the article's Creative Commons licence and your intended use is not permitted by statutory regulation or exceeds the permitted use, you will need to obtain permission directly from the copyright holder. To view a copy of this licence, visit http://creativecommons.org/licenses/by/4.0/ .
Reprints and permissions
About this article
Cite this article.
Sajjadi, H., Mansouri, N., Nabavi, S.N. et al. Sensitivity analysis of natural convection in a porous cavity filled with nanofluid and equipped with horizontal fins using various optimization methods and MRT-LB. Sci Rep 14 , 9847 (2024). https://doi.org/10.1038/s41598-024-60330-0
Download citation
Received : 30 December 2023
Accepted : 22 April 2024
Published : 29 April 2024
DOI : https://doi.org/10.1038/s41598-024-60330-0
Share this article
Anyone you share the following link with will be able to read this content:
Sorry, a shareable link is not currently available for this article.
Provided by the Springer Nature SharedIt content-sharing initiative
- Natural convection
- Porous media
- Multi-relaxation time lattice Boltzmann method
- Taguchi method
- Response surface method
- Genetic algorithm
By submitting a comment you agree to abide by our Terms and Community Guidelines . If you find something abusive or that does not comply with our terms or guidelines please flag it as inappropriate.
Quick links
- Explore articles by subject
- Guide to authors
- Editorial policies
Sign up for the Nature Briefing: AI and Robotics newsletter — what matters in AI and robotics research, free to your inbox weekly.

Assessing soil erosion vulnerability through geospatial morphometric analysis in the Oued Amter Basin (Northwest Morocco)
- Original Paper
- Published: 02 May 2024
Cite this article

- Mohammed El Brahimi 1 ,
- Mohamed Mastere 1 ,
- Brahim Benzougagh ORCID: orcid.org/0000-0002-1787-9678 1 ,
- Bouchta El Fellah 1 ,
- Najia Fartas 1 ,
- Latifa Ladel 1 ,
- Ayyoub Sbihi 1 ,
- Benson Turyasingura 2 ,
- Saleh Alsulamy 3 ,
- Khaled Mohamed Khedher ORCID: orcid.org/0000-0002-4167-1690 4 ,
- Ahmed Ali A. Shohan 3 ,
- Mohamed Abdelaziz Salem 5 &
- Ayed Eid Alluqmani 6
Sustainable development is threatened by soil erosion. Since it takes over 300 years for a centimeter of soil to form, preventing soil erosion is essential to safeguarding priceless resources. In any hydrological analysis, morphometric analysis is a relevant scientific method that is essential to the development and management of drainage basins. The main objectives of this study were (i) to analyze the morphometric parameters of the Oued Amter Basin using geographic information systems (GIS) and remote sensing (RS) (geospatial tools) and (ii) to prioritize sub-basins and identify the major morphometric parameters that influence soil erosion in the Oued Amter Basin. Morphometric analysis of the Oued Amter Basin (300 km 2 ) was performed to prioritize sub-basins based on their susceptibility to erosion by water using geospatial tools (remote-sensing-based data and a GIS). The linear, relief, and shape morphometric parameters of the drainage network were calculated using data from the Advanced Land Observing Satellite (ALOS) phased-array L-type synthetic-aperture radar (PALSAR) digital elevation model (DEM) with a spatial resolution of 12.5 m. These parameters revealed the network’s texture, morpho-tectonics, geometry, and relief characteristics (including stream length (Lu) and mean stream length (Lsm), stream length ratio (RL), bifurcation ratio (Rb), average bifurcation ratio (RBM), drainage density (Dd), drainage texture ( T ), flow frequency (Fs), elongation rate (Re), circularity ratio (Rc), form factor (Ff), relief, and relief ratio). Using the array of compound (Cp) values that were computed, we set the priority ranks and divided the sub-watershed into four priority-rank groups: (i) low, which represents 5% of the basin surface; (ii) moderate, which represents 30%; (iii) high, which represents 35%; and (iv) extremely high, which represents 30% of the basin surface. The results show that this classification is valuable for prioritizing and planning interventions focused on addressing soil erosion and mitigating natural hazard risks within the watershed. The method tested here has been shown to be an effective tool to improve sustainable soil management.
This is a preview of subscription content, log in via an institution to check access.
Access this article
Price includes VAT (Russian Federation)
Instant access to the full article PDF.
Rent this article via DeepDyve
Institutional subscriptions
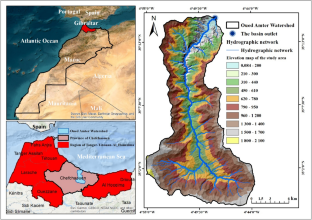
Abbreviations
Area of basin
Advanced Spaceborne Thermal Emission and Refection Radiometer
Channel maintenance constant
Compactness coefficient
Compound values
Drainage density
Digital elevation model
Drainage texture
Form factor
Stream frequency
Geographic information system
Infiltration number
Square kilometers
Length of overland flow
Stream length
Mean stream length
Stream number
Perimeter of basin
Quantum GIS
Circularity ratio
Elongation ratio
Bifurcation ratio
Stream length ratio
Sub-watershed
Remote sensing
Texture ratio
Stream order
Ahmad Rather M, Satish Kumar J, Farooq M, Rashid H (2017) Assessing the influence of watershed characteristics on soil erosion susceptibility of Jhelum basin in Kashmir Himalayas. Arab J Geosci 10:59
Article Google Scholar
Allen CG, Andres C, Sheldon ML (2001) Developing a geomorphic approach for ranking watersheds for rehabilitation, Zuni India reservation. New Mexico J Geomorphol 37(1–2):105–134. https://doi.org/10.1016/S0169-555X(00)00065-9
Angima SD, Stott DE, O’Neill MK, Ong CK, Weesies GA (2003) Soil erosion prediction using RUSLE for central Kenya highland conditions. Agric Ecosyst Environ 97:295–308
Arabameri A, Rezaei K, Cerda A, Lombardo L, Rodrigo-Comino J (2019) GIS-based groundwater potential mapping in Shahroud plain, Iran. A comparison among statistical (bivariate and multivariate), data mining and MCDM approaches. Sci Total Environ 658:160–177. https://doi.org/10.1016/j.scitotenv.2018.12.115
Article CAS Google Scholar
Arefin R, Mohir MMI, Alam J (2020) Watershed prioritization for soil and water conservation aspect using GIS and remote sensing: PCA-based approach at northern elevated tract Bangladesh. Appl Water Sci 10(4):1–19. https://doi.org/10.1007/s13201-020-1176-5
Arun PS, Jana R, Nathawat MS (2005) A rule based physiographic characterization of a drought prone watershed applying remote sensing and GIS. J Indian Soc Remote Sens 33(2):189–201. https://doi.org/10.1007/BF02990035
Astras T, Soulankellis N (1992) Contribution of digital image analysis techniques on Landsat-5 TM imageries for drainage delineation. A case study from the Olympus Mountain, west Macedonia, Greece. In: Proc 18th Annual Conf of Remote Sensing Society, Dundee, UK, 15–17 Sept 1992, pp 15–17
Bali YP, Karale RL (1977) A sediment yield index for choosing priority basins. IAHS AISH Publ 222:180
Google Scholar
Bendjoudi H, Hubert P (2002) Le coefficient de compacité de Gravelius: Analyse critique d’un indice de forme des bassins versants. Hydrol Sci J 47(6):921–930. https://doi.org/10.1080/02626660209493000
Benzougagh B, Boudad L, Dridri A, Driss S (2016) Utilisation du Sig dans L’analyse morphométrique et la prioritisation ses sous-bassins versants de Oued Inaouene (Nord-Est du Maroc). Eur Sci J 12(6):266. https://doi.org/10.19044/esj.2016.v12n6p266
Benzougagh B, Dridri A, Boudad L, Kodad O, Sdkaoui D, Bouikbane H (2017) Evaluation of natural hazard of Inaouene Watershed River in Northeast of Morocco: Application of Morphometric and Geographic Information System approaches. Int J Innov Appl Stud 19(1):85
Benzougagh B, Meshram SG, Dridri A, Boudad L, Baamar B, Sadkaoui D, Khedher KM (2022) Identification of critical watershed at risk of soil erosion using morphometric and geographic information system analysis. Appl Water Sci 12:1–20. https://doi.org/10.1007/s13201-023-01963-w
Benzougagh B, Meshram SG, Fellah BE, Mastere M, El Basri M, Ouchen I, Sadkaoui D, Bammou Y, Moutaoikil N, Turyasingura B (2023) Mapping of land degradation using spectral angle mapper approach (SAM): the case of Inaouene watershed (Northeast Morocco). Model Earth Syst Env 10:221–231. https://doi.org/10.1007/s40808-023-01711-8
Bhatt S, Ahmed SA (2014) Morphometric analysis to determine floods in the Upper Krishna basin using Cartosat DEM. Geocarto Int 29(8):878–894. https://doi.org/10.1080/10106049.2013.868042
Bhattacharya A (2013) Evolution of the hydro-geonomic characteristics of flood in the Mayurakshi River basin of Eastern India. Doctoral dissertation. The University of Visva-Bharati, Shantiniketan, pp 24–82, 100–147. http://hdl.handle.net/10603/19911 . Accessed 8 April 2017
Biswas S, Sudhakar S, Desai VR (1999) Prioritisation of subwatersheds based on morphometric analysis of drainage basin: A remote sensing and GIS approach. J Indian Soc Remote Sens 27(3):155–166. https://doi.org/10.1007/BF02991569
Chalouan A (1986) Les nappes Ghomarides (Rif septentrional, Maroc), un terrain varisque dans la chaîne alpine. Doctoral dissertation. Strasbourg 1, Strasbourg
Chandniha SK, Kansal ML (2017) Prioritization of sub-watersheds based on morphometric analysis using geospatial technique in Piperiya watershed, India. Appl Water Sci 7:329–338. https://doi.org/10.1007/s13201-014-0248-9
Chandrashekar H, Lokesh KV, Sameena M, Roopa J, Ranganna G (2015) GIS-based morphometric analysis of two reservoir catchments of Arkavati River, Ramanagaram District, Karnataka. Aquat Procedia 4:1345–1353. https://doi.org/10.1016/j.aqpro.2015.02.175
Clarke C (1966) Morphometry from maps. Essays in geomorphology. Elsevier, New York, pp 235–274
Didon J, Durand-Delga M, Kornprobst J (1973) Homologies géologiques entre les deux rives du détroit de Gibraltar. Bull Soc Géol Fr 7(2):77–105. https://doi.org/10.2113/gssgfbull.S7-XV.2.77
Didon J, Durand-Delga M, Esteras M, Feinberg H, Magné J, Suter G (1984) La Formation des Grès Numidiens de l'arc de Gibraltar s’intercale stratigraphiquement entre des argiles oligocènes et des marnes burdygaliennes. C R Acad Sci Paris 299(3):121–128.
Durand-Delga M (1972) La courbure de Gibraltar extrémité occidentale des chaînes alpines unit l’Europe et l’Afrique. Eclogae Géol Helv 65:267–278
Durand-Delga M, Lespinasse P (1965) Le Miocène des Beni-Issef (Rif septentrional) et ses rapports avec la nappe numidienne. C R Somm Soc Géol France 10:321–323
Durand-Delga M, Rossi P, Olivier P, Puglisi D (2000) Situation structurale et nature ophiolitique de roches basiques jurassiques associées aux flyschs Maghrébens du Rif (Maroc) et de Sicile (Italie). C R Acad Sci 331:29–38
CAS Google Scholar
Efthymiadis D, Goodess CM, Jones PD (2011) Trends in Mediterranean gridded temperature extremes and large-scale circulation influences. Nat Hazard 11(8):2199–2214. https://doi.org/10.5194/nhess-11-2199-2011
El Brahimi, M, Benzougagh B, Najia F (2022) Quantification of soil sensitivity to water erosion by the RUSLE model in the Oued Amter watershed, northwestern Morocco. Iraqi Geol J 55(2C):41–55. https://doi.org/10.46717/igj.55.2C.4ms-2022-08-17
Faniran A (1968) The index of drainage intensity—A provisional new drainage factor. Austral J Sci 31:328–330
FAO, F. Agriculture Organization of the United Nations (1970) Amino acid content of foods, 2
Fartas N, El Fellah B, Mastere M, Benzougagh B, El Brahimi M (2022). Potential soil erosion modeled with RUSLE approach and geospatial techniques (GIS tools and remote sensing) in Oued Joumouaa Watershed (Western Prerif-Morocco). Iraqi Geol J 55(2B):47–61. https://doi.org/10.46717/igj.55.2B.5Ms-2022-08-21
Gajbhiye S, Mishra SK, Pandey A (2013a) Prioritizing erosion prone area through morphometric analysis: An RS and GIS perspective. Appl Water Sci 4(1):51–61. https://doi.org/10.1007/s13201-013-0129-7
Gajbhiye S, Mishra SK, Pandey A (2013b) Prioritization of Shakkar River catchment through morphometric analysis using remote sensing and gis techniques. J Emerg Technol Mech Sci Eng 4(2):129–142
Gajbhiye S, Mishra SK, Pandey A (2014) Prioritizing erosion-prone area through morphometric analysis: an RS and GIS perspective. Appl Water Sci 4:51–61
Gravelius H (1914) Grundrifi der gesamten Gewcisserkunde. Band I: Flufikunde (Compendium of Hydrology, vol. I. Rivers). Goschen, Berlin
Gravelius H (1941) Flusskunde. Goschen’sche Verlagshandlung, Berlin
GSI (1985) Geological quadrangle map, Barddhaman Quadrangle (72P, 73 M). Geological Survey of India, Printing Division, Hydrabad
Heush B (1970) L’érosion du Pré-Rif. Ann Rech For Maroc 12
Horton RE (1932) Drainage basin characteristics. Trans Am Geophys Union 13:350–361. https://doi.org/10.1029/TR013i001p00350
Horton RE (1945) Erosional development of streams and their drainage basins: Hydrophysical approach to quantitative morphology. Geol Soc Am Bull 56:275–370
Iqbal M, Sajjad H (2014) Watershed prioritization using morphometric and land use/land cover parameters of Dudhganga Catchment Kashmir Valley India using spatial technology. J Geophys Remote Sens 3:115. https://doi.org/10.4172/2169-0049.1000115
IWD (2015) Annual flood report for the year 2015. Irrigation and Waterways Department (IWD), Govt of West Bengal, Kolkata. https://wbiwd.gov.in/uploads/anual_flood_report/ANNUAL_FLOOD_REPORT_2015.pdf . Accessed 8 April 2017
Javed A, Khanday MY, Ahmed R (2009) Prioritization of subwatersheds based on morphometric and land use analysis using remote sensing and GIS technique. J Indian Soc Rem Sens 37:261–274. https://doi.org/10.1007/s12524-009-0016-8
Kamp U, Bolch T, Olsenholler J (2005) Geomorphometry of Cerro Sillajhuay (Andes, Chile/Bolivia): comparison of digital elevation models (DEMs) from ASTER remote sensing data and contour maps. Geocarto Int 20(1):23–33. https://doi.org/10.1080/10106040508542333
Kouli M, Vallianatos F, Soupios P, Alexakis D (2007) GIS-based morphometric analysis of two major watersheds, western Crete, Greece. J Environ Hydrol 15:1–17
Kumar A, Jayappa KS, Deepika B (2011) Prioritization of sub-basins based on geomorphology and morphometric analysis using remote sensing and geographic information system (GIS) techniques. Geocarto Int. https://doi.org/10.1080/10106049.2011.606925
Leopold LB, Wolman MG, Miller JP (1964) The drainage basin as a geometric unit (Chap 5). In: Fluvial processes in geomorphology. WH Freeman and Co, San Francisco
Magesh NS, Jitheshlal KV, Chandrasekar N, Jini KV (2013) Geographical information system-based morphometric analysis of Bharathapuzha river basin, Kerala, India. Appl Water Sci 3(2):467–477. https://doi.org/10.1007/s13201-013-0095-0
Maji A (2007) Assessment of degraded and wastelands of India. J Indian Soc Soil Sci 55:427–435
Manu MS, Anirudhan S (2008) Drainage characteristics of Achankovil river basin, Kerala. J Geol Soc India 71:841–850
Markose Joseph V, Dinesh AC, Jayappa KS (2014) Quantitative analysis of morphometric parameters of Kali River basin, southern India, using bearing azimuth and drainage (bAd) calculator and GIS. Environ Earth Sci 72:2887–2903. https://doi.org/10.1007/s12665-014-3193-x
Mastere M (2011) L’aléa mouvements de terrain dans la province de Chefchaouen (Rif Central, Maroc): Analyse spatiale, et modélisation probabiliste multi-echelle. Doctoral dissertation. Université de Bretagne Occidentale, Brest. https://www.theses.fr/2011BRES2070
Meshram SG, Sharma SK (2017) Prioritization of watershed through morphometric parameters: A PCA-based approach. Appl Water Sci 7(3):1505–1519. https://doi.org/10.1007/s13201015-0332-9
Miller VC (1953) A quantitative geomorphologic study of drainage basin characteristics in the clinch mountain area, Virginia and Tennessee. Technical report no. 3, contract N6 ONR. Department of Geology, Columbia University, New York, pp 271–300
Nag SK, Chakraborty S (2003) Influence of rock types and structures in the development of drainage network in hard rock area. J Indian Soc Rem Sens 31(1):25–35. https://doi.org/10.1007/BF03030749
NATMO (2001) National atlas and thematic mapping organization, district planning map series (DST). Digital Mapping and Printed Division, Govt. of India, Kolkata
Pakhmode V, Kulkarni H, Deolankar SB (2003) Hydrological-drainage analysis in watershed-programme planning: A case from the Deccan basalt. India Hydrogeol J 11(5):595–604. https://doi.org/10.1007/s10040-003-0279-z
Pandey A, Chowdary VM, Mal BC (2004) Morphological analysis and watershed management using GIS. Hydrology J 27(3 & 4):71–84
Prakash K, Mohanty T, Pati JK, Singh S, Chaubey K (2017) Morphotectonics of the Jamini River basin, Bundelkhand Craton, Central India; using remote sensing and GIS technique. Appl Water Sci 7(7):3767–3782. https://doi.org/10.1007/s13201-016-0524-y
Prasannakumar V, Vijith H, Geetha N (2013) Terrain evaluation through the assessment of geomorphometric parameters using DEM and GIS: case study of two major sub-watersheds in Attapady, South India. Arab J Geosci 6:1141–1151. https://doi.org/10.1007/s12517-011-0408-2
Rai PK, Chandel RS, Mishra VN, Singh P (2018) Hydrological inferences through morphometric analysis of lower Kosi River basin of India for water resource management based on remote sensing data. Appl Water Sci 8:1–16. https://doi.org/10.1007/s13201-018-0660-7
Ritter DF, Kochel RC, Miller JR (1995) Process geomorphology, 3rd edn. WC Brown, Dubuque, p 539
Romshoo SA, Bhat SA, Rashid I (2012) Geoinformatics for assessing the morphometric control on hydrological response at watershed scale in the Upper Indus basin. J Earth Syst Sci 121(3):659–686. https://doi.org/10.1007/s12040-012-0192-8
Sabir M, Roose E, Machouri N, Naouri A (2002) Gestion paysanne des ressources naturelles dans deux terroirs des montagnes méditerranéennes du Rif occidental (Maroc). Bulletin Réseau Érosion 21:414–428
Schumm SA (1956) Evolution of drainage systems and slopes in badlands at Perth Amboy, New Jersey. Bull Geol Soc Am 67:597–646. https://doi.org/10.1130/0016-7606(1956)67%5b597:EODSAS%5d2.0.CO;2
Sharma SK, Gajbhiye S, Nema RK, Tignath S (2014) Assessing vulnerability to soil erosion of a watershed of tons river basin in Madhya Pradesh using remote sensing and GIS. Int J Environ Res Dev 4(2):153–164
Sharma T, Singh O (2017) Soil erosion susceptibility assessment through geo-statistical multivariate approach in Panchkula district of Haryana, India. Model Earth Syst Environ 3:733–753. https://doi.org/10.1007/s40808-017-0331-y
Singh AK, Kala S, Dubey SK, Rao BK, Gaur ML, Mohapatra KP, Prasad B (2014) Evaluation of bamboo-based conservation measures for rehabilitation of degraded Yamuna ravines. Indian J Soil Conserv 42(1):80–84
Smith KG (1950) Standards for grading texture of erosional topography. Am J Sci 248:655–668. https://doi.org/10.2475/ajs.248.9.655
Sreedevi PD, Subrahmanyam K, Ahmed S (2004) The significance of morphometric analysis for obtaining groundwater potential zones in a structurally controlled terrain. Environ Geol 47(3):412–420. https://doi.org/10.1007/s00254004-1166-1
Strahler AN (1957) Quantitative analysis of watershed geomorphology. Trans Am Geophys Union 38:913–920. https://doi.org/10.1029/TR038i006p00913
Strahler AN (1964) Quantitative geomorphology of drainage basin and channel networks. In: Chow VT (ed) Handbook of applied hydrology. McGraw Hill, New York, pp 4–76
Subba Rao N (2009) A numerical scheme for groundwater development in a watershed basin of basement terrain: A case study from India. Hydrogeol J 17(2):379–396. https://doi.org/10.1007/s10040-008-0402-2
Suresh M, Sudhakar S, Tiwari KN, Chowdary VM (2004) Prioritization of watersheds using morphometric parameters and assessment of surface water potential using remote sensing. J Indian Soc Remote Sens 32:249–259. https://doi.org/10.1007/BF03030885
Sutradhar H (2020) Assessment of drainage morphometry and watersheds prioritization of Siddheswari River Basin, Eastern India. J indian Soc Rem Sens 48(4):627–644. https://doi.org/10.1007/s12524-020-01108-5
Udaipur E, Singh PK, Yadav KK (2020) Assessment of surface runoff using ArcSWAT for Rela Watershed, Rajasthan, India. J Geogr Environ Earth Sci Int 24(10):23–32. https://doi.org/10.9734/jgeesi/2020/v24i1030260
Umair A, Syed AA (2014) Analysis of drainage morphometry and watershed prioritization of Romushi-Sasar catchment, Kashmir Valley, India using remote sensing and GIS technology. Int J Adv Res 2(12):5–23
Umrikar BN (2017) Morphometric analysis of Andhale watershed, Taluka Mulshi, District Pune. India Appl Water Sci 7(5):2231–2243. https://doi.org/10.1007/s13201-016-0390-7
Verstappen H (1983) The applied geomorphology. International Institute for Aerial Survey and Earth Science (ITC), Enschede
Yadav SK, Singh SK, Gupta M, Srivastava PK (2014) Morphometric analysis of Upper Tons basin from Northern Foreland of Peninsular India using CARTOSAT satellite and GIS. Geocarto Int 29(8):895–914
Download references
Acknowledgements
The authors extend their appreciation to the Deanship of Scientific Research at King Khalid University for funding this work through a large research group. Project group number: RGP. 2/422/44.
This research work was supported by the Deanship of Scientific Research at King Khalid University under grant number RGP. 2/422/44.
Author information
Authors and affiliations.
Geophysics and Natural Hazards Laboratory, Department of Geomorphology and Geomatics, Scientific Institute, Mohammed V University in Rabat, Avenue Ibn Batouta, Agdal, PO Box 703, 10106, Rabat City, Morocco
Mohammed El Brahimi, Mohamed Mastere, Brahim Benzougagh, Bouchta El Fellah, Najia Fartas, Latifa Ladel & Ayyoub Sbihi
Institute of Tourism and Hospitality, Kabale University, Kabale, Uganda
Benson Turyasingura
Department of Architecture and Planning, College of Engineering, King Khalid University, 61421, Abha, Saudi Arabia
Saleh Alsulamy & Ahmed Ali A. Shohan
Department of Civil Engineering, College of Engineering, King Khalid University, 61421, Abha, Saudi Arabia
Khaled Mohamed Khedher
Department of Mechanical Engineering, College of Engineering, King Khalid University, 61421, Abha, Saudi Arabia
Mohamed Abdelaziz Salem
Department of Civil Engineering, Faculty of Engineering, Islamic University of Madinah, Madinah, Saudi Arabia
Ayed Eid Alluqmani
You can also search for this author in PubMed Google Scholar
Corresponding author
Correspondence to Brahim Benzougagh .
Ethics declarations
Conflict of interest.
The authors declared no potential conflicts of interest with respect to the research, authorship, and/or publication of this article.
Additional information
Responsible Editor: João Miguel Dias.
Rights and permissions
Springer Nature or its licensor (e.g. a society or other partner) holds exclusive rights to this article under a publishing agreement with the author(s) or other rightsholder(s); author self-archiving of the accepted manuscript version of this article is solely governed by the terms of such publishing agreement and applicable law.
Reprints and permissions
About this article
El Brahimi, M., Mastere, M., Benzougagh, B. et al. Assessing soil erosion vulnerability through geospatial morphometric analysis in the Oued Amter Basin (Northwest Morocco). Euro-Mediterr J Environ Integr (2024). https://doi.org/10.1007/s41207-024-00493-4
Download citation
Received : 18 November 2023
Accepted : 14 February 2024
Published : 02 May 2024
DOI : https://doi.org/10.1007/s41207-024-00493-4
Share this article
Anyone you share the following link with will be able to read this content:
Sorry, a shareable link is not currently available for this article.
Provided by the Springer Nature SharedIt content-sharing initiative
- Amter watershed (Morocco)
- Morphometric analysis
- Prioritization sub-catchments
- Remote sensing and GIS geoprocessing
- Soil erosion
- Natural hazard risks
- Find a journal
- Publish with us
- Track your research
IMAGES
VIDEO
COMMENTS
implications of such decisions suggest that extreme care be taken in analysis. Effective research in water pollution control also depends upon a valid laboratory data base, which in turn may contribute to sound evaluations of both the progress of the research itself and the viability of available water pollution-control alternatives.
The present paper aims to develop a new Water Quality Index (WQI) based on Data Envelopment Analysis (DEA). Rather than using subjective weights of a judgmental process as inputs of the DEA model, we propose more objective variables, identified as "optimistic closeness values", appropriately derived from the observed values of the hydrochemical parameters.
Water quality analysis is required mainly for monitoring purpose. Some importance of such assessment includes: To check whether the water quality is in compliance with the standards, and hence, suitable or not for the designated use. To monitor the efficiency of a system, working for water quality maintenance.
Water quality monitoring is a fundamental tool in the management of freshwater resources. ... details of sampling and analytical methods; guidance on data analysis and presentation. This book brings together information on proven methods and will be useful for anyone concerned with water quality monitoring with a scientific, managerial or ...
Water quality index (WQI) is one of the most used tools to describe water quality. It is based on physical, chemical, and biological factors that are combined into a single value that ranges from 0 to 100 and involves 4 processes: (1) parameter selection, (2) transformation of the raw data into common scale, (3) providing weights and (4) aggregation of sub-index values. The background of WQI ...
There are a number of methods for water quality assessment, including single-factor, multi-index, fuzzy mathematics, grey system evaluation, artificial neural network, multi-criteria analysis ...
The integrity of any water-related ecosystem will be dependent on two main aspects, the quantity and the quality of the water that is sustaining that ecosystem. For assessment of water quality, the 6.6.1 method (UN Water 2018d) proposes two different levels of analysis and reporting.
Management of water quality requires the collection and analysis of large water quality datasets that can be difficult to evaluate and synthesise. A range of tools have been developed to evaluate water quality data; the Water Quality Index (WQI) model is one such tool. ... and the methods used for sub-indexing and aggregation (Debels et al ...
Evaluation of water quality is a priority work nowadays. In order to monitor and map, the water quality for a wide range on different scales (spatial, temporal), the geospatial technique has the potential to minimize the field and laboratory work. The review has emphasized the advance of remote sensing for the effectiveness of spectral analysis, bio-optical estimation, empirical method, and ...
The Water Analysis Handbook (WAH) is the result of more than 85 years of research and method development. With over 300 illustrated, step-by-step instructions, this is your comprehensive source for water analysis procedures. From instruments to reagents, meters to probes, media to general lab supply, this handbook outlines everything you need ...
The methods of water quality analysis are selecte d . according to the requireme nt. The fact ors playin g key role f or . the selection of method s are: (i) Volume and number of samp le to be ...
Various water quality modeling methods with diverse commercial software packages have been used in different studies; ... Mbongowo, J., Mbuh, R. M., & Comfort, W. (2019). Water quality modeling and sensitivity analysis using the Water Quality Analysis Simulation Program (WASP) in the Shenandoah River watershed. Physical Geography, 40, 127-148 ...
The methodology uses a water quality index which combines data from the analysis of basic core water quality parameters. Some of these parameters are direct measures of water quality for ecosystem or human health, and the others are included to characterise the water body. Deviation
While some purpose-driven data collection and analysis have clear techniques and criteria for assigning significance, such as measurements of E. coli in surface waters (Eckner 1998), water quality analyses can also include undirected analyses to detect unknown, changing, or unusual conditions (Wintle et al. 2010).Similarly, data may also be routinely collected in water quality programs without ...
The step-by-step methodology for 6.3.2 explains how to monitor the proportion of bodies of water with good ambient water quality, including definitions, computational steps, and recommendations on spatial and temporal resolutions. UN Environment is the custodian agency of indicator 6.3.2, and they have developed this methodology in a ...
USGS scientists collect water samples for chemical analysis from an excavated pond in the New Jersey Pinelands. Credit: Kelly Smalling, USGS. The USGS has to utilize different methods and equipment when taking a sample of water from a stream—it all depends on the size of the stream, how deep the water is, and how fast the water is moving.
Common steps in involved in water quality analysis are data preprocessing, data splitting model training and testing, and results evaluation. These are the common steps involved in development in almost all ML methods. Finlay (2014) provided steps for building predictive models, which are outlined as follows:
Chemical Water Analysis Methods. Chemical analysis is a fundamental part of water quality analysis. It requires testing for different chemical parameters to identify contaminants and assess their levels in water. Some of the commonly tested chemical parameters include ammonia, chloride ion, nitrite, nitrate, phosphate, and water hardness.
Water Quality Parameters. Water quality parameters include chemical, physical, and biological properties and can be tested or monitored based on the desired water parameters of concern. Parameters that are frequently sampled or monitored for water quality include temperature, dissolved oxygen, pH, conductivity, ORP, and turbidity.
The analysis and simulation of water quality in distribution networks is a complex issue of great concern today. The analysis of the evolution of water age as a simple indicator of water quality in the network is of great interest in both the design and operation phases. Understanding the factors that have the strongest influence on water quality is key to developing adequate strategies aimed ...
Multivariate statistical techniques, including cluster analysis (CA), discriminant analysis (DA), principal component analysis (PCA) and factor analysis (FA), were used to evaluate temporal and spatial variations in and to interpret large and complex water quality datasets collected from the Shuangji River Basin. The datasets, which contained 19 parameters, were generated during the 2 year ...
Water quality analysis in a lake using deep learning methodology: prediction and validation. ... pond to a great extent, therefore, it is obligatory to test out the quality of water before consumption. With this motivation, the work explores many deep learning algorithms to estimate the Water Quality Index, which is a singular index to describe ...
A probabilistic measure of compliance of the monitored indicators with the established requirements is proposed to clarify the water quality in the zone of uncertainty, varying in the range of 1-0 so that when the average concentration approaches the lower limit, it tends to unity, and when approaching the upper limit, it goes to zero.
4.5. Comparison of water quality evaluation methods. The PCA method synthesizes pollutants into several principal components. Each pollutant was assigned a different weight; the greater the weight, the greater the impact of the pollutant on water quality. Finally, the pollution level of water quality was determined using the score of PCA.
In the present study, natural convection heat transfer is investigated in a porous cavity filled with Cu/water nanofluid and equipped with horizontal fins. Optimization and sensitivity analysis of ...
The frequency of early frosts has increased in recent years, which are injurious to olive growing, causing losses in the yield and quality of virgin olive oil. In this research, it was studied how the management of agronomic factors mitigates frost damage in Arbequina olives, minimizing the loss of phenols and volatiles in virgin olive oil, at different fruit ripening stages. A Box-Behnken ...
Due to the protection and increasing efficiency of desalination methods, the design of a suitable pretreatment method for desalination of salt water has made the process more economic. The methodology used in this research for the analysis of technological schemes includes two groups of technological and economic indicators: (A) water quality ...
Biostimulation aims to optimize reproductive parameters as part of animal management practices by modulating animal sensory systems. Chemical signals, mostly known as pheromones, have a great potential in this regard. This study was conducted to determine the influence of short-term male rabbit exposure to different biological secretions, potentially pheromone-mediated, on reproductive ...
Sustainable development is threatened by soil erosion. Since it takes over 300 years for a centimeter of soil to form, preventing soil erosion is essential to safeguarding priceless resources. In any hydrological analysis, morphometric analysis is a relevant scientific method that is essential to the development and management of drainage basins. The main objectives of this study were (i) to ...