- Skip to primary navigation
- Skip to main content
- Skip to primary sidebar
Institute for Digital Research and Education

FAQ: What are the differences between one-tailed and two-tailed tests?
When you conduct a test of statistical significance, whether it is from a correlation, an ANOVA, a regression or some other kind of test, you are given a p-value somewhere in the output. If your test statistic is symmetrically distributed, you can select one of three alternative hypotheses. Two of these correspond to one-tailed tests and one corresponds to a two-tailed test. However, the p-value presented is (almost always) for a two-tailed test. But how do you choose which test? Is the p-value appropriate for your test? And, if it is not, how can you calculate the correct p-value for your test given the p-value in your output?
What is a two-tailed test?
First let’s start with the meaning of a two-tailed test. If you are using a significance level of 0.05, a two-tailed test allots half of your alpha to testing the statistical significance in one direction and half of your alpha to testing statistical significance in the other direction. This means that .025 is in each tail of the distribution of your test statistic. When using a two-tailed test, regardless of the direction of the relationship you hypothesize, you are testing for the possibility of the relationship in both directions. For example, we may wish to compare the mean of a sample to a given value x using a t-test. Our null hypothesis is that the mean is equal to x . A two-tailed test will test both if the mean is significantly greater than x and if the mean significantly less than x . The mean is considered significantly different from x if the test statistic is in the top 2.5% or bottom 2.5% of its probability distribution, resulting in a p-value less than 0.05.
What is a one-tailed test?
Next, let’s discuss the meaning of a one-tailed test. If you are using a significance level of .05, a one-tailed test allots all of your alpha to testing the statistical significance in the one direction of interest. This means that .05 is in one tail of the distribution of your test statistic. When using a one-tailed test, you are testing for the possibility of the relationship in one direction and completely disregarding the possibility of a relationship in the other direction. Let’s return to our example comparing the mean of a sample to a given value x using a t-test. Our null hypothesis is that the mean is equal to x . A one-tailed test will test either if the mean is significantly greater than x or if the mean is significantly less than x , but not both. Then, depending on the chosen tail, the mean is significantly greater than or less than x if the test statistic is in the top 5% of its probability distribution or bottom 5% of its probability distribution, resulting in a p-value less than 0.05. The one-tailed test provides more power to detect an effect in one direction by not testing the effect in the other direction. A discussion of when this is an appropriate option follows.
When is a one-tailed test appropriate?
Because the one-tailed test provides more power to detect an effect, you may be tempted to use a one-tailed test whenever you have a hypothesis about the direction of an effect. Before doing so, consider the consequences of missing an effect in the other direction. Imagine you have developed a new drug that you believe is an improvement over an existing drug. You wish to maximize your ability to detect the improvement, so you opt for a one-tailed test. In doing so, you fail to test for the possibility that the new drug is less effective than the existing drug. The consequences in this example are extreme, but they illustrate a danger of inappropriate use of a one-tailed test.
So when is a one-tailed test appropriate? If you consider the consequences of missing an effect in the untested direction and conclude that they are negligible and in no way irresponsible or unethical, then you can proceed with a one-tailed test. For example, imagine again that you have developed a new drug. It is cheaper than the existing drug and, you believe, no less effective. In testing this drug, you are only interested in testing if it less effective than the existing drug. You do not care if it is significantly more effective. You only wish to show that it is not less effective. In this scenario, a one-tailed test would be appropriate.
When is a one-tailed test NOT appropriate?
Choosing a one-tailed test for the sole purpose of attaining significance is not appropriate. Choosing a one-tailed test after running a two-tailed test that failed to reject the null hypothesis is not appropriate, no matter how "close" to significant the two-tailed test was. Using statistical tests inappropriately can lead to invalid results that are not replicable and highly questionable–a steep price to pay for a significance star in your results table!
Deriving a one-tailed test from two-tailed output
The default among statistical packages performing tests is to report two-tailed p-values. Because the most commonly used test statistic distributions (standard normal, Student’s t) are symmetric about zero, most one-tailed p-values can be derived from the two-tailed p-values.
Below, we have the output from a two-sample t-test in Stata. The test is comparing the mean male score to the mean female score. The null hypothesis is that the difference in means is zero. The two-sided alternative is that the difference in means is not zero. There are two one-sided alternatives that one could opt to test instead: that the male score is higher than the female score (diff > 0) or that the female score is higher than the male score (diff < 0). In this instance, Stata presents results for all three alternatives. Under the headings Ha: diff < 0 and Ha: diff > 0 are the results for the one-tailed tests. In the middle, under the heading Ha: diff != 0 (which means that the difference is not equal to 0), are the results for the two-tailed test.
Two-sample t test with equal variances ------------------------------------------------------------------------------ Group | Obs Mean Std. Err. Std. Dev. [95% Conf. Interval] ---------+-------------------------------------------------------------------- male | 91 50.12088 1.080274 10.30516 47.97473 52.26703 female | 109 54.99083 .7790686 8.133715 53.44658 56.53507 ---------+-------------------------------------------------------------------- combined | 200 52.775 .6702372 9.478586 51.45332 54.09668 ---------+-------------------------------------------------------------------- diff | -4.869947 1.304191 -7.441835 -2.298059 ------------------------------------------------------------------------------ Degrees of freedom: 198 Ho: mean(male) - mean(female) = diff = 0 Ha: diff < 0 Ha: diff != 0 Ha: diff > 0 t = -3.7341 t = -3.7341 t = -3.7341 P < t = 0.0001 P > |t| = 0.0002 P > t = 0.9999
Note that the test statistic, -3.7341, is the same for all of these tests. The two-tailed p-value is P > |t|. This can be rewritten as P(>3.7341) + P(< -3.7341). Because the t-distribution is symmetric about zero, these two probabilities are equal: P > |t| = 2 * P(< -3.7341). Thus, we can see that the two-tailed p-value is twice the one-tailed p-value for the alternative hypothesis that (diff < 0). The other one-tailed alternative hypothesis has a p-value of P(>-3.7341) = 1-(P<-3.7341) = 1-0.0001 = 0.9999. So, depending on the direction of the one-tailed hypothesis, its p-value is either 0.5*(two-tailed p-value) or 1-0.5*(two-tailed p-value) if the test statistic symmetrically distributed about zero.
In this example, the two-tailed p-value suggests rejecting the null hypothesis of no difference. Had we opted for the one-tailed test of (diff > 0), we would fail to reject the null because of our choice of tails.
The output below is from a regression analysis in Stata. Unlike the example above, only the two-sided p-values are presented in this output.
Source | SS df MS Number of obs = 200 -------------+------------------------------ F( 2, 197) = 46.58 Model | 7363.62077 2 3681.81039 Prob > F = 0.0000 Residual | 15572.5742 197 79.0486001 R-squared = 0.3210 -------------+------------------------------ Adj R-squared = 0.3142 Total | 22936.195 199 115.257261 Root MSE = 8.8909 ------------------------------------------------------------------------------ socst | Coef. Std. Err. t P>|t| [95% Conf. Interval] -------------+---------------------------------------------------------------- science | .2191144 .0820323 2.67 0.008 .0573403 .3808885 math | .4778911 .0866945 5.51 0.000 .3069228 .6488594 _cons | 15.88534 3.850786 4.13 0.000 8.291287 23.47939 ------------------------------------------------------------------------------
For each regression coefficient, the tested null hypothesis is that the coefficient is equal to zero. Thus, the one-tailed alternatives are that the coefficient is greater than zero and that the coefficient is less than zero. To get the p-value for the one-tailed test of the variable science having a coefficient greater than zero, you would divide the .008 by 2, yielding .004 because the effect is going in the predicted direction. This is P(>2.67). If you had made your prediction in the other direction (the opposite direction of the model effect), the p-value would have been 1 – .004 = .996. This is P(<2.67). For all three p-values, the test statistic is 2.67.
Your Name (required)
Your Email (must be a valid email for us to receive the report!)
Comment/Error Report (required)
How to cite this page
- © 2021 UC REGENTS
- Key Differences
Know the Differences & Comparisons
Difference Between One-tailed and Two-tailed Test

To test the hypothesis, test statistics is required, which follows a known distribution. In a test, there are two divisions of probability density curve, i.e. region of acceptance and region of rejection. the region of rejection is called as a critical region .
In the field of research and experiments, it pays to know the difference between one-tailed and two-tailed test, as they are quite commonly used in the process.
Content: One-tailed Test Vs Two-tailed Test
Comparison chart, definition of one-tailed test.
One-tailed test alludes to the significance test in which the region of rejection appears on one end of the sampling distribution. It represents that the estimated test parameter is greater or less than the critical value. When the sample tested falls in the region of rejection, i.e. either left or right side, as the case may be, it leads to the acceptance of alternative hypothesis rather than the null hypothesis. It is primarily applied in chi-square distribution; that ascertains the goodness of fit.
In this statistical hypothesis test, all the critical region, related to α , is placed in any one of the two tails. One-tailed test can be:
- Left-tailed test : When the population parameter is believed to be lower than the assumed one, the hypothesis test carried out is the left-tailed test.
- Right-tailed test : When the population parameter is supposed to be greater than the assumed one, the statistical test conducted is a right-tailed test.
Definition of Two-tailed Test
The two-tailed test is described as a hypothesis test, in which the region of rejection or say the critical area is on both the ends of the normal distribution. It determines whether the sample tested falls within or outside a certain range of values. Therefore, an alternative hypothesis is accepted in place of the null hypothesis, if the calculated value falls in either of the two tails of the probability distribution.
In this test, α is bifurcated into two equal parts, placing half on each side, i.e. it considers the possibility of both positive and negative effects. It is performed to see, whether the estimated parameter is either above or below the assumed parameter, so the extreme values, work as evidence against the null hypothesis.
Key Differences Between One-tailed and Two-tailed Test
The fundamental differences between one-tailed and two-tailed test, is explained below in points:
- One-tailed test, as the name suggest is the statistical hypothesis test, in which the alternative hypothesis has a single end. On the other hand, two-tailed test implies the hypothesis test; wherein the alternative hypothesis has dual ends.
- In the one-tailed test, the alternative hypothesis is represented directionally. Conversely, the two-tailed test is a non-directional hypothesis test.
- In a one-tailed test, the region of rejection is either on the left or right of the sampling distribution. On the contrary, the region of rejection is on both the sides of the sampling distribution.
- A one-tailed test is used to ascertain if there is any relationship between variables in a single direction, i.e. left or right. As against this, the two-tailed test is used to identify whether or not there is any relationship between variables in either direction.
- In a one-tailed test, the test parameter calculated is more or less than the critical value. Unlike, two-tailed test, the result obtained is within or outside critical value.
- When an alternative hypothesis has ‘≠’ sign, then a two-tailed test is performed. In contrast, when an alternative hypothesis has ‘> or <‘ sign, then one-tailed test is carried out.
To sum up, we can say that the basic difference between one-tailed and two-tailed test lies in the direction, i.e. in case the research hypothesis entails the direction of interrelation or difference, then one-tailed test is applied, but if the research hypothesis does not signify the direction of interaction or difference, we use two-tailed test.
You Might Also Like:
Swati Aggarwal says
April 24, 2018 at 11:47 am
Very Informative and specifically summarised. thank you.
Aurobindo says
January 20, 2019 at 8:22 am
Amazing Surbhi. I recently started following this site and I really find it very very useful. The simplicity of language, the key distinctions, range of depth covered in giving the differences. Hats off to you for your effort. Very amazing. I have definitely bookmarked this website as ‘my favorite’ and I shall keep visiting it again and again. Keep it up. Thanks.
Marian Truehill says
July 23, 2020 at 11:48 pm
This website is very useful and easy to understand for Statistics methods and concepts.
Kuje Samson says
January 11, 2023 at 5:13 am
The website is very linear to a layman statistics. I really enjoyed visiting the site
Leave a Reply Cancel reply
Your email address will not be published. Required fields are marked *
Save my name, email, and website in this browser for the next time I comment.

- school Campus Bookshelves
- menu_book Bookshelves
- perm_media Learning Objects
- login Login
- how_to_reg Request Instructor Account
- hub Instructor Commons
- Download Page (PDF)
- Download Full Book (PDF)
- Periodic Table
- Physics Constants
- Scientific Calculator
- Reference & Cite
- Tools expand_more
- Readability
selected template will load here
This action is not available.
11.4: One- and Two-Tailed Tests
- Last updated
- Save as PDF
- Page ID 2148

- Rice University
Learning Objectives
- Define Type I and Type II errors
- Interpret significant and non-significant differences
- Explain why the null hypothesis should not be accepted when the effect is not significant
In the James Bond case study, Mr. Bond was given \(16\) trials on which he judged whether a martini had been shaken or stirred. He was correct on \(13\) of the trials. From the binomial distribution, we know that the probability of being correct \(13\) or more times out of \(16\) if one is only guessing is \(0.0106\). Figure \(\PageIndex{1}\) shows a graph of the binomial distribution. The red bars show the values greater than or equal to \(13\). As you can see in the figure, the probabilities are calculated for the upper tail of the distribution. A probability calculated in only one tail of the distribution is called a "one-tailed probability."
Binomial Calculator
A slightly different question can be asked of the data: "What is the probability of getting a result as extreme or more extreme than the one observed?" Since the chance expectation is \(8/16\), a result of \(3/16\) is equally as extreme as \(13/16\). Thus, to calculate this probability, we would consider both tails of the distribution. Since the binomial distribution is symmetric when \(\pi =0.5\), this probability is exactly double the probability of \(0.0106\) computed previously. Therefore, \(p = 0.0212\). A probability calculated in both tails of a distribution is called a "two-tailed probability" (see Figure \(\PageIndex{2}\)).
Should the one-tailed or the two-tailed probability be used to assess Mr. Bond's performance? That depends on the way the question is posed. If we are asking whether Mr. Bond can tell the difference between shaken or stirred martinis, then we would conclude he could if he performed either much better than chance or much worse than chance. If he performed much worse than chance, we would conclude that he can tell the difference, but he does not know which is which. Therefore, since we are going to reject the null hypothesis if Mr. Bond does either very well or very poorly, we will use a two-tailed probability.
On the other hand, if our question is whether Mr. Bond is better than chance at determining whether a martini is shaken or stirred, we would use a one-tailed probability. What would the one-tailed probability be if Mr. Bond were correct on only \(3\) of the \(16\) trials? Since the one-tailed probability is the probability of the right-hand tail, it would be the probability of getting \(3\) or more correct out of \(16\). This is a very high probability and the null hypothesis would not be rejected.
The null hypothesis for the two-tailed test is \(\pi =0.5\). By contrast, the null hypothesis for the one-tailed test is \(\pi \leq 0.5\). Accordingly, we reject the two-tailed hypothesis if the sample proportion deviates greatly from \(0.5\) in either direction. The one-tailed hypothesis is rejected only if the sample proportion is much greater than \(0.5\). The alternative hypothesis in the two-tailed test is \(\pi \neq 0.5\). In the one-tailed test it is \(\pi > 0.5\).
You should always decide whether you are going to use a one-tailed or a two-tailed probability before looking at the data. Statistical tests that compute one-tailed probabilities are called one-tailed tests; those that compute two-tailed probabilities are called two-tailed tests. Two-tailed tests are much more common than one-tailed tests in scientific research because an outcome signifying that something other than chance is operating is usually worth noting. One-tailed tests are appropriate when it is not important to distinguish between no effect and an effect in the unexpected direction. For example, consider an experiment designed to test the efficacy of a treatment for the common cold. The researcher would only be interested in whether the treatment was better than a placebo control. It would not be worth distinguishing between the case in which the treatment was worse than a placebo and the case in which it was the same because in both cases the drug would be worthless.
Some have argued that a one-tailed test is justified whenever the researcher predicts the direction of an effect. The problem with this argument is that if the effect comes out strongly in the non-predicted direction, the researcher is not justified in concluding that the effect is not zero. Since this is unrealistic, one-tailed tests are usually viewed skeptically if justified on this basis alone.
- Study Guides
- One- and Two-Tailed Tests
- Method of Statistical Inference
- Types of Statistics
- Steps in the Process
- Making Predictions
- Comparing Results
- Probability
- Quiz: Introduction to Statistics
- What Are Statistics?
- Quiz: Bar Chart
- Quiz: Pie Chart
- Introduction to Graphic Displays
- Quiz: Dot Plot
- Quiz: Introduction to Graphic Displays
- Frequency Histogram
- Relative Frequency Histogram
- Quiz: Relative Frequency Histogram
- Frequency Polygon
- Quiz: Frequency Polygon
- Frequency Distribution
- Stem-and-Leaf
- Box Plot (Box-and-Whiskers)
- Quiz: Box Plot (Box-and-Whiskers)
- Scatter Plot
- Measures of Central Tendency
- Quiz: Measures of Central Tendency
- Measures of Variability
- Quiz: Measures of Variability
- Measurement Scales
- Quiz: Introduction to Numerical Measures
- Classic Theory
- Relative Frequency Theory
- Probability of Simple Events
- Quiz: Probability of Simple Events
- Independent Events
- Dependent Events
- Introduction to Probability
- Quiz: Introduction to Probability
- Probability of Joint Occurrences
- Quiz: Probability of Joint Occurrences
- Non-Mutually-Exclusive Outcomes
- Quiz: Non-Mutually-Exclusive Outcomes
- Double-Counting
- Conditional Probability
- Quiz: Conditional Probability
- Probability Distributions
- Quiz: Probability Distributions
- The Binomial
- Quiz: The Binomial
- Quiz: Sampling Distributions
- Random and Systematic Error
- Central Limit Theorem
- Quiz: Central Limit Theorem
- Populations, Samples, Parameters, and Statistics
- Properties of the Normal Curve
- Quiz: Populations, Samples, Parameters, and Statistics
- Sampling Distributions
- Quiz: Properties of the Normal Curve
- Normal Approximation to the Binomial
- Quiz: Normal Approximation to the Binomial
- Quiz: Stating Hypotheses
- The Test Statistic
- Quiz: The Test Statistic
- Quiz: One- and Two-Tailed Tests
- Type I and II Errors
- Quiz: Type I and II Errors
- Stating Hypotheses
- Significance
- Quiz: Significance
- Point Estimates and Confidence Intervals
- Quiz: Point Estimates and Confidence Intervals
- Estimating a Difference Score
- Quiz: Estimating a Difference Score
- Univariate Tests: An Overview
- Quiz: Univariate Tests: An Overview
- One-Sample z-test
- Quiz: One-Sample z-test
- One-Sample t-test
- Quiz: One-Sample t-test
- Two-Sample z-test for Comparing Two Means
- Quiz: Introduction to Univariate Inferential Tests
- Quiz: Two-Sample z-test for Comparing Two Means
- Two Sample t test for Comparing Two Means
- Quiz: Two-Sample t-test for Comparing Two Means
- Paired Difference t-test
- Quiz: Paired Difference t-test
- Test for a Single Population Proportion
- Quiz: Test for a Single Population Proportion
- Test for Comparing Two Proportions
- Quiz: Test for Comparing Two Proportions
- Quiz: Simple Linear Regression
- Chi-Square (X2)
- Quiz: Chi-Square (X2)
- Correlation
- Quiz: Correlation
- Simple Linear Regression
- Common Mistakes
- Statistics Tables
- Quiz: Cumulative Review A
- Quiz: Cumulative Review B
- Statistics Quizzes
In the previous example, you tested a research hypothesis that predicted not only that the sample mean would be different from the population mean but that it would be different in a specific direction—it would be lower. This test is called a directional or one‐tailed test because the region of rejection is entirely within one tail of the distribution.
Some hypotheses predict only that one value will be different from another, without additionally predicting which will be higher. The test of such a hypothesis is nondirectional or two‐tailed because an extreme test statistic in either tail of the distribution (positive or negative) will lead to the rejection of the null hypothesis of no difference.
Suppose that you suspect that a particular class's performance on a proficiency test is not representative of those people who have taken the test. The national mean score on the test is 74.
The research hypothesis is:
The mean score of the class on the test is not 74.
Or in notation: H a : μ ≠ 74
The null hypothesis is:
The mean score of the class on the test is 74.
In notation: H 0 : μ = 74
As in the last example, you decide to use a 5 percent probability level for the test. Both tests have a region of rejection, then, of 5 percent, or 0.05. In this example, however, the rejection region must be split between both tails of the distribution—0.025 in the upper tail and 0.025 in the lower tail—because your hypothesis specifies only a difference, not a direction, as shown in Figure 1(a). You will reject the null hypotheses of no difference if the class sample mean is either much higher or much lower than the population mean of 74. In the previous example, only a sample mean much lower than the population mean would have led to the rejection of the null hypothesis.
Figure 1.Comparison of (a) a two‐tailed test and (b) a one‐tailed test, at the same probability level (95 percent).

The decision of whether to use a one‐ or a two‐tailed test is important because a test statistic that falls in the region of rejection in a one‐tailed test may not do so in a two‐tailed test, even though both tests use the same probability level. Suppose the class sample mean in your example was 77, and its corresponding z ‐score was computed to be 1.80. Table 2 in "Statistics Tables" shows the critical z ‐scores for a probability of 0.025 in either tail to be –1.96 and 1.96. In order to reject the null hypothesis, the test statistic must be either smaller than –1.96 or greater than 1.96. It is not, so you cannot reject the null hypothesis. Refer to Figure 1(a).
Suppose, however, you had a reason to expect that the class would perform better on the proficiency test than the population, and you did a one‐tailed test instead. For this test, the rejection region of 0.05 would be entirely within the upper tail. The critical z ‐value for a probability of 0.05 in the upper tail is 1.65. (Remember that Table 2 in "Statistics Tables" gives areas of the curve below z ; so you look up the z ‐value for a probability of 0.95.) Your computed test statistic of z = 1.80 exceeds the critical value and falls in the region of rejection, so you reject the null hypothesis and say that your suspicion that the class was better than the population was supported. See Figure 1(b).
In practice, you should use a one‐tailed test only when you have good reason to expect that the difference will be in a particular direction. A two‐tailed test is more conservative than a one‐tailed test because a two‐tailed test takes a more extreme test statistic to reject the null hypothesis.
Previous Quiz: The Test Statistic
Next Quiz: One- and Two-Tailed Tests
- Online Quizzes for CliffsNotes Statistics QuickReview, 2nd Edition
One-tailed and Two-tailed Tests
by Karen Grace-Martin 30 Comments
I was recently asked about when to use one and two tailed tests.
The long answer is: Use one tailed tests when you have a specific hypothesis about the direction of your relationship. Some examples include you hypothesize that one group mean is larger than the other; you hypothesize that the correlation is positive; you hypothesize that the proportion is below .5.
The short answer is: Never use one tailed tests.
1. Only a few statistical tests even can have one tail: z tests and t tests. So you’re severely limited. F tests, Chi-square tests , etc. can’t accommodate one-tailed tests because their distributions are not symmetric. Most statistical methods, such as regression and ANOVA , are based on these tests, so you will rarely have the chance to implement them.
2. Probably because they are rare, reviewers balk at one-tailed tests. They tend to assume that you are trying to artificially boost the power of your test. Theoretically, however, there is nothing wrong with them when the hypothesis and the statistical test are right for them.
Reader Interactions

June 10, 2022 at 5:48 am
Dear Karen,
I am running a regression analysis, I wonder if the significance in table output for ANOVA is inherently one-tailed or two-tailed? I have a directional hypothesis, so I am wondering if I still have to divide the significance value? Thank you in advance!

June 15, 2022 at 11:08 am
It’s two-tailed. And the F tests cannot be made directional.

October 9, 2019 at 7:46 pm
Say for example I am testing a hypothesis at .05 and it is a one tailed test. I expect the treatment to have a decrease and the cut off for significance is t = -1.67 so this is a left tail test. If t value after I run the test is +2.24 is this non significant since it is not in the hypothesized direction (negative)?

August 30, 2019 at 2:13 am
does a one-tailed test always require a one-sided (directional) hypothesis, and does a two-tailed test always require a two-sided (nondirectional) hypothesis?
Asked in the other direction: Does a one-sided (directional) hypothesis always require a one-sided test, and does a two-sided (nondirectional) hypothesis always require a two-sided test?
Thanks for clarifying Claudia
September 3, 2019 at 10:11 am
Hi Claudia,
Good question. So technically, when I am talking about one-tailed test, I do mean a test of a directional hypothesis. Likewise, I mean a non-directional hypothesis when I say two-tailed test.
In z-tests and t-tests, which are symmetric distributions, these terms are indeed interchangeable. But it definitely gets more complicated once you start talking about Chi-square tests and F-tests. Both of these have 0 at the left end and all high values of the statistic in one tail. So you can’t distinguish directions for these kinds of test statistics. So you can only test nondirectional hypotheses.

May 1, 2019 at 2:30 am
I have seen textbooks reporting confidence intervals of a standard deviation using low and high values of the chi-square statistic. Is it not based on a two-sided test?

August 28, 2018 at 7:14 am
There is no need to have a specific directional hypothesis (although you would usually have one), all that is needed to justify is to have a directional claim. Most claims in published scientific research and applied research are directional, since the moment you say the difference is positive or negative you have a directional claim. The only way to avoid it is to not mention the observed difference, or to state the difference as “plus or minus X” which would be ridiculous in most contexts.
Also, you should not mistake the tailed-ness of a statistical distribution with the tailed-ness of a hypothesis. While the Chi-Square or F-distribution might only have one tail, they can still be used for inference of one-sided and two-sided hypothesis alike. One can go as far back as Fisher and find examples of that (Statistical Methods for Research Workers).
If you are interested in more detailed arguments for the use of one-sided tests see the series of articles on The One-Sided Project website at https://www.onesided.org/ .

March 2, 2018 at 1:07 am
Hello, Good Morning to all, I am working on a project of Behavior Based Safety thesis work in which I have to assess data by SPSS software. Can any one could help me because i haven’t any idea about this software
May 17, 2018 at 10:06 am
Hi Muhammad, We have a number of free resources on SPSS, but if you’re in the middle of a project we have an on-demand tutorial that will get you not just started, but able to use it: http://theanalysisinstitute.com/introspss/

August 24, 2016 at 12:08 pm
Thank you for the discussions about the power for one-sided test. I agree that we should be careful when we decide to use a one-sided test. For Chi-square test when comparing two proportions, we can use two approaches: normal-theory method (the z-test) and contingency-table approach (the Chi-square test). For the normal-theory test, it requires a large sample size with n>5 or n*proportion >10. If your proposed study satisfied this requirement, we can use normal-theory method which is z-test to compute the power for the one-sided test. If you are interested in how to compute the one-sided test power, you can refer to the textbook by Marcello Pagano and Kimberlee Gauvreau’s 2nd edition titled “Principles of Biostatistics” section 14.5 on page 330 regarding sample size estimation for one-sided hypothesis test for proportions. Thanks.

September 1, 2015 at 2:30 am
Chi-squared tests are ALWAYS one-tailed… You only reject the null hypothesis when the test statistic falls into the right tail of the chi-square distribution.
What chi-squared tests are generally NOT is “directional”. They generally do not test whether the observed values are greater than or smaller than expected, only that they differ significantly.

January 26, 2016 at 10:57 pm
If “Chi-squared tests are ALWAYS one-tailed…”, why is Karen saying in her above statement that “F tests, Chi-square tests, etc. can’t accommodate one-tailed tests”?
Sorry, but I am bit confused. Can you help?
January 27, 2016 at 11:30 am
Hi Dippies,
Perhaps better wording is “F tests, Chi-square tests, etc. can’t accommodate directional tests.” Because there is only one tail for these distributions in which to find significance, it can’t distinguish between non-directional tests (eg, H1: mu1 – mu2 not equal to 0) and directional tests (eg, H1: mu1-mu2 greater than 0). In a t-test or z-test, we can either split alpha between two tails for a non-directional test or put alpha all into one tail for a directional test. We can then see whether we’re in the right tail based on the sign of the test statistic. F’s and Chi-sq values are squared. So they’re always positive. You get the same F value regardless of the direction of the means.

October 19, 2017 at 10:29 am
Thanks for the explanation… I am wondering: what happens if I have two methods, m1 and m2, and I want to show that m1 performs better (e.g. gives a higher value) than m2? Should I still use a two-tailed test? How can I show that m1 is, in fact, better (and not just different) than m2 (assuming the test proves significant)? Thanks for any comments.

July 22, 2015 at 6:14 pm
My hypothesis says there is a positive relation between religiosity and altruistic behavior. Would a two-tailed approach using Pearson Correlation do the trick?
Some very helpful information available here! Thank you.

July 1, 2015 at 2:50 am
Hi Karen, I run paired sample t-test and it just has P-two tailed. So how to convert P-two tailed to t critical one tailed. I have t critical two tailed and df already. Thanks so much

March 20, 2015 at 2:41 pm
I have used a one-tailed test but the effect went into the opposite direction. How do I have to calculate my p-Value now. Thanks for your reply, Mirco

February 3, 2015 at 10:24 pm
F-tests are almost always one-tailed. You would convert a two-tailed test’s p-value into a one-tailed test’s p-value by *halving* the p-value, not multiplying by 2 (as recommended above).
February 6, 2015 at 5:05 pm
Thanks, Paul. Yes. I fixed the half.
While it’s true that F-tests are one-tailed, they’re not testing directional hypotheses, the way a one-tailed t or z test does.

October 29, 2014 at 11:15 pm
I trying to complete the results of my study and need to know how to convert my 1-tailed results to 2-tailed? The company that ran my stats used a 1-tailed instead of 2-tailed, which as I understand is what I should have used to show directionality. Nicole
November 3, 2014 at 4:41 pm
Hi Nicole, just double them.

September 26, 2014 at 8:13 am
Very interesting. I am reading a much celebrated book (The weakness of Civil Society in Post-Communist Europe, by Marc Howard, 2003) in polticial science at the moment containing regression analysis with one tailed coeficients. This, togheter with that they only have a N of 23 (with 5 independent variables), raise my eyebrows. The results are also quite controversial….
What would you off-hand say about that?
September 26, 2014 at 12:27 pm
Without knowing anything else, the one tailed tests of coefficients wouldn’t worry me too much except for the fact you said it’s controversial. Which means perhaps the opposite result is reasonable.
The N of 23 is more of a concern. That’s pretty small. I find results like this are not bad per se. It’s fine to consider as one possible piece of information–they are great for spurring more research. But you can’t make any conclusions based on them.

June 14, 2013 at 9:54 pm
Jst wanna thank you for your post ; it will save me on my exam tomorrow (y)
& in my course it is not always divided by 2 (p-value). It depends on the value of your t (,= 0) & if your H1:’value” is > or 0, Hasard ?
Even if i’m wrong, I want to thank you again !

January 2, 2013 at 8:16 am
how can we calculate p-value of one-tailed from two-tailed hypothesis in spss?
January 2, 2013 at 10:50 am
All you have to do is divide it by 2.

December 1, 2012 at 11:04 am
i found this issue more important please continue in such way. kind regards, nurilign.

August 27, 2010 at 12:59 pm
Thank you so much for your reply and offer to try a find a source regarding the limited utility of one-tailed tests when doing ANOVAs and regressions, as well as the advice for converting two-tailed tests to one-tailed tests.
The only problem I have is that the Pearson Correlation Coefficient output from my stats consultant does not contain the p value. In order to calculate the p value for a two-tailed test, I thought it might be possible to take the df (n-2 for two-tailed tests) and look up the significance level in the table of critical values of the correlation coefficient. Once I get those values, I would simply divide by 2 to get the one-tailed level of significance. Do you think that is a statistically sound procedure.
Thank you again for your assistance, Sue
August 25, 2010 at 11:29 am
I am currently working on my dissertation and one of my committee members suggested that I should have used a one-tailed test as I have a directional hypothesis, but I think that a two-tailed test is just as appropriate based on several of the reasons listed on the blog.
I was particularly intrigued by the statement that “F tests, chi-square tests, etc. can’t accommodate one-tailed tests because their distributions are not symmetric.” This would make a fine argument for not re-rerunning my data and was wondering if there is a reference or citation for that point. I have not been able to find that point in any of the stats texts that I own. Any help would be greatly appreciated!
August 26, 2010 at 7:23 pm
Hi Sue, Hmmm. I would think that texts that talk about the F-test would mention that it's not symmetric. You could certainly use any text that states that t-squared=F. But I'll see if I can find something that says it directly. But in any case, you don't have to rerun anything, even if you weren't using F tests. To get a one-sided p-value, just halve the two-sided p-value you have. Karen
Leave a Reply Cancel reply
Your email address will not be published. Required fields are marked *
Privacy Overview
If you're seeing this message, it means we're having trouble loading external resources on our website.
If you're behind a web filter, please make sure that the domains *.kastatic.org and *.kasandbox.org are unblocked.
To log in and use all the features of Khan Academy, please enable JavaScript in your browser.
Statistics and probability
Course: statistics and probability > unit 12.
- Hypothesis testing and p-values
One-tailed and two-tailed tests
- Z-statistics vs. T-statistics
- Small sample hypothesis test
- Large sample proportion hypothesis testing
Want to join the conversation?
- Upvote Button navigates to signup page
- Downvote Button navigates to signup page
- Flag Button navigates to signup page

Video transcript

One-Tailed vs Two-Tailed Tests; What You Should Know
Understanding the different methods of hypothesis testing is crucial for accurate data interpretation. Among these methods, one-tailed and two-tailed tests stand out due to their specific applications and implications.
This article discusses one-tailed vs two-tailed tests, their examples, scenarios where each test is applicable, and the pros and cons associated with one-tailed and two-tailed tests.
What is a One-Tailed Test?
One-tailed tests are used when a hypothesis predicts a specific direction of effect. They are ideal for scenarios where the interest lies in determining whether a parameter is significantly greater or less than a specific value.
This type of test evaluates whether the observed data deviates significantly from the null hypothesis (the hypothesis of no effect or no difference) but only in the specified direction.
In the context of A/B testing , a one-tailed test is used to determine if there is a significant difference in a specific direction between two webpage versions, products, or strategies.
For example, if you conduct an A/B test to see if a new website design leads to higher user engagement compared to the current design, a one-tailed test would be used to assess if the new design increases engagement specifically, ignoring the possibility of a decrease.
This focused approach makes one-tailed tests suitable for scenarios where you expect a directional and clearly defined outcome.
Example of a One-Tailed Test in A/B Testing:
Suppose an e-commerce company wants to increase its website’s conversion rate . The CRO team they hired hypothesizes that changing the color of the “Add to Cart” button from blue to red will lead to more clicks and, consequently, more purchases. To test this hypothesis, they set up an A/B test:
Version A (Control): The original webpage with the blue “Add to Cart” button.
Version B (Variant): The same webpage but with the red “Add to Cart” button.
The hypothesis predicts the red button will increase conversions. The null hypothesis (H0) states there will be no increase, or possibly a decrease, in conversions with the red button.
A one-tailed test checks for increased conversions with the red button. If the test shows statistical significance, it supports the hypothesis that the red button performs better. If not, there’s insufficient evidence to reject the null hypothesis, meaning the increase isn’t statistically significant.
Pros of one-tailed tests
Increased power.
One-tailed tests have more statistical power compared to two-tailed tests when testing the same hypothesis. They focus all statistical power in one direction of the distribution (the direction of interest), making it more likely to detect an effect in that direction.
Lower Sample Size Requirement
Due to its increased power, a one-tailed test often requires a smaller sample size to achieve the same level of statistical significance as a two-tailed test. This is a significant advantage in practical scenarios where collecting large samples can be time-consuming or expensive.
Specific Hypothesis Testing
One-tailed tests are tailored for specific, directional hypotheses. This means they are ideal when the hypothesis makes a specific prediction about the direction of the effect. For example, if a hypothesis states that a new marketing strategy will increase sales, a one-tailed test is appropriate because it specifically looks for an increase in sales.
Cons of one-tailed tests
Risk of missing opposite effect.
One of the main drawbacks of a one-tailed test is the risk of missing a significant effect in the opposite direction of the hypothesis. Since the test is designed to detect an effect in one specific direction, it may overlook meaningful changes that occur in the other direction.
Choosing a one-tailed test, especially after data collection, poses a risk of bias. Decisions should be based on strong theoretical grounds or prior evidence, not on a desire to achieve significant results.
Limited Insight
One-tailed tests provide less comprehensive insight compared to two-tailed tests. By focusing only on one direction, they may miss out on understanding the full spectrum of the effect being studied.
What is a Two-Tailed Test?
A two-tailed test is a statistical method used when the direction of the effect is not specified in the hypothesis; unlike a one-tailed test that looks for a significant effect in one specific direction, a two-tailed test checks for significance in both directions.
This type of test is useful when you are interested in detecting any significant difference, regardless of whether it is positive or negative.
A/B testing uses a two-tailed test to determine whether a statistically significant difference exists between two versions (A and B) without a predetermined direction of the expected outcome.
This approach is crucial when the goal is to ascertain any significant change, whether an increase or a decrease, in a key metric due to variations in the test.
For instance, a two-tailed test is appropriate if you test two different website layouts to see which one performs better in terms of user engagement without a specific hypothesis about which layout will be superior.
Example of a Two-Tailed Test in A/B Testing:
The same ecommerce company wants to evaluate the impact of a new product description format on its website. The company is unsure whether the new format will increase or decrease customer engagement, so they conducted an A/B test again.
Version A (Control) : The original product page with the standard description format.
Version B (Variant): The same product page but with the new description format.
The hypothesis is: “The new format will significantly impact engagement,” without specifying the direction of this impact.
A two-tailed test is chosen to detect any significant change in engagement, whether an increase or decrease. It assesses if the new format leads to a statistically significant difference in engagement compared to the control.
If the test shows significance, it confirms the new format notably affects engagement, but further analysis is required to determine if the effect is positive or negative.
Pros of two-tailed tests
Detects effects in both directions.
The primary advantage of a two-tailed test is its ability to detect statistically significant effects in both directions. This means it can identify whether the tested variable has a positive or negative impact compared to the control.
More Conservative
A two-tailed test is considered more conservative than a one-tailed test because it divides the significance level across both ends of the distribution. This means that for a result to be considered statistically significant, it must meet a stricter criterion compared to a one-tailed test.
Cons of two-tailed tests
Reduced power.
One of the main drawbacks of a two-tailed test is its reduced statistical power compared to a one-tailed test. The power of a statistical test is its ability to detect an effect when there is one. In a two-tailed test, because the significance level is split between both tails of the distribution, it requires a stronger effect to reach statistical significance .
Larger Sample Size Needed
Due to its reduced power, a two-tailed test often requires a larger sample size to achieve the same level of statistical significance as a one-tailed test. This can be a significant challenge in research scenarios where gathering a large amount of data is difficult, time-consuming, or expensive.
Overly General
In A/B testing, a two-tailed test can be overly general when there’s already a strong theory predicting the direction of an effect. It checks for changes in both directions, which may not be necessary if you only expect an increase or decrease.
One-Tailed vs Two-Tailed Tests: Which Should You Choose?
When deciding between a one-tailed and a two-tailed test in A/B testing, the choice hinges on your hypothesis and what you aim to discover or prove. Both tests have their place, but their applicability depends on the specific context of your research question.
Understanding the differences between these tests, their applications, and their implications is vital for accurate data interpretation and effective decision-making in various testing scenarios.

Related Posts

25 Call To Action Examples For Your Website
Avoiding False Positives: Minimizing Type I Errors in Conversion Optimization
- Session Recordings
- Knowledge Base
Type above and press Enter to search. Press Esc to cancel.
- The Open University
- Guest user / Sign out
- Study with The Open University
My OpenLearn Profile
Personalise your OpenLearn profile, save your favourite content and get recognition for your learning
About this free course
Become an ou student, download this course, share this free course.

Start this free course now. Just create an account and sign in. Enrol and complete the course for a free statement of participation or digital badge if available.
4 One-tailed vs two-tailed test
To gain a deeper understanding of how to conduct a hypothesis test, this section will delve into the concepts of one-tailed and two-tailed tests. These tests are vital tools in statistical hypothesis testing, and the decision of which test to employ depends on the research question and hypothesis under examination. It is crucial to give careful thought to the suitable type of test to ensure that the hypothesis is thoroughly tested and precise conclusions are derived from the data. This section will elaborate on this topic in greater detail.
To commence, complete the following activity pertaining to the formulation of null and alternative hypotheses. This exercise may be somewhat challenging, but it serves as an excellent introduction to upcoming discussions – don’t be concerned if you find it difficult!
Activity 3 Hypotheses setting
Read the following statements and then develop a null hypothesis and an alternative hypothesis.
‘It is believed that OU students need to set aside no longer than, on average, 15 hours to study an entire session of an OU course. However, a researcher believes that OU students spend longer studying an entire session of an OU course.’
H 0 : OU students spend, on average, no more than 15 hours studying an entire session of OU course.
H a : OU students spend, on average, more than 15 hours studying an entire session of OU course.
They can also be written as:
H 0 : µ ≤ 15 hours studies
H a : µ > 15 hours studies
µ is a symbol for a population mean. Remember, H 0 and H a are always opposites.
Did you identify any differences between the hypotheses you developed in Activity 1 and Activity 3? The set of hypotheses in Activity 1 has an equal (=) or not equal (≠) supposition (sign) in the statement. However, in Activity 3, the set of hypotheses has less than or equal to (≤) and greater than (>) supposition (sign) in the statement. This creates different conditions that lead to acceptance or rejection of the null hypothesis.
- Statistics with Python
- Data Analysis Tutorial
- Python – Data visualization tutorial
- Machine Learning Projects
- Machine Learning Interview Questions
- Machine Learning Mathematics
- Deep Learning Tutorial
- Deep Learning Project
- Deep Learning Interview Questions
- Computer Vision Tutorial
- Computer Vision Projects
- NLP Project
- NLP Interview Questions
- 100 Days of Machine Learning
- Difference Between Business Analytics and Predictive Analytics
- Difference between Google Jamboard and Microsoft Whiteboard
- Difference Between GAGAN and GPS
- Difference Between Latency and Throughput
- Difference Between Google Analytics and Piwik
- Difference Between Google and Wikipedia
- Difference between scaling horizontally and vertically for databases
- Flutter vs Flutter 2
- Difference between Paper and Article for Scientific Writings
- Difference between CIFS vs SMB
- Differences between Software Testing and Quality Assurance
- Difference between Website and Blog
- Difference Between DOS and Windows
- Bitcoin vs Litecoin - What's the Difference?
- Differences between Low-Code and No-Code Development
- Difference Between VLAN and VPN
- Difference Between Cloudflare and CloudFront
- Differences between System Analysis and System Design
- Difference between Research Papers and Technical Articles for Journal Publication
Difference Between One-Tailed and Two-Tailed Tests
One and Two-Tailed Tests are ways to identify the relationship between the statistical variables. For checking the relationship between variables in a single direction (Left or Right direction), we use a one-tailed test. A two-tailed test is used to check whether the relations between variables are in any direction or not.
One-Tailed Test
A one-tailed test is based on a uni-directional hypothesis where the area of rejection is on only one side of the sampling distribution. It determines whether a particular population parameter is larger or smaller than the predefined parameter. It uses one single critical value to test the data.

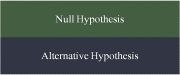
Alternative Hypothesis ( H 1):

Test Statistic: Depending on the type of test and the distribution, the test statistic is computed ( Z -score for normal distribution).
Decision Rule: If the test statistic falls in the critical region, reject the null hypothesis in favor of the alternative hypothesis.
Example: Effect of participants of students in coding competition on their fear level.
- H0: There is no important effect of students in coding competition on their fear level.
The main intention is to check the decreased fear level when students participate in a coding competition.
Two-Tailed Test
A two-tailed test is also called a nondirectional hypothesis. For checking whether the sample is greater or less than a range of values, we use the two-tailed. It is used for null hypothesis testing.

Test Statistic: Compute the test statistic as appropriate for the distribution ( Z -score for normal distribution).
Decision Rule: If the test statistic falls in either tail of the distribution’s critical region, reject the null hypothesis in favor of the alternative hypothesis.
Example: Effect of new bill pass on the loan of farmers.
- H0: There is no significant effect of the new bill passed on loans of farmers.
New bill passes can affect in both ways either increase or decrease the loan of farmers.
Difference Between One and Two-Tailed Test:
Please Login to comment...
Similar reads.
- ML-Statistics
- Difference Between
- Google Releases ‘Prompting Guide’ With Tips For Gemini In Workspace
- Google Cloud Next 24 | Gmail Voice Input, Gemini for Google Chat, Meet ‘Translate for me,’ & More
- 10 Best Viber Alternatives for Better Communication
- 12 Best Database Management Software in 2024
- 30 OOPs Interview Questions and Answers (2024)
Improve your Coding Skills with Practice
What kind of Experience do you want to share?
Biostatistics
- Data Science
- Programming
- Social Science
- Certificates
- Undergraduate
- For Businesses
- FAQs and Knowledge Base
Test Yourself
- Instructors
2-Tailed vs. 1-Tailed Tests
2-Tailed vs. 1-Tailed Tests:
The purpose of a hypothesis test is to avoid being fooled by chance occurrences into thinking that the effect you are investigating (for example, a difference between treatment and control) is real. If you are investigating, say, the difference between an existing process and a (hopefully improved) new process, observed results that don´t show an improvement would not interest you so you do not need to protect yourself against being fooled by “negative” effects, no matter how extreme. A 1-tailed test would be appropriate. If, on the other hand, you are interested in discerning a difference between samples A and B (regardless of which direction the direction goes), a 2-tailed test would be appropriate.
Browse Other Glossary Entries
Planning on taking an introductory statistics course, but not sure if you need to start at the beginning? Review the course description for each of our introductory statistics courses and estimate which best matches your level, then take the self test for that course. If you get all or almost all the questions correct, move on and take the next test.
Data Analytics
Considering becoming adata scientist, customer analyst or our data science certificate program?
Advanced Statistics Quiz
Looking at statistics for graduate programs or to enhance your foundational knowledge?
Regression Quiz
Entering the biostatistics field? Test your skill here.
Stay Informed
Read up on our latest blogs
Learn about our certificate programs
Find the right course for you
We'd love to answer your questions
Our mentors and academic advisors are standing by to help guide you towards the courses or program that makes the most sense for you and your goals.
300 W Main St STE 301, Charlottesville, VA 22903
(434) 973-7673
By submitting your information, you agree to receive email communications from Statistics.com. All information submitted is subject to our privacy policy . You may opt out of receiving communications at any time.
- Search Search Please fill out this field.
What Is a One-Tailed Test?
- Determining Significance
- One-Tailed Test FAQs
- Corporate Finance
- Financial Analysis
One-Tailed Test Explained: Definition and Example
:max_bytes(150000):strip_icc():format(webp)/wk_headshot_aug_2018_02__william_kenton-5bfc261446e0fb005118afc9.jpg "difference between 1 tailed and 2 tailed hypothesis")
Investopedia / Xiaojie Liu
A one-tailed test is a statistical test in which the critical area of a distribution is one-sided so that it is either greater than or less than a certain value, but not both. If the sample being tested falls into the one-sided critical area, the alternative hypothesis will be accepted instead of the null hypothesis.
Financial analysts use the one-tailed test to test an investment or portfolio hypothesis.
Key Takeaways
- A one-tailed test is a statistical hypothesis test set up to show that the sample mean would be higher or lower than the population mean, but not both.
- When using a one-tailed test, the analyst is testing for the possibility of the relationship in one direction of interest and completely disregarding the possibility of a relationship in another direction.
- Before running a one-tailed test, the analyst must set up a null and alternative hypothesis and establish a probability value (p-value).
A basic concept in inferential statistics is hypothesis testing . Hypothesis testing is run to determine whether a claim is true or not, given a population parameter. A test that is conducted to show whether the mean of the sample is significantly greater than and significantly less than the mean of a population is considered a two-tailed test . When the testing is set up to show that the sample mean would be higher or lower than the population mean, it is referred to as a one-tailed test. The one-tailed test gets its name from testing the area under one of the tails (sides) of a normal distribution , although the test can be used in other non-normal distributions.
Before the one-tailed test can be performed, null and alternative hypotheses must be established. A null hypothesis is a claim that the researcher hopes to reject. An alternative hypothesis is the claim supported by rejecting the null hypothesis.
A one-tailed test is also known as a directional hypothesis or directional test.
Example of the One-Tailed Test
Let's say an analyst wants to prove that a portfolio manager outperformed the S&P 500 index in a given year by 16.91%. They may set up the null (H 0 ) and alternative (H a ) hypotheses as:
H 0 : μ ≤ 16.91
H a : μ > 16.91
The null hypothesis is the measurement that the analyst hopes to reject. The alternative hypothesis is the claim made by the analyst that the portfolio manager performed better than the S&P 500. If the outcome of the one-tailed test results in rejecting the null, the alternative hypothesis will be supported. On the other hand, if the outcome of the test fails to reject the null, the analyst may carry out further analysis and investigation into the portfolio manager’s performance.
The region of rejection is on only one side of the sampling distribution in a one-tailed test. To determine how the portfolio’s return on investment compares to the market index, the analyst must run an upper-tailed significance test in which extreme values fall in the upper tail (right side) of the normal distribution curve. The one-tailed test conducted in the upper or right tail area of the curve will show the analyst how much higher the portfolio return is than the index return and whether the difference is significant.
1%, 5% or 10%
The most common significance levels (p-values) used in a one-tailed test.
Determining Significance in a One-Tailed Test
To determine how significant the difference in returns is, a significance level must be specified. The significance level is almost always represented by the letter p, which stands for probability. The level of significance is the probability of incorrectly concluding that the null hypothesis is false. The significance value used in a one-tailed test is either 1%, 5%, or 10%, although any other probability measurement can be used at the discretion of the analyst or statistician. The probability value is calculated with the assumption that the null hypothesis is true. The lower the p-value , the stronger the evidence that the null hypothesis is false.
If the resulting p-value is less than 5%, the difference between both observations is statistically significant, and the null hypothesis is rejected. Following our example above, if the p-value = 0.03, or 3%, then the analyst can be 97% confident that the portfolio returns did not equal or fall below the return of the market for the year. They will, therefore, reject H 0 and support the claim that the portfolio manager outperformed the index. The probability calculated in only one tail of a distribution is half the probability of a two-tailed distribution if similar measurements were tested using both hypothesis testing tools.
When using a one-tailed test, the analyst is testing for the possibility of the relationship in one direction of interest and completely disregarding the possibility of a relationship in another direction. Using our example above, the analyst is interested in whether a portfolio’s return is greater than the market’s. In this case, they do not need to statistically account for a situation in which the portfolio manager underperformed the S&P 500 index. For this reason, a one-tailed test is only appropriate when it is not important to test the outcome at the other end of a distribution.
How Do You Determine If It Is a One-Tailed or Two-Tailed Test?
A one-tailed test looks for an increase or decrease in a parameter. A two-tailed test looks for change, which could be a decrease or an increase.
What Is a One-Tailed T Test Used for?
A one-tailed T-test checks for the possibility of a one-direction relationship but does not consider a directional relationship in another direction.
When Should a Two-Tailed Test Be Used?
You would use a two-tailed test when you want to test your hypothesis in both directions.
University of Southern California. " FAQ: What Are the Differences Between One-Tailed and Two-Tailed Tests? "
:max_bytes(150000):strip_icc():format(webp)/z-test.asp-final-81378e9e20704163ba30aad511c16e5d.jpg "difference between 1 tailed and 2 tailed hypothesis")
- Terms of Service
- Editorial Policy
- Privacy Policy
- Your Privacy Choices
IMAGES
VIDEO
COMMENTS
Two-tailed hypothesis tests are also known as nondirectional and two-sided tests because you can test for effects in both directions. When you perform a two-tailed test, you split the significance level percentage between both tails of the distribution. In the example below, I use an alpha of 5% and the distribution has two shaded regions of 2. ...
So, depending on the direction of the one-tailed hypothesis, its p-value is either .5*(two-tailed p-value) or 1-.5*(two-tailed p-value) if the test statistic symmetrically distributed about zero. In this example, the two-tailed p-value suggests rejecting the null hypothesis of no difference.
The main difference between one-tailed and two-tailed test lies in the direction, i.e. in case the research hypothesis entails the direction of interrelation or difference, then one-tailed test is applied, but if the research hypothesis does not signifies the direction of interaction or difference, we use two-tailed test. d test.
The two red tails are the alpha level, divided by two (i.e. α/2). Alpha levels (sometimes just called "significance levels") are used in hypothesis tests; it is the probability of making the wrong decision when the null hypothesis is true. A one-tailed test has the entire 5% of the alpha level in one tail (in either the left, or the right tail).
In coin flipping, the null hypothesis is a sequence of Bernoulli trials with probability 0.5, yielding a random variable X which is 1 for heads and 0 for tails, and a common test statistic is the sample mean (of the number of heads) ¯. If testing for whether the coin is biased towards heads, a one-tailed test would be used - only large numbers of heads would be significant.
At this point, you might use a statistical test, like unpaired or 2-sample t-test, to see if there's a significant difference between the two groups' means. Typically, an unpaired t-test starts with two hypotheses. The first hypothesis is called the null hypothesis, and it basically says there's no difference in the means of the two groups.
The one-tailed hypothesis is rejected only if the sample proportion is much greater than \(0.5\). The alternative hypothesis in the two-tailed test is \(\pi \neq 0.5\). In the one-tailed test it is \(\pi > 0.5\). You should always decide whether you are going to use a one-tailed or a two-tailed probability before looking at the data.
Table 2 in "Statistics Tables" shows the critical z‐scores for a probability of 0.025 in either tail to be -1.96 and 1.96. In order to reject the null hypothesis, the test statistic must be either smaller than -1.96 or greater than 1.96. It is not, so you cannot reject the null hypothesis. Refer to Figure 1(a).
The long answer is: Use one tailed tests when you have a specific hypothesis about the direction of your relationship. Some examples include you hypothesize that one group mean is larger than the other; you hypothesize that the correlation is positive; you hypothesize that the proportion is below .5. The short answer is: Never use one tailed tests.
A one tailed test does not leave more room to conclude that the alternative hypothesis is true. The benefit (increased certainty) of a one tailed test doesn't come free, as the analyst must know "something more", which is the direction of the effect, compared to a two tailed test. ( 3 votes)
This statistics video tutorial explains when you should use a one tailed test vs a two tailed test when solving problems associated with hypothesis testing. ...
Increased Power. One-tailed tests have more statistical power compared to two-tailed tests when testing the same hypothesis. They focus all statistical power in one direction of the distribution (the direction of interest), making it more likely to detect an effect in that direction. Lower Sample Size Requirement.
Most articles, posts and videos on hypotheses testing mention 2 types of tests (named 1-tailed and 2-tailed) (see, for example, , , ). Many articles explain in detail the difference between these ...
4 One-tailed vs two-tailed test. To gain a deeper understanding of how to conduct a hypothesis test, this section will delve into the concepts of one-tailed and two-tailed tests. These tests are vital tools in statistical hypothesis testing, and the decision of which test to employ depends on the research question and hypothesis under examination.
According to Kyle Rush, it does: "The benefit to using a one-tailed test is that it requires fewer subjects to reach significance. A two-tailed test splits your significance level and applies it in both directions. Thus, each direction is only half as strong as a one-tailed test, which puts all the significance in one direction.
For checking the relationship between variables in a single direction (Left or Right direction), we use a one-tailed test. A two-tailed test is used to check whether the relations between variables are in any direction or not. One-Tailed Test. A one-tailed test is based on a uni-directional hypothesis where the area of rejection is on only one ...
A two-tailed test is appropriate if you want to determine if there is any difference between the groups you are comparing. For instance, if you want to see if Group A scored higher or lower than Group B, then you would want to use a two-tailed test. This is because a two-tailed test uses both the positive and negative tails of the distribution.
A two tailed test tests for a difference in either direction. Thus the P value would be the area under the t distribution to the right of t=1.92 PLUS the area under the distribution to the left of t=-1.92. That's twice as much area as the one-tailed test and so the P value is twice as large. If you use a one tailed test you gain power, but at ...
2-Tailed vs. 1-Tailed Tests: The purpose of a hypothesis test is to avoid being fooled by chance occurrences into thinking that the effect you are investigating (for example, a difference between treatment and control) is real. If you are investigating, say, the difference between an existing process and a (hopefully improved) new process, observed resultsContinue reading "2-Tailed vs. 1 ...
One-Tailed Test: A one-tailed test is a statistical test in which the critical area of a distribution is one-sided so that it is either greater than or less than a certain value, but not both. If ...
A one tailed hypothesis, or directional hypothesis, predicts the actual DIRECTION in which the findings will go.It is more precise, and usually used when other research has been carried out previously, giving us a good idea of which way the results will go eg we predict more or less, an increase or decrease, higher or lowerA two-tailed hypothesis, or non-directional hypothesis, predicts an ...