The gender pay gap
- Research Briefing
- Work and incomes
- Brigid Francis-Devine
- Patrick Brione
This briefing paper provides statistics on the size of the gender pay gap in the UK and how it varies by factors such as age, occupation and location.

Documents to download
The gender pay gap (590 KB , PDF)
Supporting documents
- Data tables Data tables (29 KB , Excel Spreadsheet ) (29 KB , Excel Spreadsheet)
The gender pay gap measures the difference between average (median) hourly earnings of men and women, usually shown by the percentage men earn more than women.
Note that figures for 2020 especially, but also 2021, should be treated with some caution. Some people were on furlough with reduced pay and figures for 2020 were particularly affected by disruptions to the collection of data from businesses.
How big is the gender pay gap?
According to the Office for National Statistics (ONS), median hourly pay for full-time employees was 7.7% less for women than for men in April 2023, while median hourly pay for part-time employees was 3.3% higher for women than for men (figures exclude overtime pay). The median is the point at which half of employees earn more and half earn less. It is regarded a better measure of pay of the ‘typical’ employee than taking an average.
Because a larger proportion of women are employed part-time, and part-time workers tend to earn less per hour, the gender pay gap for all employees is considerably larger than the full-time and part-time gaps. Median pay for all employees was 14.3% less for women than for men in April 2023.
The full-time pay gap has been getting smaller since 1997 and the overall pay gap has also decreased over the period. The part-time pay gap has generally remained small and negative, with women earning more than men on average.
Why is there a gender pay gap?
The size of the gender pay gap depends on several factors, including:
- Age: There is little difference in median hourly pay for male and female full-time employees aged in their 20s and 30s, but a substantial gap emerges among full-time employees aged 40 and over. This links to parenthood – the gap between male and female hourly earnings grows gradually but steadily in the years after parents have their first child.
- Occupation: The gap tends to be smaller for occupation groups where a larger proportion of employees are women;
- Industry: The pay gap is largest in the financial and insurance industry, and smallest in the accommodation and food services industry;
- Public and private sector: For full-time workers, the pay gap is slightly smaller in the public sector than the private sector. There is a negligible gender pay gap for part-time workers in the private sector, which contrasts with a large part-time pay gap in the public sector;
- Region and nation: The full-time gender pay gap is highest in the South East and London and negative in Northern Ireland;
- Pay: The highest earners have a larger pay gap than the lowest earners.
Gender pay gap reporting
Since 2017/18, public and private sector employers with 250 or more employees have been required annually to publish data on the gender pay gap within their organisations. They must report the data to the Government, who publishes it.
In 2022/23, 79% of reporting employers stated that median hourly pay was higher for men than for women in their organisation, while 13% of employers stated median hourly pay was higher for women. 8% stated that median hourly pay was the same for women as for men.
Related Links
- ONS, Gender Pay Gap 2021
- Commons Library, Women and the economy briefing
Share this with
- Facebook Share this with Facebook
- Twitter Share this with Twitter
- LinkedIn Share this with LinkedIn
- Email Share this with Email
Related posts
Household debt: statistics and impact on economy.
This briefing provides statistics and forecasts for household debt, guidance on how to interpret debt statistics and analysis on how debt effects the economy.
- Economic policy
- Economic situation
Food banks in the UK
The Trussell Trust, an anti-poverty charity that operates a network of food banks across the UK, reported a 37% increase in the number of three-day emergency food parcels it distributed between 31 March 2022 and 1 April 2023, compared to the year before.
- Environment
Key Employment Rights
This briefing provides an overview of a range of key statutory employment rights in Great Britain, including unfair dismissal, deduction from wages and working time.
- Afghanistan Albania Algeria American Samoa Andorra Angola Anguilla Antarctica Antigua and Barbuda Argentina Armenia Aruba Australia Austria Azerbaijan Bahamas Bahrain Bangladesh Barbados Belarus Belgium Belize Benin Bermuda Bhutan Bolivia Bonaire, Sint Eustatius and Saba Bosnia and Herzegovina Botswana Bouvet Island Brazil British Indian Ocean Territory Brunei Darussalam Bulgaria Burkina Faso Burundi Cambodia Cameroon Canada Cape Verde Cayman Islands Central African Republic Chad Chile China Christmas Island Cocos (Keeling) Islands Colombia Comoros Congo Congo, The Democratic Republic of the Cook Islands CostaRica Croatia Cuba Curaçao Cyprus Czech Republic Côte d'Ivoire Denmark Djibouti Dominica Dominican Republic Ecuador Egypt El Salvador Equatorial Guinea Eritrea Estonia Ethiopia Faeroe Islands Falkland Islands (Malvinas) Fiji Finland France French Guiana French Polynesia French Southern Territories Gabon Gambia Georgia Germany Ghana Gibraltar Greece Greenland Grenada Guadeloupe Guam Guatemala Guernsey Guinea Guinea-Bissau Guyana Haiti Heard Island and McDonald Islands Holy See (Vatican City State) Honduras Hong Kong Hungary Iceland India Indonesia Iran, Islamic Republic of Iraq Ireland Isle of Man Israel Italy Jamaica Japan Jersey Jordan Kazakhstan Kenya Kiribati Korea, Democratic People's Republic of Korea, Republic of Kosovo Kuwait Kyrgyzstan Lao People's Democratic Republic Latvia Lebanon Lesotho Liberia Libyan Arab Jamahiriya Liechtenstein Lithuania Luxembourg Macau Macedonia, FYR Madagascar Malawi Malaysia Maldives Mali Malta Marshall Islands Martinique Mauritania Mauritius Mayotte Mexico Micronesia, Fed States of Moldova, Republic of Monaco Mongolia Montenegro Montserrat Morocco Mozambique Myanmar Namibia Nauru Nepal Netherlands New Caledonia New Zealand Nicaragua Niger Nigeria Niue Norfolk Island Northern Mariana Islands Norway Oman Pakistan Palau Palestinian Territory Panama Papua New Guinea Paraguay Peru Philippines Pitcairn Poland Portugal Puerto Rico Qatar Reunion Romania Russian Federation Rwanda Saint Barthélemy Saint Helena Saint Kitts and Nevis Saint Lucia Saint Martin (French part) Saint Pierre and Miquelon Saint Vincent and The Grenadines Samoa San Marino Sao Tome and Principe Saudi Arabia Senegal Serbia Seychelles Sierra Leone Singapore Sint Maarten Slovakia Slovenia Solomon Islands Somalia South Africa South Georgia and the South Sandwich Islands Spain Sri Lanka Sudan Suriname Svalbard and Jan Mayen Swaziland Sweden Switzerland Syrian Arab Republic Taiwan Tajikistan Tanzania, United Republic of Thailand Timor-Leste Togo Tokelau Tonga Trinidad and Tobago Tunisia Turkey Turkmenistan Turks and Caicos Islands Tuvalu Uganda Ukraine United Arab Emirates United Kingdom United States United States Minor Outlying Islands Uruguay Uzbekistan Vanuatu Venezuela Viet Nam VirginIslands (British) VirginIslands (US) Wallis and Futuna Western Sahara Yemen Zambia Zimbabwe
- Sign In My Account
It's not about catching up,

Subscribe to the FT today and navigate your world with confidence.
Explore our plans...
Then $75 per month. Complete digital access to quality FT journalism. Cancel anytime during your trial.
Decode global events and their impact on your industry with updates and analysis from our worldwide network of 700+ journalists.
Enjoy trusted insights and challenging perspectives from our leading experts.
Stay up to date wherever you are with breaking news alerts, offline reading and automatic downloads of the latest edition
Our new iPhone and iPad app , delivering 8 hand-picked stories every weekday to surprise and inform you.
Start your day with our unmissable morning briefing - the first stop to get you up to speed.
Discover exclusive content and great reads through our expert newsletters, including Inside Politics, Working It and FT Weekend, delivered directly to your inbox.
Track the content that matters to you via your own curated feed .
Watch and listen to the headlines via exclusive interviews, handy explainers and in-depth discussions featuring leading experts.
Share industry-leading content with your colleagues, friends and family for free.
Share more industry-leading content with your colleagues, friends and family for free.
Focus your day with Lex, our agenda-setting column that’s first to highlight emerging risks and opportunities.
Gain valuable insight from our exclusive newsletters including Unhedged, Moral Money and Europe Express, delivered straight to your inbox. Explore our newsletters here.
A digitised version of our current and previous print editions , including FT Weekend, on your desktop, laptop, tablet and mobile.
Standard Digital
Essential digital access to quality FT journalism on any device. Pay a year upfront and save 20%.
Premium Digital
Complete digital access to quality FT journalism with expert analysis from industry leaders. Pay a year upfront and save 20%.
FT Digital Edition
The new FT Digital Edition: today’s FT, cover to cover on any device. This subscription does not include access to ft.com or the FT App.
Compare our plans Compare our plans
Understand the differences between our plans and find what works best for you. Understand the differences between our plans and find what works best for you.

FT Videos & Podcasts ビデオ&ポッドキャスト More info 表示 Less info 非表示
From the city to the Serengeti, our stories will inform and inspire you to lead the way in business and beyond, to rethink existing political and economic models and follow crucial trends. Included with the Standard Digital and Premium Digital plans.
都会からサバンナまで。FTの記事は、ビジネスやその先の道を切り開き、既存の政治・経済モデルを見直し、重要なトレンドを追うために、あなたに情報とインスピレーションを与えます。 デジタル、スタンダード及びプレミアムプランに含まれます。
Included with: 含まれているもの:

FT App on Android & iOS Android・iOSアプリ More info 表示 Less info 非表示
Our apps allow you to read the FT anywhere, even when you’re offline, never miss a story with breaking news alerts and monitor your portfolio while you're on the move. Included with the Standard Digital and Premium Digital plans.
アプリをダウンロード頂くと、通知を設定すると最新のニュースを入手でき、移動中にポートフォリオも確認することが可能です。 デジタルスタンダードプランまたはプレミアムデジタルプランに含まれています。

FT Edit FT Editアプリ More info 表示 Less info 非表示
The FT Edit app, available for iPhone and iPad, delivers 8 hand-picked stories every weekday to surprise and inspire. Included with the Standard Digital and Premium Digital plans, or available on its own.
平日に、毎日8本の記事を読むことができる最新のiPhone・iPadアプリ。スタンダードデジタルプランまたはプレミアムデジタルプランに含まれていますが、FT Editのみでも購読することが可能です。

Gift Articles 1カ月に10本のギフト記事 More info 表示 Less info 非表示
Share articles with family, friends and colleagues who aren’t subscribers. Up to 10 per month with the Standard Digital plan and up to 20 per month with the Premium Digital plan.
購読者ではない家族・友達・同僚と記事を共有することが可能です。デジタルスタンダードプランの場合は月10本の記事までデジタルプレミアムプランは月20本の記事まで共有可能です。

Lex Lex More info 表示 Less info 非表示
Lex is arguably the world's most influential column of its kind. An award-winning team across four time zones helps readers make better investment decisions by highlighting key risks and opportunities. Included with the Print and Premium Digital plans.
Lexは、世界で最も影響のあるコラムと言えます。4つのタイムゾーンにまたがる受賞歴のあるチームが、主要な投資リスクと機会を強調することで、読者がより良い投資判断を下せるよう支援します。新聞版とデジタルプレミアムプランに含まれます。

Premium Newsletters プレミアム・ニュースレター More info 表示 Less info 非表示
An expansive suite of specialist newsletters providing deep-dive, expert analysis on a broad range of topics from tech to trade. Included with the Premium Digital plan.
テクノロジーから貿易まで、業界の牽引者に執筆される様々なトピックのニュースレターにご購読頂けます。

FT Digital Edition: our digitised print edition ePaper More info 表示 Less info 非表示
An easy-to-navigate digital replica of the weekday print edition and FT Weekend, available on your desktop, laptop, tablet and phone. Included with the Print , FT Digital Edition and Premium Digital plans.
PC、タブレット、スマートフォン等でお気軽にお読み頂ける、紙の新聞の電子レプリカ版。 新聞・ePaper・デジタル版 プレミアムプランに含まれています。
Terms & Conditions apply
Download the FT Edit app on iOS. A daily selection of the very best FT journalism.

Explore our full range of subscriptions.
For individuals.
Discover all the plans currently available in: Russian Federation
Professional
Complete digital access for multiple users, with integrations and admin tools.
Check whether you already have access via your university or organisation
Why the FT?
Global business, politics and so much more..
While the Financial Times is renowned for its award-winning business reporting, the topics we cover are much broader than many realise.
Over 300,000 global finance professionals use the FT’s unique tools, insights, analysis and data to spot trends, risks and opportunities.
Follow the trillions made and lost in tech with crisp analysis, expert opinions and two dedicated newsletters guiding you on the latest trends.
Life & Arts
Get the best out of life with thought-provoking reads, high profile interviews, the latest travel reviews and much more.
Keep abreast of the latest climate-related developments and technologies and understand the stories behind the data.
Work & Careers
Discover the big ideas shaping today’s workplaces with our thoughtful, comprehensive coverage of the new world of work.
Our global network of over 700 journalists work tirelessly to bring you the finest reporting on worldwide events as they unfold.
Expert reporting and opinion.
Our network of 700+ journalists report from all over the world, ensuring a truly global view of key events and decoding their impact on global business, finance, economics and politics.
Roula Khalaf
Roula Khalaf is Editor of the Financial Times. She was previously deputy editor from 2016 to 2020, overseeing a range of newsroom initiatives and award winning editorial projects and leading a global network of over 100 foreign correspondents.
The rumours are true: Orcel on European banking deals
John Burn-Murdoch
John Burn-Murdoch is the Financial Times’ Chief Data Reporter. He led the FT’s data-driven coverage of the pandemic, exploring its impacts on health, the economy and wider society. When pandemics are not happening, he uses data and graphics to tell stories on topics including politics, economics, climate change and sport, and is a visiting lecturer at the London School of Economics.
The seeds of the Tory collapse were sown in 2019
Stephen Bush
Stephen Bush is an associate editor and columnist at the Financial Times. He writes a daily newsletter, Inside Politics, charting the course of politics and policy in the United Kingdom, and a wide-ranging weekly column.
The Lib Dem strategy to restore their third party status
Elaine Moore
Elaine Moore is deputy editor of the FT’s Lex column and writes commentary on the technology industry from the San Francisco bureau. Prior to this she covered global government debt from London, with a particular focus on the debt crisis in Greece, Ukraine and Venezuela.
Jensen Huang, Nvidia’s ‘Napoleon’ sees the chip company soar
Pilita Clark
Pilita Clark is an associate editor and business columnist at the FT where she writes on corporate life and climate change. Formerly the FT’s environment correspondent, her writing has won awards in the US and Asia and in 2019 she was named Environment Journalist of the Year for the third year in a row at the British Press Awards.
Introducing The Economics Show with Soumaya Keynes
Jan Dalley is the FT’s arts editor. She is responsible for the FT’s coverage of all the art forms, from opera to hiphop, sculpture to pop, film, theatre and more in the weekday pages as well as in Life & Arts in FT Weekend. She also writes features, interviews and occasional columns.
Beyond boycotts at the Venice Biennale
Edward Luce
Edward Luce is the US national editor and columnist at the Financial Times. Before that he was the FT's Washington Bureau chief. Other roles have included South Asia bureau chief, Capital Markets editor, and Philippines Correspondent.
Why Nikki Haley still looms over the White House race
Enuma Okoro
Enuma Okoro is a weekly columnist for FT Weekend's Life & Arts. She writes on the intersection of arts, culture and life. Based in New York, she is a writer, speaker and cultural curator.
The beauty and burdens we carry
Anjana Ahuja
Anjana Ahuja is a contributing writer on science, offering weekly opinion on significant developments in global science, health and technology. She was previously a feature writer and columnist at The Times in London.
Hot jobs report suggests US rates could stay higher for longer
Gillian Tett
Gillian Tett is chair of the editorial board and editor-at-large, US of the Financial Times. She writes weekly columns, covering a range of economic, financial, political and social issues and co-founded Moral Money, the FT sustainability newsletter.
FirstFT: Emmanuel Macron calls snap election after Marine Le Pen victory
Rana Foroohar
Rana Foroohar is Global Business Columnist and an Associate Editor at the Financial Times, based in New York. She is also CNN’s global economic analyst.
Janan Ganesh
Janan Ganesh is a biweekly columnist and associate editor for the FT. He writes on international politics for the FT and culture for FT Weekend. He was previously political correspondent for The Economist for five years.
The last best hope against populism is to expose it to government
Robert Shrimsley
Robert Shrimsley is UK chief political commentator and UK editor at large of the Financial Times. He writes a weekly column on British politics and for the FT weekend magazine. Before this, he served as the FT’s chief political correspondent, news editor, managing editor of FT.com and editorial director.
Transcript: Tory morale plunges
Martin Wolf
Martin Wolf is chief economics commentator at the Financial Times, London. He was awarded the CBE (Commander of the British Empire) in 2000 “for services to financial journalism”.
Tariffs are bad policy, but good politics
NEWSLETTERS
Specialist insight from our top writers..
We offer an impressive roster of newsletters, written by our award-winning journalists. These cover a wide range of topics from climate change to finance, American politics to trade - all sent straight to your inbox.

Inside Politics
Stephen Bush’s guide to everything you need to know about power, politics and policy in the United Kingdom.

Robert Armstrong dissects the most important market trends and discusses how Wall Street’s best minds respond to them.

US Election Countdown
Join the FT’s Washington reporter Steff Chávez for your essential guide to the twists and turns of the 2024 presidential election.

Europe Express
Your essential guide to what matters in Europe today, including news on the war in Ukraine.

The Lex Newsletter
Lex is the FT’s incisive daily column on investment. Sign up for our newsletter on local and global trends from expert writers in four great financial centres.

Moral Money
News and analysis on the drive for a fairer, cleaner and more sustainable world economy.

Everything you need to get ahead at work, in your inbox every Wednesday.

FT Swamp Notes
Rana Foroohar and Edward Luce discuss the intersection of money and power in US politics.

Martin Sandbu’s Free Lunch
Your weekly guide to the global economic policy debate, written by our European Economics Commentator.
VIDEOS & PODCASTS
Be informed and inspired by our audiovisual journalism..
From the city to the Serengeti, our stories will inform and inspire you to lead the way in business and beyond, to rethink existing political and economic models and follow crucial trends.

Hedge funds
Crispin Odey: the fall of a hedge fund maverick

FT Standpoint
Capture: who's looking after the children?

Cryptocurrencies
FTX: the legend of Sam Bankman-Fried

The Brexit effect: how leaving the EU hit the UK

News in-depth
Credit Suisse: what next for the crisis-hit bank?

North Korea and the triads: gangsters, ghost ships and spies

From personalisation to portfolio planning.
A Financial Times subscription gives you so much more than just award-winning reporting, commentary and analysis. Take advantage of our range of complimentary tools to maximise the value of your investment.
Saved articles
Save articles of interest to your myFT account with a single click for easy recall.
Instant alerts
Never miss a story with instant alerts on the topics, stories and journalists that matter to you most.
Gift articles
Share articles with friends, family and colleagues who aren't subscribers with unique gift links.
Monitor performance and view relevant news stories and fundamentals related to your holdings portfolio.
Engage with our global community of journalists and subscribers and add your voice to the conversation.
Currency Converter
Browse news and rates across dozens of currencies, or select a currency pair for spot rate charting and data.
Track the topics, stories and journalists that matter to you most in your own personalised news feed.
Republishing
Leverage the power of FT journalism by republishing our content to your website or publication. Additional fees apply.
- Search Menu
- Sign in through your institution
- Advance Articles
- Browse content in A - General Economics and Teaching
- Browse content in A1 - General Economics
- A10 - General
- A11 - Role of Economics; Role of Economists; Market for Economists
- A12 - Relation of Economics to Other Disciplines
- A13 - Relation of Economics to Social Values
- A14 - Sociology of Economics
- Browse content in A2 - Economic Education and Teaching of Economics
- A20 - General
- A23 - Graduate
- Browse content in A3 - Collective Works
- A31 - Collected Writings of Individuals
- Browse content in B - History of Economic Thought, Methodology, and Heterodox Approaches
- Browse content in B0 - General
- B00 - General
- Browse content in B1 - History of Economic Thought through 1925
- B10 - General
- B12 - Classical (includes Adam Smith)
- B16 - History of Economic Thought: Quantitative and Mathematical
- Browse content in B2 - History of Economic Thought since 1925
- B22 - Macroeconomics
- B26 - Financial Economics
- B27 - International Trade and Finance
- B29 - Other
- Browse content in B3 - History of Economic Thought: Individuals
- B31 - Individuals
- Browse content in B4 - Economic Methodology
- B40 - General
- B41 - Economic Methodology
- Browse content in B5 - Current Heterodox Approaches
- B50 - General
- B52 - Institutional; Evolutionary
- B54 - Feminist Economics
- B55 - Social Economics
- Browse content in C - Mathematical and Quantitative Methods
- Browse content in C0 - General
- C02 - Mathematical Methods
- Browse content in C1 - Econometric and Statistical Methods and Methodology: General
- C10 - General
- C11 - Bayesian Analysis: General
- C13 - Estimation: General
- C14 - Semiparametric and Nonparametric Methods: General
- C15 - Statistical Simulation Methods: General
- Browse content in C2 - Single Equation Models; Single Variables
- C20 - General
- C21 - Cross-Sectional Models; Spatial Models; Treatment Effect Models; Quantile Regressions
- C22 - Time-Series Models; Dynamic Quantile Regressions; Dynamic Treatment Effect Models; Diffusion Processes
- C23 - Panel Data Models; Spatio-temporal Models
- C3 - Multiple or Simultaneous Equation Models; Multiple Variables
- Browse content in C4 - Econometric and Statistical Methods: Special Topics
- C45 - Neural Networks and Related Topics
- Browse content in C5 - Econometric Modeling
- C50 - General
- C51 - Model Construction and Estimation
- C53 - Forecasting and Prediction Methods; Simulation Methods
- C54 - Quantitative Policy Modeling
- C55 - Large Data Sets: Modeling and Analysis
- Browse content in C6 - Mathematical Methods; Programming Models; Mathematical and Simulation Modeling
- C61 - Optimization Techniques; Programming Models; Dynamic Analysis
- C63 - Computational Techniques; Simulation Modeling
- C68 - Computable General Equilibrium Models
- Browse content in C7 - Game Theory and Bargaining Theory
- C72 - Noncooperative Games
- C78 - Bargaining Theory; Matching Theory
- Browse content in C8 - Data Collection and Data Estimation Methodology; Computer Programs
- C80 - General
- C81 - Methodology for Collecting, Estimating, and Organizing Microeconomic Data; Data Access
- C88 - Other Computer Software
- Browse content in C9 - Design of Experiments
- C90 - General
- C93 - Field Experiments
- Browse content in D - Microeconomics
- Browse content in D0 - General
- D00 - General
- D01 - Microeconomic Behavior: Underlying Principles
- D02 - Institutions: Design, Formation, Operations, and Impact
- D03 - Behavioral Microeconomics: Underlying Principles
- D04 - Microeconomic Policy: Formulation; Implementation, and Evaluation
- Browse content in D1 - Household Behavior and Family Economics
- D10 - General
- D12 - Consumer Economics: Empirical Analysis
- D14 - Household Saving; Personal Finance
- D15 - Intertemporal Household Choice: Life Cycle Models and Saving
- D18 - Consumer Protection
- Browse content in D2 - Production and Organizations
- D21 - Firm Behavior: Theory
- D22 - Firm Behavior: Empirical Analysis
- D23 - Organizational Behavior; Transaction Costs; Property Rights
- D24 - Production; Cost; Capital; Capital, Total Factor, and Multifactor Productivity; Capacity
- Browse content in D3 - Distribution
- D30 - General
- D31 - Personal Income, Wealth, and Their Distributions
- D33 - Factor Income Distribution
- Browse content in D4 - Market Structure, Pricing, and Design
- D40 - General
- D42 - Monopoly
- D43 - Oligopoly and Other Forms of Market Imperfection
- D44 - Auctions
- D45 - Rationing; Licensing
- D47 - Market Design
- Browse content in D5 - General Equilibrium and Disequilibrium
- D50 - General
- D51 - Exchange and Production Economies
- D53 - Financial Markets
- D57 - Input-Output Tables and Analysis
- D58 - Computable and Other Applied General Equilibrium Models
- Browse content in D6 - Welfare Economics
- D60 - General
- D61 - Allocative Efficiency; Cost-Benefit Analysis
- D62 - Externalities
- D63 - Equity, Justice, Inequality, and Other Normative Criteria and Measurement
- D64 - Altruism; Philanthropy
- D69 - Other
- Browse content in D7 - Analysis of Collective Decision-Making
- D70 - General
- D71 - Social Choice; Clubs; Committees; Associations
- D72 - Political Processes: Rent-seeking, Lobbying, Elections, Legislatures, and Voting Behavior
- D73 - Bureaucracy; Administrative Processes in Public Organizations; Corruption
- D74 - Conflict; Conflict Resolution; Alliances; Revolutions
- D78 - Positive Analysis of Policy Formulation and Implementation
- Browse content in D8 - Information, Knowledge, and Uncertainty
- D81 - Criteria for Decision-Making under Risk and Uncertainty
- D82 - Asymmetric and Private Information; Mechanism Design
- D83 - Search; Learning; Information and Knowledge; Communication; Belief; Unawareness
- D84 - Expectations; Speculations
- D85 - Network Formation and Analysis: Theory
- D86 - Economics of Contract: Theory
- Browse content in D9 - Micro-Based Behavioral Economics
- D90 - General
- D91 - Role and Effects of Psychological, Emotional, Social, and Cognitive Factors on Decision Making
- D92 - Intertemporal Firm Choice, Investment, Capacity, and Financing
- Browse content in E - Macroeconomics and Monetary Economics
- Browse content in E0 - General
- E00 - General
- E01 - Measurement and Data on National Income and Product Accounts and Wealth; Environmental Accounts
- E02 - Institutions and the Macroeconomy
- E03 - Behavioral Macroeconomics
- Browse content in E1 - General Aggregative Models
- E10 - General
- E12 - Keynes; Keynesian; Post-Keynesian
- E13 - Neoclassical
- E17 - Forecasting and Simulation: Models and Applications
- Browse content in E2 - Consumption, Saving, Production, Investment, Labor Markets, and Informal Economy
- E21 - Consumption; Saving; Wealth
- E22 - Investment; Capital; Intangible Capital; Capacity
- E23 - Production
- E24 - Employment; Unemployment; Wages; Intergenerational Income Distribution; Aggregate Human Capital; Aggregate Labor Productivity
- E25 - Aggregate Factor Income Distribution
- E26 - Informal Economy; Underground Economy
- E27 - Forecasting and Simulation: Models and Applications
- Browse content in E3 - Prices, Business Fluctuations, and Cycles
- E30 - General
- E31 - Price Level; Inflation; Deflation
- E32 - Business Fluctuations; Cycles
- E37 - Forecasting and Simulation: Models and Applications
- Browse content in E4 - Money and Interest Rates
- E40 - General
- E42 - Monetary Systems; Standards; Regimes; Government and the Monetary System; Payment Systems
- E43 - Interest Rates: Determination, Term Structure, and Effects
- E44 - Financial Markets and the Macroeconomy
- E47 - Forecasting and Simulation: Models and Applications
- Browse content in E5 - Monetary Policy, Central Banking, and the Supply of Money and Credit
- E50 - General
- E51 - Money Supply; Credit; Money Multipliers
- E52 - Monetary Policy
- E58 - Central Banks and Their Policies
- Browse content in E6 - Macroeconomic Policy, Macroeconomic Aspects of Public Finance, and General Outlook
- E60 - General
- E61 - Policy Objectives; Policy Designs and Consistency; Policy Coordination
- E62 - Fiscal Policy
- E63 - Comparative or Joint Analysis of Fiscal and Monetary Policy; Stabilization; Treasury Policy
- E64 - Incomes Policy; Price Policy
- E65 - Studies of Particular Policy Episodes
- E66 - General Outlook and Conditions
- Browse content in F - International Economics
- Browse content in F0 - General
- F00 - General
- F02 - International Economic Order and Integration
- Browse content in F1 - Trade
- F10 - General
- F11 - Neoclassical Models of Trade
- F12 - Models of Trade with Imperfect Competition and Scale Economies; Fragmentation
- F13 - Trade Policy; International Trade Organizations
- F14 - Empirical Studies of Trade
- F15 - Economic Integration
- F16 - Trade and Labor Market Interactions
- F17 - Trade Forecasting and Simulation
- F18 - Trade and Environment
- Browse content in F2 - International Factor Movements and International Business
- F20 - General
- F21 - International Investment; Long-Term Capital Movements
- F22 - International Migration
- F23 - Multinational Firms; International Business
- F24 - Remittances
- F29 - Other
- Browse content in F3 - International Finance
- F30 - General
- F31 - Foreign Exchange
- F32 - Current Account Adjustment; Short-Term Capital Movements
- F33 - International Monetary Arrangements and Institutions
- F34 - International Lending and Debt Problems
- F35 - Foreign Aid
- F36 - Financial Aspects of Economic Integration
- F37 - International Finance Forecasting and Simulation: Models and Applications
- F38 - International Financial Policy: Financial Transactions Tax; Capital Controls
- Browse content in F4 - Macroeconomic Aspects of International Trade and Finance
- F40 - General
- F41 - Open Economy Macroeconomics
- F42 - International Policy Coordination and Transmission
- F43 - Economic Growth of Open Economies
- F45 - Macroeconomic Issues of Monetary Unions
- F47 - Forecasting and Simulation: Models and Applications
- Browse content in F5 - International Relations, National Security, and International Political Economy
- F50 - General
- F51 - International Conflicts; Negotiations; Sanctions
- F52 - National Security; Economic Nationalism
- F53 - International Agreements and Observance; International Organizations
- F55 - International Institutional Arrangements
- F59 - Other
- Browse content in F6 - Economic Impacts of Globalization
- F60 - General
- F61 - Microeconomic Impacts
- F62 - Macroeconomic Impacts
- F63 - Economic Development
- F64 - Environment
- F65 - Finance
- F66 - Labor
- F68 - Policy
- F69 - Other
- Browse content in G - Financial Economics
- Browse content in G0 - General
- G01 - Financial Crises
- Browse content in G1 - General Financial Markets
- G10 - General
- G11 - Portfolio Choice; Investment Decisions
- G12 - Asset Pricing; Trading volume; Bond Interest Rates
- G13 - Contingent Pricing; Futures Pricing
- G14 - Information and Market Efficiency; Event Studies; Insider Trading
- G15 - International Financial Markets
- G17 - Financial Forecasting and Simulation
- G18 - Government Policy and Regulation
- Browse content in G2 - Financial Institutions and Services
- G20 - General
- G21 - Banks; Depository Institutions; Micro Finance Institutions; Mortgages
- G22 - Insurance; Insurance Companies; Actuarial Studies
- G23 - Non-bank Financial Institutions; Financial Instruments; Institutional Investors
- G24 - Investment Banking; Venture Capital; Brokerage; Ratings and Ratings Agencies
- G28 - Government Policy and Regulation
- Browse content in G3 - Corporate Finance and Governance
- G31 - Capital Budgeting; Fixed Investment and Inventory Studies; Capacity
- G32 - Financing Policy; Financial Risk and Risk Management; Capital and Ownership Structure; Value of Firms; Goodwill
- G33 - Bankruptcy; Liquidation
- G34 - Mergers; Acquisitions; Restructuring; Corporate Governance
- G35 - Payout Policy
- G38 - Government Policy and Regulation
- G39 - Other
- Browse content in G4 - Behavioral Finance
- G41 - Role and Effects of Psychological, Emotional, Social, and Cognitive Factors on Decision Making in Financial Markets
- Browse content in G5 - Household Finance
- G50 - General
- G51 - Household Saving, Borrowing, Debt, and Wealth
- Browse content in H - Public Economics
- Browse content in H0 - General
- H00 - General
- Browse content in H1 - Structure and Scope of Government
- H10 - General
- H11 - Structure, Scope, and Performance of Government
- H12 - Crisis Management
- H13 - Economics of Eminent Domain; Expropriation; Nationalization
- Browse content in H2 - Taxation, Subsidies, and Revenue
- H20 - General
- H21 - Efficiency; Optimal Taxation
- H22 - Incidence
- H23 - Externalities; Redistributive Effects; Environmental Taxes and Subsidies
- H24 - Personal Income and Other Nonbusiness Taxes and Subsidies; includes inheritance and gift taxes
- H25 - Business Taxes and Subsidies
- H26 - Tax Evasion and Avoidance
- H29 - Other
- Browse content in H3 - Fiscal Policies and Behavior of Economic Agents
- H30 - General
- H31 - Household
- Browse content in H4 - Publicly Provided Goods
- H41 - Public Goods
- H43 - Project Evaluation; Social Discount Rate
- H44 - Publicly Provided Goods: Mixed Markets
- Browse content in H5 - National Government Expenditures and Related Policies
- H50 - General
- H51 - Government Expenditures and Health
- H52 - Government Expenditures and Education
- H53 - Government Expenditures and Welfare Programs
- H54 - Infrastructures; Other Public Investment and Capital Stock
- H55 - Social Security and Public Pensions
- H56 - National Security and War
- H57 - Procurement
- Browse content in H6 - National Budget, Deficit, and Debt
- H60 - General
- H62 - Deficit; Surplus
- H63 - Debt; Debt Management; Sovereign Debt
- H68 - Forecasts of Budgets, Deficits, and Debt
- H69 - Other
- Browse content in H7 - State and Local Government; Intergovernmental Relations
- H70 - General
- H71 - State and Local Taxation, Subsidies, and Revenue
- H73 - Interjurisdictional Differentials and Their Effects
- H75 - State and Local Government: Health; Education; Welfare; Public Pensions
- H77 - Intergovernmental Relations; Federalism; Secession
- Browse content in H8 - Miscellaneous Issues
- H81 - Governmental Loans; Loan Guarantees; Credits; Grants; Bailouts
- H83 - Public Administration; Public Sector Accounting and Audits
- H84 - Disaster Aid
- H87 - International Fiscal Issues; International Public Goods
- Browse content in I - Health, Education, and Welfare
- Browse content in I0 - General
- I00 - General
- Browse content in I1 - Health
- I10 - General
- I11 - Analysis of Health Care Markets
- I12 - Health Behavior
- I14 - Health and Inequality
- I15 - Health and Economic Development
- I18 - Government Policy; Regulation; Public Health
- I19 - Other
- Browse content in I2 - Education and Research Institutions
- I20 - General
- I21 - Analysis of Education
- I23 - Higher Education; Research Institutions
- I24 - Education and Inequality
- I26 - Returns to Education
- I28 - Government Policy
- Browse content in I3 - Welfare, Well-Being, and Poverty
- I30 - General
- I31 - General Welfare
- I32 - Measurement and Analysis of Poverty
- I38 - Government Policy; Provision and Effects of Welfare Programs
- Browse content in J - Labor and Demographic Economics
- Browse content in J0 - General
- J00 - General
- J01 - Labor Economics: General
- J08 - Labor Economics Policies
- Browse content in J1 - Demographic Economics
- J11 - Demographic Trends, Macroeconomic Effects, and Forecasts
- J12 - Marriage; Marital Dissolution; Family Structure; Domestic Abuse
- J13 - Fertility; Family Planning; Child Care; Children; Youth
- J14 - Economics of the Elderly; Economics of the Handicapped; Non-Labor Market Discrimination
- J15 - Economics of Minorities, Races, Indigenous Peoples, and Immigrants; Non-labor Discrimination
- J16 - Economics of Gender; Non-labor Discrimination
- J17 - Value of Life; Forgone Income
- J18 - Public Policy
- Browse content in J2 - Demand and Supply of Labor
- J20 - General
- J21 - Labor Force and Employment, Size, and Structure
- J22 - Time Allocation and Labor Supply
- J23 - Labor Demand
- J24 - Human Capital; Skills; Occupational Choice; Labor Productivity
- J26 - Retirement; Retirement Policies
- J28 - Safety; Job Satisfaction; Related Public Policy
- Browse content in J3 - Wages, Compensation, and Labor Costs
- J31 - Wage Level and Structure; Wage Differentials
- J33 - Compensation Packages; Payment Methods
- J38 - Public Policy
- Browse content in J4 - Particular Labor Markets
- J40 - General
- J41 - Labor Contracts
- J44 - Professional Labor Markets; Occupational Licensing
- J46 - Informal Labor Markets
- J48 - Public Policy
- Browse content in J5 - Labor-Management Relations, Trade Unions, and Collective Bargaining
- J58 - Public Policy
- Browse content in J6 - Mobility, Unemployment, Vacancies, and Immigrant Workers
- J60 - General
- J61 - Geographic Labor Mobility; Immigrant Workers
- J62 - Job, Occupational, and Intergenerational Mobility
- J63 - Turnover; Vacancies; Layoffs
- J64 - Unemployment: Models, Duration, Incidence, and Job Search
- J65 - Unemployment Insurance; Severance Pay; Plant Closings
- J68 - Public Policy
- Browse content in J7 - Labor Discrimination
- J70 - General
- J71 - Discrimination
- Browse content in J8 - Labor Standards: National and International
- J88 - Public Policy
- Browse content in K - Law and Economics
- Browse content in K0 - General
- K00 - General
- Browse content in K1 - Basic Areas of Law
- K10 - General
- K11 - Property Law
- K12 - Contract Law
- Browse content in K2 - Regulation and Business Law
- K20 - General
- K21 - Antitrust Law
- K22 - Business and Securities Law
- K29 - Other
- Browse content in K3 - Other Substantive Areas of Law
- K31 - Labor Law
- K32 - Environmental, Health, and Safety Law
- K33 - International Law
- K34 - Tax Law
- K37 - Immigration Law
- K38 - Human Rights Law: Gender Law
- Browse content in K4 - Legal Procedure, the Legal System, and Illegal Behavior
- K40 - General
- K41 - Litigation Process
- K42 - Illegal Behavior and the Enforcement of Law
- K49 - Other
- Browse content in L - Industrial Organization
- Browse content in L1 - Market Structure, Firm Strategy, and Market Performance
- L11 - Production, Pricing, and Market Structure; Size Distribution of Firms
- L12 - Monopoly; Monopolization Strategies
- L13 - Oligopoly and Other Imperfect Markets
- L14 - Transactional Relationships; Contracts and Reputation; Networks
- L16 - Industrial Organization and Macroeconomics: Industrial Structure and Structural Change; Industrial Price Indices
- Browse content in L2 - Firm Objectives, Organization, and Behavior
- L21 - Business Objectives of the Firm
- L22 - Firm Organization and Market Structure
- L24 - Contracting Out; Joint Ventures; Technology Licensing
- L25 - Firm Performance: Size, Diversification, and Scope
- L26 - Entrepreneurship
- Browse content in L3 - Nonprofit Organizations and Public Enterprise
- L31 - Nonprofit Institutions; NGOs; Social Entrepreneurship
- L33 - Comparison of Public and Private Enterprises and Nonprofit Institutions; Privatization; Contracting Out
- L38 - Public Policy
- Browse content in L4 - Antitrust Issues and Policies
- L40 - General
- L41 - Monopolization; Horizontal Anticompetitive Practices
- L42 - Vertical Restraints; Resale Price Maintenance; Quantity Discounts
- Browse content in L5 - Regulation and Industrial Policy
- L50 - General
- L51 - Economics of Regulation
- L52 - Industrial Policy; Sectoral Planning Methods
- L53 - Enterprise Policy
- L59 - Other
- Browse content in L6 - Industry Studies: Manufacturing
- L60 - General
- L65 - Chemicals; Rubber; Drugs; Biotechnology
- Browse content in L7 - Industry Studies: Primary Products and Construction
- L71 - Mining, Extraction, and Refining: Hydrocarbon Fuels
- Browse content in L8 - Industry Studies: Services
- L80 - General
- L81 - Retail and Wholesale Trade; e-Commerce
- L86 - Information and Internet Services; Computer Software
- L88 - Government Policy
- Browse content in L9 - Industry Studies: Transportation and Utilities
- L90 - General
- L92 - Railroads and Other Surface Transportation
- L94 - Electric Utilities
- L98 - Government Policy
- Browse content in M - Business Administration and Business Economics; Marketing; Accounting; Personnel Economics
- Browse content in M1 - Business Administration
- M10 - General
- M11 - Production Management
- M12 - Personnel Management; Executives; Executive Compensation
- M13 - New Firms; Startups
- M14 - Corporate Culture; Social Responsibility
- M16 - International Business Administration
- M2 - Business Economics
- Browse content in M4 - Accounting and Auditing
- M41 - Accounting
- M42 - Auditing
- M48 - Government Policy and Regulation
- Browse content in M5 - Personnel Economics
- M50 - General
- M51 - Firm Employment Decisions; Promotions
- M53 - Training
- M54 - Labor Management
- Browse content in N - Economic History
- Browse content in N1 - Macroeconomics and Monetary Economics; Industrial Structure; Growth; Fluctuations
- N10 - General, International, or Comparative
- N12 - U.S.; Canada: 1913-
- N13 - Europe: Pre-1913
- N14 - Europe: 1913-
- Browse content in N2 - Financial Markets and Institutions
- N20 - General, International, or Comparative
- N23 - Europe: Pre-1913
- Browse content in N3 - Labor and Consumers, Demography, Education, Health, Welfare, Income, Wealth, Religion, and Philanthropy
- N33 - Europe: Pre-1913
- N34 - Europe: 1913-
- N36 - Latin America; Caribbean
- N37 - Africa; Oceania
- Browse content in N4 - Government, War, Law, International Relations, and Regulation
- N44 - Europe: 1913-
- Browse content in N5 - Agriculture, Natural Resources, Environment, and Extractive Industries
- N55 - Asia including Middle East
- Browse content in N6 - Manufacturing and Construction
- N60 - General, International, or Comparative
- N64 - Europe: 1913-
- Browse content in N7 - Transport, Trade, Energy, Technology, and Other Services
- N70 - General, International, or Comparative
- Browse content in N9 - Regional and Urban History
- N94 - Europe: 1913-
- Browse content in O - Economic Development, Innovation, Technological Change, and Growth
- Browse content in O1 - Economic Development
- O10 - General
- O11 - Macroeconomic Analyses of Economic Development
- O12 - Microeconomic Analyses of Economic Development
- O13 - Agriculture; Natural Resources; Energy; Environment; Other Primary Products
- O14 - Industrialization; Manufacturing and Service Industries; Choice of Technology
- O15 - Human Resources; Human Development; Income Distribution; Migration
- O16 - Financial Markets; Saving and Capital Investment; Corporate Finance and Governance
- O17 - Formal and Informal Sectors; Shadow Economy; Institutional Arrangements
- O18 - Urban, Rural, Regional, and Transportation Analysis; Housing; Infrastructure
- O19 - International Linkages to Development; Role of International Organizations
- Browse content in O2 - Development Planning and Policy
- O20 - General
- O21 - Planning Models; Planning Policy
- O22 - Project Analysis
- O23 - Fiscal and Monetary Policy in Development
- O24 - Trade Policy; Factor Movement Policy; Foreign Exchange Policy
- O25 - Industrial Policy
- Browse content in O3 - Innovation; Research and Development; Technological Change; Intellectual Property Rights
- O30 - General
- O31 - Innovation and Invention: Processes and Incentives
- O32 - Management of Technological Innovation and R&D
- O33 - Technological Change: Choices and Consequences; Diffusion Processes
- O34 - Intellectual Property and Intellectual Capital
- O35 - Social Innovation
- O38 - Government Policy
- Browse content in O4 - Economic Growth and Aggregate Productivity
- O40 - General
- O41 - One, Two, and Multisector Growth Models
- O42 - Monetary Growth Models
- O43 - Institutions and Growth
- O44 - Environment and Growth
- O47 - Empirical Studies of Economic Growth; Aggregate Productivity; Cross-Country Output Convergence
- O49 - Other
- Browse content in O5 - Economywide Country Studies
- O51 - U.S.; Canada
- O52 - Europe
- O53 - Asia including Middle East
- O55 - Africa
- O57 - Comparative Studies of Countries
- Browse content in P - Economic Systems
- Browse content in P0 - General
- P00 - General
- Browse content in P1 - Capitalist Systems
- P10 - General
- P12 - Capitalist Enterprises
- P14 - Property Rights
- P16 - Political Economy
- P2 - Socialist Systems and Transitional Economies
- Browse content in P3 - Socialist Institutions and Their Transitions
- P30 - General
- P36 - Consumer Economics; Health; Education and Training; Welfare, Income, Wealth, and Poverty
- Browse content in P4 - Other Economic Systems
- P46 - Consumer Economics; Health; Education and Training; Welfare, Income, Wealth, and Poverty
- P48 - Political Economy; Legal Institutions; Property Rights; Natural Resources; Energy; Environment; Regional Studies
- Browse content in P5 - Comparative Economic Systems
- P50 - General
- P51 - Comparative Analysis of Economic Systems
- Browse content in Q - Agricultural and Natural Resource Economics; Environmental and Ecological Economics
- Browse content in Q0 - General
- Q00 - General
- Q01 - Sustainable Development
- Q02 - Commodity Markets
- Browse content in Q1 - Agriculture
- Q10 - General
- Q11 - Aggregate Supply and Demand Analysis; Prices
- Q12 - Micro Analysis of Farm Firms, Farm Households, and Farm Input Markets
- Q13 - Agricultural Markets and Marketing; Cooperatives; Agribusiness
- Q14 - Agricultural Finance
- Q15 - Land Ownership and Tenure; Land Reform; Land Use; Irrigation; Agriculture and Environment
- Q17 - Agriculture in International Trade
- Q18 - Agricultural Policy; Food Policy
- Browse content in Q2 - Renewable Resources and Conservation
- Q20 - General
- Q21 - Demand and Supply; Prices
- Q23 - Forestry
- Q25 - Water
- Q27 - Issues in International Trade
- Q28 - Government Policy
- Browse content in Q3 - Nonrenewable Resources and Conservation
- Q30 - General
- Q32 - Exhaustible Resources and Economic Development
- Q33 - Resource Booms
- Q34 - Natural Resources and Domestic and International Conflicts
- Q35 - Hydrocarbon Resources
- Q38 - Government Policy
- Browse content in Q4 - Energy
- Q40 - General
- Q41 - Demand and Supply; Prices
- Q42 - Alternative Energy Sources
- Q43 - Energy and the Macroeconomy
- Q48 - Government Policy
- Browse content in Q5 - Environmental Economics
- Q50 - General
- Q51 - Valuation of Environmental Effects
- Q52 - Pollution Control Adoption Costs; Distributional Effects; Employment Effects
- Q53 - Air Pollution; Water Pollution; Noise; Hazardous Waste; Solid Waste; Recycling
- Q54 - Climate; Natural Disasters; Global Warming
- Q55 - Technological Innovation
- Q56 - Environment and Development; Environment and Trade; Sustainability; Environmental Accounts and Accounting; Environmental Equity; Population Growth
- Q57 - Ecological Economics: Ecosystem Services; Biodiversity Conservation; Bioeconomics; Industrial Ecology
- Q58 - Government Policy
- Browse content in R - Urban, Rural, Regional, Real Estate, and Transportation Economics
- Browse content in R1 - General Regional Economics
- R10 - General
- R11 - Regional Economic Activity: Growth, Development, Environmental Issues, and Changes
- R12 - Size and Spatial Distributions of Regional Economic Activity
- R14 - Land Use Patterns
- Browse content in R2 - Household Analysis
- R21 - Housing Demand
- R23 - Regional Migration; Regional Labor Markets; Population; Neighborhood Characteristics
- R28 - Government Policy
- Browse content in R3 - Real Estate Markets, Spatial Production Analysis, and Firm Location
- R30 - General
- R31 - Housing Supply and Markets
- R32 - Other Spatial Production and Pricing Analysis
- R38 - Government Policy
- Browse content in R4 - Transportation Economics
- R40 - General
- R41 - Transportation: Demand, Supply, and Congestion; Travel Time; Safety and Accidents; Transportation Noise
- R42 - Government and Private Investment Analysis; Road Maintenance; Transportation Planning
- R48 - Government Pricing and Policy
- Browse content in R5 - Regional Government Analysis
- R50 - General
- R51 - Finance in Urban and Rural Economies
- R52 - Land Use and Other Regulations
- R53 - Public Facility Location Analysis; Public Investment and Capital Stock
- R58 - Regional Development Planning and Policy
- Browse content in Z - Other Special Topics
- Browse content in Z1 - Cultural Economics; Economic Sociology; Economic Anthropology
- Z13 - Economic Sociology; Economic Anthropology; Social and Economic Stratification
- Z18 - Public Policy
- Author Guidelines
- Open Access Options
- Self-Archiving Policy
- About Oxford Review of Economic Policy
- Editorial Board
- Advertising and Corporate Services
- Journals Career Network
- Dispatch Dates
- Journals on Oxford Academic
- Books on Oxford Academic

Article Contents
I.introduction, iii.descriptive analysis, viii.concluding remarks, acknowledgement.
- < Previous
The gender pay gap in the UK: children and experience in work
- Article contents
- Figures & tables
- Supplementary Data
Monica Costa Dias, Robert Joyce, Francesca Parodi, The gender pay gap in the UK: children and experience in work, Oxford Review of Economic Policy , Volume 36, Issue 4, Winter 2020, Pages 855–881, https://doi.org/10.1093/oxrep/graa053
- Permissions Icon Permissions
In this study, we document the evolution of the gender pay gap in the UK over the past three decades and its association with fertility, examining the role of various differences in career patterns between men and women and how they change with the arrival of the first child. We show that differences in accumulated years of labour market experience play an important role, while differences in industry, occupation, and job characteristics explain less, conditional on working experience. We develop an empirical wage model to estimate the causal effect of working experience on the wages of women. Estimates from this model are then used to simulate two counterfactual scenarios in which women who are employed always work full-time, or women’s rates of both part-time and full-time work are the same as men’s. We find that differences in working experience explain up to two-thirds of the gender pay gap of college graduates 20 years after the first childbirth, and that the gap is largely driven by differences in full-time experience. The role of working experience is more moderate for individuals with no college education, but it can still account for about one-third of the overall long-term gender wage gap.
Gender differences in earnings are essentially universal across countries. Within the developed world those gaps have tended to fall greatly over the last century, although progress has stalled in recent decades and the gaps remain sizeable ( Goldin, 2014 ; Blau and Kahn, 2017). The opening of the pay gap happens gradually over the course of life and is strongly related with the arrival of children and its strong negative effects on the hourly wage rates, employment rates, and hours of paid work of women (Paull, 2008; Adda et al ., 2017; Kleven et al ., 2019 a ).
Countries differ significantly in the relative importance of these determinants of the gender pay gap. Figure 1 shows the wide cross-country variation in the employment and working hours of mothers. For instance, Scandinavian and northern European countries have the highest maternal employment rates, almost 30 percentage points higher than the employment rates in some of the southern European countries, such as Greece and Italy, and over 50 percentage points higher than employment rates in Turkey. The employment rates of mothers in English-speaking countries tend to fall in the middle of the table, close to the average for OECD and EU countries. In some countries, including Germany, the Netherlands, Austria, and the UK, a large fraction of working mothers do short working hours, while in other places, including the Scandinavian countries, most mothers in work do full-time hours.

Maternal employment rates across OECD countries Note : Data from OECD Family Database. Shows PT–FT (part time–full time) employment rates (%) of women aged 15–64 with at least one child aged 0–14 in 2014 or latest available year.
Recent research (Kleven et al ., 2019 a ) also documented that in countries where mothers stay longer out of work after childbirth, such as the US and UK as compared to the Scandinavian countries, the drop in women’s earnings relative to men’s persists for longer after childbirth. This is partly the mechanical effect of mothers continuing to work less than fathers do many years after their first child is born, and partly a consequence of the price of labour as measured by the wage rate per hour being differentially affected by parenthood for mothers and fathers.
In this paper we investigate some of the drivers of the gender wage gap among parents. We document that the gap in hourly wages does not open immediately after childbirth, contrary to what happens to earnings, but instead widens gradually as the child grows up. We then consider two mechanisms that can partly account for that gradual but permanent opening of the gender wage gap. First, taking time away from paid work and working short hours—two prevalent features of maternal, but not paternal, labour supply—may inhibit the wage growth of women through skill depreciation, slow accumulation of skills, or lack of career progression, hence denting their future earnings capacity persistently. Second, mothers and fathers sort into different types of jobs—in different industries, occupations, and offering a different set of amenities such as flexibility in working hours—perhaps because of how difficult or easy it is to combine such jobs with the responsibilities of parenthood. If mothers cluster into jobs that can easily be coordinated with their childcare responsibilities, even if at the cost of higher pay, while fathers assume the main bread-winner role and sort into high-paying jobs, the resulting diverging careers could be reflected in diverging wage profiles. These two mechanisms are likely to lead to a gradual accumulation of persistent losses in the wage rates of mothers as compared to fathers and contribute to explaining the widening of the gender wage gap after childbirth. They are also likely related. Indeed, mothers who take time away from paid work may see their prospects of progressing to higher paying jobs curtailed, at least partly as they fail to accumulate the working experience they need to progress.
Using longitudinal data for the UK spanning the 27 years that start in 1991, we assess the quantitative importance of these mechanisms. We find that ‘experience capital’ gained in work has the potential to account for a large share of the gender wage gap, including the way that it evolves over the life cycle. In contrast, conditionally on accumulated working experience, the different job characteristics (including industry and occupation) in which fathers and mothers concentrate do not further explain much of the opening of the gap after childbirth. This is not to say that sorting into jobs with different characteristics is not an important driver of the gender gap in wages. Instead, our result reflects that gender differences in job sorting happen together with the expansion in the gender experience gap, as mothers taking time away from paid work fail to progress in their careers and may even move down the job ladder.
Building on this evidence, we set up and estimate an empirical model of wage dynamics that allows us to assess the causal impact of accumulated work experience capital on the wage progression of women over their life-cycle. Our model formalizes, in a flexible way, the intertemporal connection between hourly wages and labour supply at the extensive and intensive margins. In particular, it accounts for the possibility that working part-time hours impacts hourly wages not only today, but also in future years by having implications for wage progression that are different from those of full-time work. It also allows for depreciation in experience capital during periods of no work. Given the importance of education in driving labour market outcomes, we fully interact our model with education attainment. We consider three education levels, corresponding to less than high-school qualifications, high-school qualifications, and university degree. To deal with endogenous participation and hours selection, we adopt a control function approach exploiting the many policy reforms that changed the incentives to work of mothers over the period covered by the data. For exclusion restrictions we use simulated family disposable income variables that are constructed for different working hours of the woman (Blundell et al ., 1998).
We find that working full-time hours is a key determinant of wage progression, particularly for women earlier in the career. Moreover, there is a clear positive education gradient on the impact of working full-time hours on wage growth. This means that educated women have more to gain from working full-time hours but also that they are the ones who have most to lose from not doing so. In contrast, we find no statistically significant impact of working part-time hours.
Our model can be used to simulate the role of experience losses in explaining the opening of the gender wage gap after the birth of the first child. We do so in two counterfactual simulations: the first simulation imposes that employed women always work full-time, and the second simulation further imposes that women are paid for their work at the same rate of men. For university graduates we find that losses in working experience after the birth of the first child can explain up to two-thirds of the opening of the gap in wages when the child reaches 20 years of age. This is not merely because mothers spend more time out of the labour force after childbirth than fathers; it is also because, when in paid work, they are likely to work shorter hours, and part-time work shuts down progression in hourly wages. The role of working experience is more moderate for individuals with no university education, but it can still account for about one-third of the overall gender wage gap 20 years after childbirth.
Some of the channels we investigate have been studied in the large empirical literature on gender gaps. For instance, Bertrand et al . (2010) identify career interruptions and working hours as key drivers of the pay gap among MBA graduates; Goldin, (2014) discusses the high penalty from career breaks and flexibility in some high-wage occupations as drivers of the persisting gender wage gap; Blau and Kahn (2017) find that the three most important factors explaining the current gender wage gap in the US are occupation, industry, and experience; Kleven et al . (2019 b ) point to occupation, sector, and firm choices as mechanisms driving child penalties in Denmark. Our study adds to this literature by considering the causal impact of current working choices on wage growth and how these effects cumulate over time to explain the gradual opening of the gender wage gap after childbirth. We also document that other mechanisms, such as occupation, industry, or specific job characteristics, are comparatively less important once cumulative differences in working experience are accounted for.
One other set of papers uses structural models of the life-cycle to study female labour supply and wages. Among others, Olivetti (2006) builds a life-cycle model with human capital accumulation and home production to investigate the change in women’s supply of hours of market work; Attanasio et al . (2008) construct a life-cycle model of female participation decisions and savings with a process for human capital accumulation that accounts for periods out of work; Blundell et al . (2016) estimate a dynamic model of employment, human capital accumulation, and savings for women and use it to analyse the effects of welfare policy in the UK; Adda et al . (2017) model fertility and labour supply decisions of women over the life-cycle to quantify the long-run impact of fertility incentivizing policies. We depart from these papers by adopting a more flexible empirical model that is nevertheless well suited to quantify the role of present and past experiences in work in explaining female wage dynamics. We then use our framework to study the extent to which our mechanisms explain gender differences in pay among parents. 1
The rest of the paper is organized as follows. Section II describes the data and defines the main variables. Section III shows descriptive evidence on the evolution of the gender pay gap and its relation to childbirth and to the different working lives of mothers and fathers. It then shows that opening differences in experience capital are strongly related with the growing gender pay gap after childbirth. Section IV outlines the econometric model and estimation technique we use to identify the causal impact of working experience on the wages of women. Section V reports the empirical estimates and section VI discusses the model predictions by simulating counterfactual wage gaps if women were to work at the same rate as men do. Section VII suggests policy implications. Finally, section VIII draws some concluding remarks.
We use two data sources for our empirical analysis. All analysis requiring longitudinal data is based on the UK Household Longitudinal Study (UKHLS). This is a combination of two panel studies of families with the same structure and overlapping samples, the British Household Panel Survey (BHPS) and the Understanding Society (USoc). 2 The UKHLS has been following the lives of families and their offshoots since 1991. The survey started with a representative sample of 5,050 households living in Great Britain; it was later replenished in 1997 and 2001 with 1,000 households from the former European Community Household Panel, in 1999 with two samples of 1,500 households each from the Welsh and Scottish extensions, and in 2001 with the first set of households from Northern Ireland, totalling 1,900. It has undergone a large expansion and restructuring in 2009 that was marked with the adoption of its new label, USoc. Some 40,000 new families were added from across the UK. Except for attrition—which was particularly large in the transition between the two studies in 2009, affecting just over 30 per cent of the existing sample—all household members in the original samples remain in the sample until the end of the period, which for this paper is 2017. Other individuals have also been added to the sample, as they formed families with original members of the panel or were born into them. In our analysis, we exclude families living in Northern Ireland as the region is only sampled from 2001 onwards.
All members of the household aged 16 and above are interviewed yearly, and a large set of demographic, education, and labour-market information is recorded. The UKHLS also collects historical information documenting the history of full-time and part-time employment and the socio-economic environment of the parental household of each interviewee.
We use the sub-sample of individuals observed during their main working years, between the ages of 20 and 55, after they left full-time education. In each annual wave, the UKHLS collects information on employment status, usual weekly working hours, paid and unpaid overtime, and gross pay including for overtime. We discretize the distribution of working hours into three bins that we label as no-work (4 hours per week or fewer), part-time work (5–24 weekly hours), and full-time work (25 and more weekly hours). Those who report being disabled or long-term sick are dropped from the sample.
Table 1 shows the sample sizes in UKHLS for our population of interest. Overall, our sample includes almost 150,000 observations of over 27,000 individuals. Among these, over 7,000 were first interviewed in the BHPS period, prior to 2009, of which just over 1,400 are present in both periods. The median length of the observation period is 6 years, though it is longer for those who enter the sample earlier during the BHPS period, particularly if followed into the USoc period.
UKHLS—sample sizes and distribution of education
| . | Men . | Women . | All . |
|---|---|---|---|
| Sample size: number of individuals | |||
| All | 11,899 | 15,144 | 27,043 |
| In BHPS | 3,112 | 3,985 | 7,097 |
| In BHPS and USoc | 630 | 778 | 1,408 |
| Sample size: number of observations | |||
| All | 63,159 | 84,062 | 147,221 |
| In BHPS | 23,841 | 31,732 | 55,573 |
| In BHPS and USoc | 8,825 | 11,069 | 19,894 |
| Median duration of observation spells (years) | |||
| All | 5 | 6 | 6 |
| In BHPS | 7 | 8 | 8 |
| In BHPS and USoc | 18 | 19 | 18 |
| Distribution of education | |||
| GCSEs | 0.460 | 0.474 | 0.468 |
| A-levels | 0.404 | 0.417 | 0.412 |
| University degree | 0.136 | 0.109 | 0.121 |
Notes: The row labels ‘all’, ‘in BHPS’, and ‘in BHPS and USoc’ stand for, respectively, the entire UKHLS sample used in this study, the subset of individuals who enter the sample prior to 2009, and the subset of individuals who enter the sample prior to 2009 and remain until after 2009 or later.
We consider three education groups: GCSEs, representing those who leave education at 16 without completing high-school education; A-levels, representing those with a high-school diploma or equivalent; and degree, representing those who graduate from university (3-year degree). The distribution of education in the population is shown at the bottom of Table 1 . The largest group is that with lower education attainment, and this is true for both men and women. Men in our age group and time window are more likely to have a degree than women, but, as we show, this does not hold in the more recent periods. Only about 12 per cent of our sample has a degree.
Wages are measured in hourly rates built as the ratio of the total gross weekly pay by total hours, both measures including paid and unpaid overtime. We remove aggregate wage growth from the wage rate and trim it at percentiles 2 and 99 from below and above, respectively, to limit the impact of measurement error in wages and hours. All results in monetary quantities are in 2016 prices.
The historical labour supply information is collected in waves 1992, 2001, 2002, 2009, and 2013. It exists for over 70 per cent of our sample. We use the history of employment and working hours to construct, for these years, two experience variables that measure accumulated experience time in part-time and full-time jobs since the beginning of the working life. We then complete the experience variables over the entire observation window using year-on-year information on employment spells and hours.
We complement the UKHLS with data from the British Labour Force Survey (LFS). It is used by the Office for National Statistics to produce official quarterly labour market statistics and has the advantage of being a much larger sample than the UKHLS. We use it for two purposes. First, to show some descriptive evidence of labour market trends. The LFS has a larger sample than the UKHLS, which enables us to characterize trends more accurately when the longitudinal feature of the data is not required. We find similar but more volatile patterns when reproducing the figures on UKHLS data. And second, to construct two measures of ‘women/family friendliness’ of jobs at the industry or occupation levels, that we then merge with the UKHLS data. Specifically, we merge in information on: the percentage of female employees by 3-digit occupation from the SOC classification; the percentage of employees doing part-time hours by occupation at the same level of disaggregation; and the percentage of female managers by 2-digit industry from the SIC classification.
(i)Differences in wages between men and women over time
We start by looking at the long-term trends in the gender wage gap in the UK. As for many other developed economies, gender wage disparities in the UK remain high despite a steady convergence over time since the 1980s. Figure 2 plots the average hourly wages of male and female employees over time according to the LFS. 3 It also plots, in black and on the right-hand axis, the proportional difference between the two. The gap has decreased over the last 20 years from almost 30 per cent in 1993. Currently, the average female employee earns around a fifth less per hour than the average male employee.

Trends in real hourly wages and the gender wage gap Notes : LFS 1993–2018. Real wage rates per hour in 2016 prices; observations in the top one and bottom two percentiles of the wage distribution by gender and year are excluded. Wage gap measured in proportion to male wages.
This wage gap is what it says on the tin: the difference between average female wages and average male wages. It is not a ‘like-for-like’ comparison between otherwise-identical workers or jobs. One reason why wage differentials between men and women might have changed over this period is that their relative levels of education have also changed. This is actually an important aspect to take into account in interpreting the declining wage gap over time.
Figure 3 shows a rapid increase in the level of education of the working population over the past 20 years. The take-up of education happened mostly at the top, with university graduation rates more than doubling over the period, while the proportion of individuals leaving school with minimal qualifications dropped strongly to compensate. The increase in education was faster for women, who overtook men by the late 2000s and are now more likely than men to have a university degree. Because graduates tend to earn more than non-graduates, these differential trends in educational attainment have contributed to reducing the gender wage gap.

Trends in education attainment, by gender Source : LFS 1993–2018.
Figure 4 shows the evolution of the gender wage gap as a proportion of male earnings over time, by education. For those with GCSE-level qualifications, this plot confirms that indeed the gender pay gap has fallen over the past two decades. However, it reveals no clear downward trend for the higher education groups. As a result, there has been a notable change in the nature of the gender wage gap. The gap used to be bigger (in proportional terms) for those with less formal qualifications than for university and high-school graduates, whereas the reverse is now the case. In summary, the fall in the overall gender wage gap over the past 20 years has been driven mostly by the lowest-educated individuals, and by an increase in the number of women who are highly educated.

Trends in the gender wage gap by education Notes : LFS 1993–2018. Wage gap measured in proportion to male wages.
(ii)Children, career patterns, and the gender wage gap over the life-cycle
A crucial starting point for disentangling the drivers of wage differences between men and women, which simple aggregate figures miss, is that those differences evolve over the life-cycle. This in turn is highly related to the arrival of children and changes in labour market behaviour associated with that. Figure 5 shows how average wages for male and female employees relate to their age (pooling those observed at the relevant ages between the start of 1993 and the middle of 2017). Notice that the sets of individuals who are employed at each age are different, so it is possible, for example, that women with low levels of experience return to employment in their 40s, thereby dragging down average female wages at that age. Wages are shown in 2016 constant-wage terms, so the increasing profile with age means that wages increase over the course of life by more than would be expected simply due to economy-wide growth.

Mean hourly wages across the life-cycle by gender and education Notes : LFS 1993 to 2018. Wage rates per hour in constant 2016 wage levels; observations in the top one and bottom two percentiles of the wage distribution by gender and year are excluded.
The figure shows that wages typically increase with age throughout their 20s, for both men and women, which is consistent with the returns to additional experience being especially high for those with little experience. These returns look higher for graduates: their wage profile is especially steep throughout their 20s and, for men, well beyond that.
The gender wage gap is small or non-existent at around the time of labour market entry and it barely widens up to the mid-20s, particularly for college graduates. The gap then opens up more from around the late 20s and gets gradually wider over the next 20 years of the life-cycle. This is because male wages continue to increase, especially for the highly educated, while female wages completely flatline on average.
The opening of the gender wage gap when people reach their late 20s is likely related to the arrival of children. Figure 6 shows this explicitly by plotting the wage gap not by age, but by time to or since the birth of the first child in a family (where zero is the year in which that child is born). There is, on average, a wage gap of over 10 per cent even before the arrival of the first child. A small part of this gap is simply due to age differences—men tend to be slightly older than women when the first child arrives—though the age-adjusted line on Figure 6 still yields a wage gap of 7–12 per cent in the 5 years preceding the first child. A key feature of the patterns shown in the figure is that the gap appears fairly stable until the child arrives, and is small relative to what follows. After the child arrives, there is a gradual but continual rise in the wage gap over the following 12 years, until it reaches around 30 per cent of male wages.

Gender wage gap by time to/since birth of first child Notes : UKHLS 1991 to 2017. Wage gap measured in proportion of male wages. Observations in the top one and bottom two percentiles of the wage distribution are excluded. The age-adjusted series shows the gap obtained from wage rates net of education-specific age effects.
While we measure wages on an hourly basis, and hence differences in working hours cannot directly explain the gender pay gap described above, different working patterns may lead to different hourly pay for more subtle reasons related to productivity, career progression, or other job characteristics. Figure 6 suggests that changes in women’s working patterns after the arrival of children may well be important in explaining this wage gap. The crucial observation is that the wage gap opens up gradually—not in any sudden jump—after the first child arrives and continues to widen for many years after that point. This pattern would be consistent with a gender gap in the level of labour market experience following the same basic shape as the gender gap in wages: relatively stable in the years before childbirth, growing incrementally for many years after that point, before eventually largely stabilizing once more. The next three figures show this.
Figure 7 shows the employment rates of men and women by the time to or since the birth of the first child. Before the arrival of the first child, it is difficult to discern any differences between the employment rates of men and women. However, when the first child arrives, a large employment gap opens up immediately: many women leave paid employment at this point, while any employment responses by men look tiny in comparison, and non-existent for high-school and college graduates. 4

Employment rates of men and women Notes : UKHLS 1991 to 2017.
The employment response among the lowest-educated women is more than double the response among other women. Between one year before and one year after the birth of the child, women’s employment rates drop by 30 percentage points (ppts) for those with GCSEs, 13ppts for those with A levels, and 9ppts for graduates. The other important feature of Figure 7 is that, once the employment gap opens up after the arrival of the first child, it persists. Women’s employment rates do start to rise again once the first child is around school age, but they remain below male employment rates for the full 20 years shown. Hence, the gap in time spent in paid work keeps growing year on year for a long time after the first child arrives.
Figure 8 shows that not only do many women move out of paid employment altogether after having their first child, but many others move to part-time work (recall that part-time is defined as working 5–24 hours per week). Again, the male rate of part-time employment looks essentially unaffected by the arrival of the first child, and the gap that opens up is persistent: women are still significantly more likely to be in this kind of work than men when their first child reaches adulthood.

Proportion of all men and women in jobs of no more than 25 hours per week Notes : UKHLS 1991 to 2017.
Figure 9 shows the direct implications of these patterns: a steadily increasing gap in accumulated labour market experience after the arrival of the first child. By the time their first child is aged 20, women have on average been in paid work for 3 years less than men, comprising 10 years less full-time paid work and 7 years more part-time paid work. The gap is larger still for the low-educated. Previous research (Blundell et al ., 2016) tells us that the 3 years less spent in any form of paid work understates the gender differences in accumulated human capital and that it is the 10-year gap in full-time experience that is more relevant. This is because it is only full-time paid work which seems to have substantial benefits in terms of the accumulation of experience that allows workers to command higher wages in future. We confirm this in the new analysis summarized in the next section, and examine the implications of the lack of wage progression in part-time work for the gender wage gap.

Gender gap in years spent working full-time and part-time Notes : UKHLS 1991 to 2017. The figure cumulates the gender gaps in years of work shown in Figures 6 and 7, and therefore does not include any differences in experience that already exist more than 5 years before the birth of the first child; these earlier differences are negligible.
There are certainly other factors, besides levels of experience in paid work, that may be affected by childbirth and that may contribute to differences in wages between men and women. One possibility is that women undertake different kinds of work upon becoming mothers, potentially in different sectors of the economy. Such changes in job characteristics could be related to their wages for a number of reasons. For example, priorities or constraints could change around the time that children arrive such that women move towards occupations in which the benefits are less skewed towards wages and more towards other factors, such as flexibility. It could also be that a concentration of women in certain occupations or industries allows employers to exercise market power in order to hold wages down if, for example, they know that many of those women have limited ability or desire to search for alternative employment because they are time-constrained or want to work close to home. These different kinds of mechanisms linking occupation, industry, or other job characteristics to the gender wage gap would have very different implications for policy, and it is beyond the scope of this work to disentangle them (and there are many other possibilities besides the examples given). But what we can do is to provide a sense of their likely importance in accounting for the evolution of the gender wage gap.
Figure 10 summarizes three example differences between the occupations and industries that women and men work in, and how these differences evolve around the time of childbirth. We take the occupation or industry that each worker is in, and map this to the composition of the workforce in that occupation or industry (computed from the LFS). As time goes on, women who have children tend (relative to men who have children) to concentrate increasingly in female-dominated occupations, occupations in which part-time work is relatively common, and sectors in which female managers are relatively common. To that extent, there are similarities with the evolution of the gender wage gap—which also grows over the life-cycle, as we have seen. However, a closer look reveals a caveat to that: whereas the gender wage gap is fairly stable in the years before childbirth and then begins to gradually increase from the time of the first child, occupation and industry differences between men and women seem to be on a more uniformly increasing trajectory that starts a few years before the birth of the first child. This may in part be due to job changes in anticipation of having children. But it casts some doubt on the ability of these occupation or industry differences to explain powerfully the shape of the gender wage gap around the birth of the first child.

Gender gaps (men minus women) in characteristics of occupation and industry Notes : UKHLS 1991 to 2017.
So far we have highlighted numerous factors that can play a role in driving the gender wage gap that persists in the UK labour market: education, labour supply choices along the intensive and extensive margins and the resulting work experience accumulation patterns, and characteristics of specific occupations/sectors, jobs, and working arrangements. We now perform a more comprehensive decomposition exercise that allows us to quantify the association between the gender wage gap and these factors. To do so, we estimate a set of wage regressions. We start from a baseline specification that only accounts for demographic controls (age and region). The gender pay gap conditional on these variables is captured by the coefficient of a female dummy. We then proceed to richer specifications by progressively controlling for a number of differences between male and female workers: education and education interacted with age, part-time and full-time experience polynomials interacted with education, industry (2-digit SIC2007 codes) and occupation (3-digit SOC2010 codes), as well as other characteristics of the job including current working hours, indicator for public sector, and a self-reported measure of flexible working arrangements.
Table 2 and Figure 11 displays the estimate coefficients for the female dummy and how it varies as more detailed information about individual characteristics, working history, and the characteristics of the jobs is added to the regression model. The first row in the table shows that the raw gap of 22 log points is only mildly reduced by accounting for gender differences in educational attainment. Gender differences in experience show by far the strongest impact in reducing the gap (compare the estimate in column 3 to those in columns 1 and 2). After controlling for experience in full-time and part-time jobs, the gender gap in wages drops to just below 9 log points. After that, differences in industry and occupation can further reduce the gap by another 2 log points (column 4), and other job characteristics have no further impact (column 5).
Log hourly wage regressions, all education levels
| . | (1) . | (2) . | (3) . | (4) . | (5) . |
|---|---|---|---|---|---|
| Female | –0.223*** (0.003) | –0.194*** (0.003) | –0.087*** (0.003) | –0.067*** (0.003) | –0.069*** (0.003) |
| Age, region | yes | yes | yes | yes | yes |
| Education | no | yes | yes | yes | yes |
| Experience | no | no | yes | yes | yes |
| Occupation, industry | no | no | no | yes | yes |
| Job characteristics | no | no | no | no | yes |
| N | 75,482 |

Gender wage gap by time to/since birth of first child, controlling for association between wages and individual and job characteristics Note : Estimates use UKHLS 1991 to 2017.
Figure 11 shows these results in more detail, by years to/since first childbirth. It highlights that experience has the potential to account for a large amount of the gender wage gap, including the way that it evolves over the life-cycle—albeit still leaving a substantial part of the gender wage gap unexplained (and our causal analysis in the next section confirms this). Industry and occupation differences, by contrast, seem to explain far less.
These results show that opening differences in working experience are likely to be a major driver of the opening differences in the gender pay gap over the course of life. They do not dismiss other drivers as unimportant. Instead, they suggest that the divergence in the careers of men and women happen together with the relative losses in working experience that women go through after childbirth. For instance, one would expect that working experience facilitates moving up the occupational ladder as workers gain the skills necessary for promotions. The consequence of this parallel movement is that, conditionally on working experience, the role of other drivers of wages is less visible. We therefore focus on working experience in what follows, to examine its causal role on gender differences in wages.
IV.Model and estimation
Our estimates so far do not allow us to quantify how the gender wage gap opens with the arrival of children and the role of working experience in driving it because the different processes through which men and women select into work confound these effects. If high-ability women on a steeper wage curve are more likely to remain in work after childbirth than those on lower earnings, while male selection into work is not affected by fatherhood, then our measures of how the gender pay gap opens after childbirth and of the role of working experience in driving that gap will be biased. Indeed, we can see some of that selection in action when contrasting the labour supply behaviour of mothers of young children across education groups, with more-educated women being less likely to interrupt their working careers. In this section we discuss our empirical strategy to identify the causal impact of experience on wages by explicitly accounting for endogenous selection into work. Our model is for women, as variation in experience conditional on age is more meaningful for them. In our simulation exercise later in the paper, we control for pre-birth wages to control for permanent differences in wages between mothers that do and do not interrupt work after childbirth.
(i)Regression model of wages
To measure the causal role of working experience in driving the wages of women, we specify and estimate a simple but flexible model of experience capital accumulation and wages. In all that follows, we fully interact all aspects of the model with education and, hence, consider separately the choices and outcomes of the three education groups that we have studied so far. To simplify the notation, we omit the education index but it is implicit in all parameters below.
Following Blundell et al . (2016), wages are modelled as a simple function of accumulated human capital k . The hourly wage rate w of woman i at age t is simply:
where α i is an individual-specific wage level per unit of experience capital and u it is a time-varying idiosyncratic wage shock. The latter may include a persistent and a transitory component.
We assume that human capital is accumulated in work and consider two positive labour supply points, corresponding to part-time and full-time hours. In line with our previous analysis, these correspond to weekly hours between 5 and 25, and 26 or more, respectively; anyone working 4 or fewer hours per week is considered as not working. Formally, the human capital process is:
and we set the initial value k i 1 to zero. We allow for skills to depreciate in each period at a rate δ and to accumulate while in work at rates π or φ that depend on whether the woman was working part-time or full-time in period t − 1. The rate of human capital accumulation also depends on how many years of working experience the woman has accumulated by the end of period t − 1, denoted by e t −1 . We differentiate between experience in part-time and full-time work, denoted by e P and e F respectively. So e = ( e P , e F ) and the experience accumulation process is simply
The parameters ( π, φ ) are specified as follows:
where ( π j , φ j ) for j = 1, 2, 3 are unknown parameters that we estimate. This setting allows for decreasing returns to additional periods of work if π and φ are decreasing functions of ( e P , e F ).
Our goal here is to consistently estimate the dynamic returns to work and to working hours in order to assess their combined role in driving the gender pay differentials. To do so, we re-write the wage equation (1) in first differences and replace the growth in experience capital using equation (2) and the expressions for ( π j , φ j ). This eliminates human capital, which is not directly observed in the data, and yields our regression equation:
Equation (3) shows that the returns to a year of work for workers with no past work experience ( π 1 , φ 1 ) cannot be distinguished from the depreciation rate. We, therefore, estimate
(ii)Estimation
The direct estimation of equation (3) using the sample of women in continuous work will result in biased estimates of the unknown parameters for three main reasons. The first is the classical employment selection problem, which in our case applies to two consecutive periods. Second, lagged hours are likely correlated with the unobserved term ∆ u if, as usually accepted, hours of work respond to contemporaneous wage shocks. And third, accumulated years of work may also be correlated with ∆ u for two main reasons. The first is more obvious: ∆ u may have a long memory and hence contain information driving past labour supply—something that would happen if, as is frequently assumed, the permanent wage shock is auto-regressive. The second potential source of dependence arises from the conditioning on current and past employment. If, for instance, more experienced workers are more likely to keep working through periods of low unobserved wage growth than less experienced workers, ∆ u t and e t −1 will be correlated in the sample of workers even if they are not in the full sample.
The discussion above highlights the fact that we have various sources of bias that need to be accounted for in estimating the wage regression (3), including the extensive and intensive margins of labour supply and the endogeneity of years of experience in part-time and full-time work. To deal with these, we extend the control function method of Heckman (1979). The details of our method can be found in the on-line Appendix . Here we describe the sources of exogenous variation that we use to construct the control functions that are then included in the regression equation (3).
The first set of excluded variables includes three accounts of the disposable income of each family in each year, by whether the woman did not work, worked part-time hours, or worked full-time hours. These instruments are simulated on a micro-simulation tool that contains a fine description of the direct taxes and benefits in the UK, and how they changed over the entire observation period. 5
They are meant to capture how the sequence of tax and welfare reforms changed the incentives to work of women in different family arrangements. To ensure that the exogenous policy variation is separated from other potentially endogenous sources of variation, we use predicted female wages to calculate her gross earnings by working hours. The predictions are based on a full set of time and age dummies, fully interacted with education. We also set the earned income of the spouse to zero. Finally, we net out aggregate time effects and fixed family demographic effects. The remaining variation in the simulated instruments captures only how policy reforms differentially affect the disposable income of different types of families over time, should the woman not work, work part-time hours, or work full-time hours (see Blundell et al ., 1998). The simulated disposable incomes are complemented with a set of instruments more closely related to accumulated years of working experience, a cubic polynomial in age and the ages of the youngest and oldest children.
All regressions include an additional set of exogenous covariates, including regional dummies and a second order polynomial in two background indices that summarize family background. 6 The first stage regressions also include indicators for the presence of children, presence of a partner, and whether the partner is working.
We estimate our model using UKHLS data for the 1991–2016 period. Estimates of the first stage regressions can be found in the Appendix to this paper, Tables 4–7 . They show that the instruments we are using are strong drivers of the endogenous variables in most cases. As expected, residual simulated disposable income is a stronger determinant of employment and hours of work for women with basic education only, and has less power as a driver of the same outcome among university graduates. In addition, age and age of oldest child are strong predictors of accumulated experience. We test the strength of the set of instruments meant to capture exogenous variation for each of the endogenous variables, and find evidence in support of the instruments in all cases except for hours choices among college graduates (see p -val at the bottom of Table 5 ).
Using these estimates, we then construct the various control functions and include them in our regression model for wage growth. Estimates of the parameters of interest are shown in Table 3 for each of the three education levels. Columns 1, 3, and 5 display estimates by education from the linear regression model, without controlling for employment selection, endogenous hours, or accumulated experience; columns 2, 4, and 6 display the control function estimates. Clearly, controlling for endogenous selection and experience does not much affect the estimate of the experience effects. Figures at the bottom of the table show the p -value for the test of statistical significance of the set of control functions used to tackle endogeneity. They show marginally significant effects for the two lower education groups, but not for the top education group.
Wage regressions, women by education
| . | GCSEs . | . | A levels . | . | University . | . |
|---|---|---|---|---|---|---|
| . | LRM (1) . | CF (2) . | LRM (3) . | CF (4) . | LRM (5) . | CF (6) . |
| Lagged part-time hours | –0.016 | 0.001 | –0.017 | 0.024 | 0.004 | –0.009 |
| (0.010) | (0.018) | (0.012) | (0.023) | (0.027) | (0.064) | |
| lagged full-time experience | –0.000 | 0.000 | –0.001 | –0.001 | –0.003 | –0.003 |
| (0.001) | (0.001) | (0.001) | (0.001) | (0.002) | (0.002) | |
| lagged part-time experience | –0.000 | –0.002 | –0.000 | –0.000 | –0.002 | –0.003 |
| (0.001) | (0.001) | (0.001) | (0.001) | (0.002) | (0.003) | |
| Lagged full-time hours | 0.058** | 0.036** | 0.066** | 0.061** | 0.078** | 0.079** |
| (0.006) | (0.009) | (0.005) | (0.006) | (0.009) | (0.011) | |
| lagged full-time experience | –0.002** | –0.001 | –0.002** | –0.002** | –0.003** | –0.003** |
| (0.000) | (0.001) | (0.000) | (0.000) | (0.000) | (0.001) | |
| lagged part-time experience | 0.000 | –0.001 | –0.001** | –0.001 | –0.001 | –0.004* |
| (0.000) | (0.001) | (0.000) | (0.001) | (0.001) | (0.002) | |
| Observations | 15,027 | 13,341 | 17,908 | 15,118 | 6,762 | 5,946 |
| F-test for control functions | 2.886 | 3.156 | 1.946 | |||
| -val | 0.013 | 0.008 | 0.084 |
Notes : Estimates on UKHLS data for the 1991–2016 period. The column titles ‘LRM’ and ‘CF’ stand for linear regression model and control function, respectively. The F statistic is for the statistical significance of the control functions for employment, lagged employment, lagged hours, and lagged experience in PT and FT hours. All regressions also include a second order polynomial in the two background indices and regional dummies. Bootstrapped standard errors clustered at the individual level in parentheses under the estimated coefficients. * p < 0.05, ** p < 0.01.
The results in row 4 suggest that full-time work has a strong positive impact on wages, and that this effect increases with education. Moreover, the numbers in rows 5 and 6 further suggest that the returns to one additional year of full-time work drop with full-time experience but not with part-time experience. These estimates are consistent with the view that the returns to work drop over the life-cycle as workers accumulate experience, leading to a concave wage profile over the course of working life. It is also evident from the figures in Table 3 that part-time work has little or no impact on wages. Indeed, estimates in rows 1 to 3 show small and statistically insignificant estimates of the impact of part-time work. These figures show that, on average, the wages of women working part-time hours stagnate.
VI.Counterfactual simulations of the cumulative effect of employment and hours of work
We use the control function estimates of our wage equation to run two counterfactual experiments. First, we set all work to be full time. We do this by setting the value of part-time work for future wages to be equal to the estimated value of full-time work. And second, we assume that women work at the same rate as men with the same education and demographic characteristics. We then simulate the experience profiles of women under these two alternative scenarios by assuming that there is no depreciation of market skills during the periods when the woman is not doing paid work. Our counterfactual wages are constructed from observed wages by netting out the experience effect at observed levels of experience and adding the experience effects at the counterfactual levels of experience. Hence, the unobserved component of wages remains unaltered in our simulations.
The possibility that different women select into work as the child grows up is also not changed. All of these will still be reflected in the simulated profiles.
Figure 12 shows the results from these simulations for parents, by time since the birth of the first child and education. In each of the three panels, the top solid line and the bottom dashed line are the observed wage profiles of fathers and mothers, respectively. The plots show how these two lines move apart as the child grows, and they also highlight that the wages of women at best stagnate after childbirth. This holds true for all education groups. In relative terms, the pay differential when the child reaches 18 is remarkably similar across education groups. In all cases, women earn about 30 per cent less than men do at that point in the child’s life.

Counterfactual simulations—hourly wage rate by time since first birth Notes : Based on BHPS data for the 1991–2008 period. 2016 wage levels.
The two intermediate lines in the graph show how employment and working hours after childbirth inhibit wage progression for women. The right-hand-side graph for college graduates suggests that working experience is a determinant factor in explaining the opening gap after childbirth. Given our estimates of the effect of working experience on wages, if college graduate women were to work full-time hours if they worked at all, the wage gap 18 years after childbirth could close up to 50 per cent. If, in addition, they were to work at the same rate as men do, the wage gap at the same age of the child could be further reduced to one-third of the observed level.
However, experience plays a less important role in determining the gender pay gap for workers who do not have a college degree. For these groups, gender differences in pay are comparatively large at childbirth and the gap in accumulated experience after that can only account for about one-third of the gap in pay when the child reaches 18 years of age. Other differences in job characteristics, firm characteristics, occupation, or in how wages are negotiated are likely to play a determinant role in driving gender pay differentials among workers with GCSE and A-level qualifications.
VII.Policy implications
We have shown in the previous section that UK women across all education levels face a so-called child penalty in wages of around 30 per cent with respect to men by the time their oldest child reaches age 18. This result is in line with Kleven et al . (2019 a ) who find long-run (10 years after the first birth) child penalties on earnings between 31 and 34 per cent in the UK and US as opposed to 21–26 per cent in Scandinavian countries and up to 51–61 per cent in Austria and Germany.
These earning gaps are by definition the combined effect of the gap in employment rates, the gap in hours of work, and the gap in hourly wage rates between women and men. Countries differ in the relative importance of these components in determining the overall gap in earnings accumulated by mothers before and after the birth of the first child, depending on the characteristics of their labour markets and on the policies in place. In the UK, as we have shown in our counterfactual simulations, the intensive margin of the labour supply gap (i.e. the prevalence of part-time work among women) drives a significant amount of the observed earnings gap over the life-cycle. The US overall earning gap is similar to the UK one, but the small fraction of women working part-time suggests that the participation and wage components are the relevant drivers there. One reasonable inference from this is that just encouraging or facilitating more mothers to remain in employment after childbirth is not enough to make large inroads into the gender wage gap unless the causes of poor pay progression in part-time work can be addressed. What we find in this study is that it is only full-time employment that appears to promote wage growth.
However, in Scandinavian countries part-time work is not very prevalent and female participation rates are higher than the OECD average, yet earning gaps for mothers still exist. In these countries the earnings gap is smaller than elsewhere and the labour supply gaps still explain a large proportion of it (see Kleven et al . (2019 b ) for estimates for Denmark). Interestingly, the wage gap also opens far less with motherhood in the Scandinavian countries than it does in the UK. This evidence is consistent with our results that, in part, the opening of the gender wage gap among parents builds up as a consequence of the lost experience in work, which may embed lack of occupation progression and failure to move to the best-paying industries, firms, and jobs for mothers. Some southern European countries are found at the opposite extreme, with female employment rates significantly lower than the OECD average and especially large gender earnings gaps, probably driving down the apparent gender earning gaps due to more marked selection of higher-earning women into employment than in other countries. Austria and Germany, instead, are peculiar cases as they show extremely high and persistent earning penalties for women that are combined with high female participation but also especially high rates of part-time work. While all these results are for earnings rather than wages, they seem consistent with our findings that low levels of labour supply at both the intensive and extensive margins have long-term consequences for the earnings ability of mothers.
Some public interventions aimed to promote female employment and fertility have indeed been shown to be important in determining women’s labour market outcomes. We can identify three major policy tools: (i) parental leave; (ii) child care provision; (iii) income support and tax incentives (Olivetti and Petrongolo, 2017). The design and mix of these policies vary widely across countries. Almost all developed countries have adopted paid maternity leave—the exception being the US. The average paid maternity leave across OECD countries is around 18 weeks, with a wide variation across countries in terms of both length and entitlements. Mothers are usually given from a minimum of 13–14 weeks leave around childbirth (e.g. in Norway and Germany) at a replacement rate of 100 per cent of previous earnings, up to a maximum of 9 months at an average of around a 30 per cent replacement rate (as in the UK). 7 Maternity leave policies aim at preserving the labour market attachment of mothers despite temporary interruptions, but they might have undesired effects on women’s wages and career progression as they create incentives for mothers to stay away from their jobs for longer and to create a longer career interruption than would otherwise have been the case. The net effect of parental leave on female employment has been the focus of several empirical studies. Among others, Lalive and Zweimüller (2009) found a significant short-run (first 3 years after childbirth) negative effect on female employment and earnings of an extension of the parental leave from 1 to 2 years that was implemented in Austria in 1990. These negative effects were larger for high-wage women. In 2007 Germany implemented a reform that linked maternity leave benefits to pre-birth income, thus incentivizing high-earning women to take up maternity leave. The reform resulted in delayed return to work and increased part-time employment in the medium run (Kluve and Schmitz, 2014).
The second class of policies, public provision of childcare, can be done through cash transfers or in-kind provision. Spending on childcare varies widely across countries. OECD figures show that spending on early childhood education and care range between almost 2 per cent of GDP in Iceland down to 0.1 per cent in Greece and Turkey; the UK spending at 0.7 per cent of GDP matches the OECD average (see Farquharson (2019)). Subsidized childcare programmes often have several aims, including promoting child development and functioning as transfers to parents, but in relation to labour markets their goal is to facilitate parental (and particularly maternal) labour supply. In countries where there is little private provision of childcare, publicly provided childcare provides an important substitute for parental (and particularly maternal) care. But even where there is a robust private childcare market in place, public childcare subsidies reduce the out-of-pocket costs parents face and, hence, the penalty they face on their effective hourly wage relative to childless workers.
Overall, empirical evidence on the impact of childcare subsidies on maternal labour supply has been mixed. Studies tend to find larger effects in countries where crowd-out is less of a concern (Bauernschuster and Schlotter, 2015); where pre-reform female labour supply is lower (Lundin et al ., 2008); and where initial childcare costs are higher and other barriers to female employment, such as low labour demand or more traditional gender attitudes, are lower (Lefebvre and Merrigan, 2008; Havnes and Mogstad, 2011; Cascio and Schanzenbach, 2013; Givord and Marbot, 2015; Nollenberger and Rodríguez-Planas, 2015). The size of the incentive also matters. For instance, Brewer et al . (2020) find that the provision of free childcare places only affects maternal labour supply significantly if the number of subsidized hours is large enough. Part-time places are unlikely to change mothers’ choices as they do not offer enough flexibility for them to take up paid work. This non-linearity in the effects of interventions has rarely been studied and is key for optimal design.
Lastly, in many countries the tax and transfer system now provides some form of income top-up and tax incentive to low-earning parents. The UK’s Working Tax Credit, following a major expansion of the tax credit system in the late 1990s, has been a prominent example (though it is in the process of being subsumed within universal credit, which is replacing and integrating multiple transfer payments), alongside the US’s Earned Income Tax Credit. The aim of these policies is to top up the incomes of low-earning working families while also encouraging higher rates of employment among those families (especially single parents). There is good evidence for the UK that it achieved these goals (Brewer et al ., 2006; Blundell et al ., 2016).
A third, more profound long-term impact that one might expect to follow from this would be a steeper career trajectory as parents remain more attached to the labour market and build up more experience in work than they would otherwise have done: encouraging them into work would be merely a stepping stone to wage progression. Unfortunately this appears not to have been an outcome in the UK, due to precisely the kinds of wage dynamics uncovered in this paper. The wage returns to experience are generally quite low for those with lower education levels, and they are especially low for those doing part-time work. The means-tested nature of tax credits mean that they disproportionately impact those with lower education levels and they can often incentivize part-time work over full-time work, since they get withdrawn from families if earnings rise too high. Hence the long-term impacts of tax credits on wages have been very limited (Blundell et al ., 2016).
Since the nature of these wage dynamics has only been studied relatively recently, they have not yet been factored in to the design of in-work cash transfers. It may well be that their design can be refined given that we now know a lot more about the longer-term difference in payoffs between part-time and full-time work. That said, it should be noted that its impact on the gender wage gap would still be limited by the fact that means-tested transfers are targeted at those with low pay, who are also disproportionately concentrated in the lowest education group. For them, the impact of even full-time work on future wages is relatively modest. It is in fact highly educated mothers for whom these experience-wage dynamics are largest and who fall furthest behind their male counterparts in the years after childbirth.
The empirical reduced form evaluations cited above shed light on the kinds of reforms most successful at addressing gender wage gaps. However, much of the evidence still focuses mainly on the short- and medium-run impact of policies, whereas the effects of these policies crucially depend on the incentives that women, and households in general, face over the entire life-cycle. Therefore, in order to assess the long-run impact of these policies, one must take into account working experience accumulation. The main contribution of this paper is precisely to provide a simple but flexible empirical framework that features this dynamic mechanism and that can be used to inform policy debate. Our results highlight, for instance, that policies incentivizing mothers of young children to remain actively in full-time work are likely to help their career progression and pay handsomely in the long term, particularly for those mothers with medium to high qualifications.
Taking a broader perspective, it is important to bear in mind that a general cross-country policy recommendation does not exist. Every country has its own mix of policies and each policy should not be analysed in isolation from the specific institutional background in which it is set as its effect depends on what other incentives and protections are there. Moreover, the interaction of public policies with social norms and attitudes towards mothers’ participation in the labour market, that are country-specific and are evolving at different paces across countries, should not be overlooked. Finally, there could be relevant demand effects of public interventions aimed at reducing gender pay and employment gaps. For instance, policies that help bring up the labour supply of mothers may help contain statistical and other types of discrimination differentially affecting wage setting and career progression of men and women (Xiao, 2020).
Gender differences in rates of full-time and part-time paid work after childbirth are an important driver of differences in hourly wages between men and women. This is because they affect the amount and type of labour market experience that men and women build up, and this experience affects the hourly wage levels they can command. In this paper we show that differences in working experience are determinant in explaining the gender pay gap of college graduates, for whom they can explain up to two-thirds of the wage differences 20 years after childbirth. The role of experience in driving the gender wage differences of those with GCSE-level and A-level qualifications is more modest, accounting for about one-third of the gap 20 years after the first childbirth.
It is not only taking time out of paid work that matters; crucially working part-time after childbirth seems to hold back women’s wages. This is because extra experience in full-time work leads to higher hourly wages, whereas extra experience in part-time work does not.
A key challenge for future research, then, is to understand why part-time work shuts down wage progression so much. There are a number of possibilities, including less training provision, missing out on informal interactions and networking opportunities, and genuine constraints placed upon the build-up of skill by working fewer hours. Understanding this properly looks to be of great potential importance for policy-makers who want to address the gender wage gap. Of course, our results also suggest that an alternative (or complementary) focus would be on understanding the causes of gender differences in rates of full-time work in the first place, such as the division of childcare responsibilities.
Our results also show that closing gender gaps in rates of full-time and part-time paid work, or narrowing the difference between the impacts of full-time and part-time paid work on wage progression, cannot be expected to close the gender wage gap fully. This is especially relevant when thinking about the relationship between the gender wage gap and poverty: among lower-educated people, there is already a relatively substantial gender wage gap before the first child is born, and gender differences in full-time and part-time paid work in the subsequent 20 years explain only a minority of the gender wage gap that has built up by that point. Previous research suggests that other contributing factors could include women being less likely to work in more productive firms, less likely to successfully bargain for higher wages within a given firm, and more likely to enter family-friendly occupations over high-paying ones. 8 Better understanding of mechanisms such as these, and their underlying causes, is another key priority for further research.
We are thankful to Richard Blundell, Alex Bryson, Stefania Innocenti, Heather Joshi, Almudena Sevilla, and one anonymous referee for the many insightful comments and suggestions. All errors remain our own. We gratefully acknowledge financial support from the Joseph Rowntree Foundation, the Economic and Social Research Council (ESRC Centre for the Microeconomic Analysis of Public Policy at IFS—grant number ES/M010147/1—and grant numbers ES/K00624X/1 and ES/N015304/1), and the European Union Horizon 2020 programme on Dynamics of Inequality Across the Life-Course (Dial ES00142).
There is a large set of papers looking into other potential drivers of gender gaps that are further away from the focus of this study, including discrimination and pre-market factors such as education (Altonji and Blank, 1999) or sorting and bargaining (Card et al ., 2015).
University of Essex. Institute for Social and Economic Research, NatCen Social Research, Kantar Public. (2017). Understanding Society: Waves 1–7, 2009–16 and Harmonized BHPS: Waves 1–18, 1991–2009. [data collection]. 9th Edition. UK Data Service. SN: 6614.
LFS data is used to produce the time trends presented in this section because its larger sample size captures the trends more accurately; results obtained using UKHLS data produce similar but more irregular patterns.
For the purpose of measuring employment, maternity or paternity leave is treated as being in paid work.
Fortax is a detailed tax and benefit micro-simulation tool that can be used to accurately predict the budget constraints families face by earned income. It accounts in detail for the tax and welfare system in place at each point in time and how they changed over the period of our data. More information can be found in Shephard (2009) and Shaw (2011).
The indices summarize some of the characteristics of the individual’s parental home and are meant to capture permanent individual traits that drive productivity in the labour market and labour supply choices. They are the first two factors from a principal component analysis on a set of variables describing the socio-economic background of the woman. These include her parents’ education and whether they were working when she was 16, whether she lived with both parents at that same age, books at home as a child, ethnicity, number of siblings, and sibling order.
Figures from OECD Family Database.
Others have looked at some of these issues. See, for example, Adda et al . (2017), Card et al . (2015).
Adda , J. , Dustmann , C. , and Stevens , K . ( 2017 ), ‘The Career Costs of Children’ , Journal of Political Economy , 125 ( 2 ), 293 – 337 .
Google Scholar
Altonji , J. G. , and Blank , R. M . ( 1999 ), ‘Race and Gender in the Labor Market’ , Handbook of Labor Economics , 3 , 3143 – 259 .
Attanasio , O. , Low , H. , and Sánchez-Marcos , V . ( 2008 ), ‘Explaining Changes in Female Labor Supply in a Life-cycle Model’, American Economic Review , 98 ( 4 ), 1517 – 52 .
Bauernschuster , S. , and Schlotter , M . ( 2015 ), ‘Public Child Care and Mothers’ Labor Supply—Evidence from Two Quasi-experiments’ , Journal of Public Economics , 123 , 1 – 16 .
Bertrand , M. , Goldin , C. , and Katz , L. F . ( 2010 ), ‘Dynamics of the Gender Gap for Young Professionals in the Financial and Corporate Sectors’ , American Economic Journal: Applied Economics , 2 ( 3 ), 228 – 55 .
Blau , F. D. , and Kahn , L. M . ( 2017 ), ‘The Gender Wage Gap: Extent, Trends, and Explanations’ , Journal of Economic Literature , 55 ( 3 ), 789 – 865 .
Blundell , R. , Duncan , A. , and Meghir , C . ( 1998 ), ‘Estimating Labor Supply Responses Using Tax Reforms’ , Econometrica , 827 – 61 .
— Costa Dias , M. , Meghir , C. , and Shaw , J . ( 2016 ), ‘Female Labor Supply, Human Capital, and Welfare Reform’ , Econometrica , 84 ( 5 ), 1705 – 53 .
Brewer , M. , Cattan , S. , Crawford , S. , and Rabe , B . ( 2020 ), ‘Does More Free Childcare Help Parents Work More?’ , IFS Working Paper W20/9.
Google Preview
— Duncan , A. , Shephard , A. , and Maria Jose , S . ( 2006 ), ‘Did Working Families’ Tax Credit Work? The Impact of In-work Support on Labour Supply in Great Britain’ , Labour Economics , 13 ( 6 ), 699 – 720 .
Card , D. , Cardoso , A. R. , and Kline , P . ( 2015 ), ‘Bargaining, Sorting, and the Gender Wage Gap: Quantifying the Impact of Firms on the Relative Pay of Women’ , The Quarterly Journal of Economics , 131 ( 2 ), 633 – 86 .
Cascio , E. U. , and Schanzenbach , D. W . ( 2013 ), ‘The Impacts of Expanding Access to High-quality Preschool Education’ , Technical Report, National Bureau of Economic Research .
Farquharson , C . ( 2019 ), ‘Early Education and Childcare Spending’ , IFS Briefing Note 258 .
Givord , P. , and Marbot , C . ( 2015 ), ‘Does the Cost of Child Care Affect Female Labor Market Participation? An Evaluation of a French Reform of Childcare Subsidies’ , Labour Economics , 36 , 99 – 111 .
Goldin , C . ( 2014 ), ‘A Grand Gender Convergence: Its Last Chapter’ , American Economic Review , 104 ( 4 ), 1091 – 119 .
Havnes , T. , and Mogstad , M . ( 2011 ), ‘No Child Left Behind: Subsidized Child Care and Children’s Long-run Outcomes’ , American Economic Journal: Economic Policy , 3 ( 2 ), 97 – 129 .
Heckman , J. J . ( 1979 ), ‘Sample Selection Bias as a Specification Error’ , Econometrica , 47 ( 1 ), 153 – 61 .
Kleven , H. , Landais , C. , and Søgaard , J. E. ( 2019b ), ‘Children and Gender Inequality: Evidence from Denmark’ , American Economic Journal: Applied Economics , 11 ( 4 ), 181 – 209 .
— — Posch , J. , Steinhauer , A. , and Zweimuller , J. ( 2019a ), ‘Child Penalties Across Countries: Evidence and Explanations’, in AEA Papers and Proceedings , vol. 109 , 122 – 6 .
Kluve , J. , and Schmitz , S . ( 2014 ), ‘Social Norms and Mothers’ Labor Market Attachment: The Medium-run Effects of Parental Benefits’ , available at SSRN 2471521.
Lalive , R. , and Zweimüller , J . ( 2009 ), ‘How Does Parental Leave Affect Fertility and Return to Work? Evidence from Two Natural Experiments’ , The Quarterly Journal of Economics , 124 ( 3 ), 1363 – 402 .
Lefebvre , P. , and Merrigan , P . ( 2008 ), ‘Child-care Policy and the Labor Supply of Mothers with Young Children: A Natural Experiment from Canada’ , Journal of Labor Economics , 26 ( 3 ), 519 – 48 .
Lundin , D. , Mörk , E. , and Öckert , B . ( 2008 ), ‘How Far Can Reduced Childcare Prices Push Female Labour Supply?’ , Labour Economics , 15 ( 4 ), 647 – 59 .
Nollenberger , N. , and Rodríguez-Planas , N . ( 2015 ), ‘Full-time Universal Childcare in a Context of Low Maternal Employment: Quasi-experimental Evidence from Spain’ , Labour Economics , 36 , 124 – 36 .
Olivetti , C . ( 2006 ), ‘Changes in Women’s Hours of Market Work: The Role of Returns to Experience’ , Review of Economic Dynamics , 9 ( 4 ), 557 – 87 .
— Petrongolo , B . ( 2017 ), ‘The Economic Consequences of Family Policies: Lessons from a Century of Legislation in High-income Countries’ , Journal of Economic Perspectives , 31 ( 1 ), 205 – 30 .
Paull , G . ( 2008 ), ‘Children and Women’s Hours of Work’ , The Economic Journal , 118 , F8 – F27 .
Shaw , J . ( 2011 ), ‘Fortax: UK Tax and Benefit System Documentation’ , Technical Report, IFS Working Papers.
Shephard , A . ( 2009 ), Fortax: Reference Manual .
Xiao , P . ( 2020 ), ‘Wage and Employment Discrimination by Gender in Labor Market Equilibrium’ , mimeo .
Supplementary data
| Month: | Total Views: |
|---|---|
| January 2021 | 23 |
| February 2021 | 768 |
| March 2021 | 1,496 |
| April 2021 | 1,210 |
| May 2021 | 901 |
| June 2021 | 427 |
| July 2021 | 331 |
| August 2021 | 434 |
| September 2021 | 311 |
| October 2021 | 458 |
| November 2021 | 782 |
| December 2021 | 684 |
| January 2022 | 812 |
| February 2022 | 618 |
| March 2022 | 1,159 |
| April 2022 | 1,047 |
| May 2022 | 1,058 |
| June 2022 | 430 |
| July 2022 | 402 |
| August 2022 | 430 |
| September 2022 | 365 |
| October 2022 | 712 |
| November 2022 | 1,027 |
| December 2022 | 656 |
| January 2023 | 710 |
| February 2023 | 399 |
| March 2023 | 709 |
| April 2023 | 632 |
| May 2023 | 609 |
| June 2023 | 214 |
| July 2023 | 248 |
| August 2023 | 219 |
| September 2023 | 244 |
| October 2023 | 397 |
| November 2023 | 417 |
| December 2023 | 341 |
| January 2024 | 333 |
| February 2024 | 358 |
| March 2024 | 377 |
| April 2024 | 400 |
| May 2024 | 249 |
| June 2024 | 44 |
Email alerts
Citing articles via.
- Recommend to Your Librarian
Affiliations
- Online ISSN 1460-2121
- Print ISSN 0266-903X
- Copyright © 2024 Oxford University Press and Oxford Review of Economic Policy Limited
- About Oxford Academic
- Publish journals with us
- University press partners
- What we publish
- New features
- Open access
- Institutional account management
- Rights and permissions
- Get help with access
- Accessibility
- Advertising
- Media enquiries
- Oxford University Press
- Oxford Languages
- University of Oxford
Oxford University Press is a department of the University of Oxford. It furthers the University's objective of excellence in research, scholarship, and education by publishing worldwide
- Copyright © 2024 Oxford University Press
- Cookie settings
- Cookie policy
- Privacy policy
- Legal notice
This Feature Is Available To Subscribers Only
Sign In or Create an Account
This PDF is available to Subscribers Only
For full access to this pdf, sign in to an existing account, or purchase an annual subscription.
Merit Sticks to Men: Gender Pay Gaps and (In)equality at UK Russell Group Universities
- ORIGINAL ARTICLE
- Open access
- Published: 12 May 2022
- Volume 86 , pages 544–558, ( 2022 )
Cite this article
You have full access to this open access article

- Carol Woodhams ORCID: orcid.org/0000-0002-9703-1107 1 ,
- Grzegorz Trojanowski 2 &
- Krystal Wilkinson 3
6258 Accesses
4 Citations
2 Altmetric
Explore all metrics
Academic studies of gender pay gaps within higher education institutions have consistently found pay differences. However, theory on how organisation-level factors contribute to pay gaps is underdeveloped. Using a framework of relational inequalities and advanced quantitative analysis, this paper makes a case that gender pay gaps are based on organisation-level interpretations and associated management practices to reward ‘merit’ that perpetuate inequalities. Payroll data of academic staff within two UK Russell Group universities ( N = 1,998 and 1,789) with seeming best-practice formal pay systems are analysed to determine causes of gender pay gaps. We find marked similarities between universities. Most of the variability is attributed to factors of job segregation and human capital, however we also delineate a set of demographic characteristics that, when combined, are highly rewarded without explanation. Based on our analysis of the recognition of ‘merit,’ we extend theoretical explanations of gender pay gap causes to incorporate organisation-level practices.
Flexible Working, Work–Life Balance, and Gender Equality: Introduction

Investigating the relationship between career planning, proactivity and employability perceptions among higher education students in uncertain labour market conditions
Does board gender diversity influence financial performance evidence from spain.
Avoid common mistakes on your manuscript.
Introduction
The UK Higher Education (HE) sector has historically been male dominated, with evidence of horizontal and vertical segregation (Fagan & Teasdale, 2021 ). Job segregation by gender is also an international phenomenon (Macarie & Moldovan, 2015 ; Peng et al., 2017 ; Rabovsky & Lee, 2018 ). There is evidence for the closing of the HE gender gap internationally in recent decades (Baker, 2016 ) and an improvement in research outputs (Nielsen, 2016 ) and high-level jobs (Fritsch, 2015 ) for female academics. Inequalities persist, however. The causes of gender pay disparities are complex and multi-layered, but analysis of them in the higher education sector, and more generally, is theoretically and empirically incomplete. Smith ( 2009 ), for example, draws on self-report quantitative data to signal a significant gap between men and women academic staff in the UK between and within grades, and explores the implications, but not the causes, of these gaps. Traditionally, theoretical frameworks that explain gender pay differences take investment in one’s own skills and productivity as the starting point (Becker, 1975 ). However, this is a limited view that assumes that skill supply and demand will be fairly rewarded according to the logics of the market. The role of the employer in this link is overlooked.
In the current study we respond to calls to 'bring the firm back into the conceptualisation of inequalities' (Tomaskovic-Devey & Avent-Holt, 2019 , p. 7), drawing on how the relational and social construction of ‘merit’ may be connected to the power and status of workers to influence pay. Krefting ( 2003 ), for example, concludes that women faculty achievements have a lower salary pay-off, which refers to a slower time to tenure, slower time to promotion to full professor, and they earn less than men with comparable backgrounds and accomplishments. Additionally, a range of demographic (Hargens & Long, 2002 ), personal, and institutional factors (Howe-Walsh & Turnbull, 2016 ) have been linked to gender inequality, with the latter including an organisational perception of additional ‘merit’ attributed to men. Though informative, the reliance on qualitative data in these studies limits the generalisability of these findings. The current research rigorously examines ‘lower salary pay-offs’ within men’s and women’s faculty careers, and the potential for subjective and intangible ‘merit’ to be attached to certain bodies (Simpson & Kumra, 2016 ; Thornton, 2013 ).
Most publications on pay differences in HE draw conclusions from national or sectoral datasets meaning that they cannot illuminate patterns at the organisation level (i.e., Madrell et al., 2016 ). By and large, published pay data is usually aggregated, cloaking the role of organisation-level causes such as unequal promotion rates, unequal length of service, faculty specialisms, hours of engagement, types of contracts, the role of qualifications, and ultimately if and how organisational reward practices in relation to ‘merit’, sustain pay gaps. Using internal pay data at the individual employee level linked to personal employment history, we show that it is possible to account for the influence of these factors plus many others. Analysis can isolate the implications of each, building a picture of which characteristics and job patterns are most highly rewarded. These studies are rare due to the challenges of accessing comprehensive individual-level organisation data (for exceptions see Gonäs & Bergman, 2009 ; Travis et al., 2009 ). The current paper aims to enhance our understanding of causes of pay disparities in HE, criticising the effectiveness of organisation equality practice to challenge an institutionalised construction of ‘merit’ in two UK Russell Group universities.
The Russell Group is a catch-all term for 24 universities in the UK renowned for world-class research excellence and academic achievement (university league tables), including the Universities of Oxford and Cambridge (Russell Group, n.d. ). We negotiated access to employee level data; it is not normally available. The paper addresses the following research questions: (1) Is there a gender pay gap at our case- study universities and what factors explain it? (2) What does our analysis reveal about how higher education pay allocation is influenced by perceived ‘merit’?
Determinants of Pay Gaps in Higher Education
Underlying causes of the inequality gap in a whole range of industries, and specifically in higher education, are hotly disputed. Human capital theorists (e.g., Becker, 1975 ) seek to explain disparities in terms of differences in skills and experience between different groups of workers (Jacobsen, 2003 ). Women and men are seen as making different choices around the accumulation and deployment of education and skills linked to perceptions of what will bring the greatest returns, given their family commitments (Toutkoushian et al., 2007 ; Uhly et al., 2017 ). They have different ways of managing the work-life interface (Xiaoni & Caudle, 2016 ), different plans for engagement with paid work over the life-course (Metcalf, 2009 ) and have less work continuity and labour market experience due to part-time employment (Perna, 2005 ). Empirical evidence for the human capital approach specifically in relation to Higher Education comes from studies that account for human capital investment, performance measures, and type of university as explanators, and report gender pay gaps of 22% and 6.8% after controls inserted (Umbach, 2007 ).
Critics draw attention to the limitations of human capital theory, emphasising that preferences are underpinned by the gendered context of HE (Perna, 2005 ). Pay penalties in HE may emerge indirectly from the unequal effects of being segregated into types of institution, academic disciplines, contracts, and work roles that women are better able to manage alongside an uneven division of domestic work – but which have lower prestige and value. Cama et al. ( 2016 ) reported on a range of studies arguing that gender pay gaps cannot be explained by differences in individual, faculty, and institutional attributes, leaving open the possibility that there are organisational, cultural, and Human Resource (HR) effects. Gaps may also emerge because of discretionary pay practices which have the effect of disadvantaging groups in the way that 'merit' is constructed (Elvira & Graham, 2002 ). Typical of the UK HE sector, the two universities in our study formally abide by a framework of 'meritocratic' principles (Littler, 2018 ). Both deploy an objective reward system based on job evaluation plus a range of ‘best’ HR equality measures designed to overcome structural obstacles. We now discuss the potential of these measures to eliminate gender pay gaps, along with feminist critiques.
Recognising ‘Merit’ in Pay Structure Design in the UK’s HE Sector
Academic pay is determined within a market-based allocative system which seeks to reward individual effort, agency, and achievement. In theory, the design of the pay system is to produce standardised pay decisions, pegged to an objective scale, reducing flexibility and managerial discretion (Reskin, 2000 ). The establishment of a sector-wide joint negotiating committee in 2001 included the objective ‘to modernise pay arrangements with the specific aim of promoting equality, transparency and harmonisation to ensure equal pay is delivered for work of equal value’ (UCEA, 2008 : 3 as cited in Perkins & White, 2010 ). Almost all UK institutions, including our research sites, implemented the framework. The assumption is those who are not highly rewarded are not disadvantaged by unjust or discriminatory organisational practices, but rather because of their lack of personal merit (Simpson & Kumra, 2016 ); being abilities, achievements and ‘deservingness’ (Thornton, 2013 ). There are links to be made here with post-feminist governance regimes (Lewis, 2017 ) where the structural inequalities foregrounded in second-wave feminism are said to have been overcome, meaning women’s experience is dictated by their individual merit alone and feminist collective objection or action is redundant.
Critiques of Assumptions of ‘Merit’ in HE
There arelimits to assumptions of the equality of ‘merit’ between genders. Scholars argue that a socially acceptable postfeminist subjectivity requires the simultaneous performance of both ‘ideal worker’ (Acker, 1990 ) masculinity in terms of ambition, drive, and active planning, but also femininity in terms of emotional nurturing behaviour (Hochschild, 1983 ) and personal appearance (Lewis, 2017 ). As men are not required to demonstrate such dual behaviours, it can be argued that standards of ‘merit’ are unequal. Simpson and Kumra ( 2016 ) and Simpson et al. ( 2020 ) observe how narratives of ‘merit’ and ‘deservingness’ intertwine and become a gendered issue – with deservingness relying on subjective evaluations based, in part, on personal values and normative expectations – which stands in contrast to merit, which is typically presented in the HE context as an objective, gender-neutral measure, based upon qualifications and the capacity of the individual to apply them to job-related tasks (Castilla, 2008 , 2012 ; Castilla & Bernard, 2010 ; Simpson et al., 2020 ). Taken together, it is argued, merit fails to ‘stick’ to female bodies. Castilla and Bernard ( 2010 ) term this the ‘meritocracy paradox': that systems that appear to reward skills and effort may involve processes that entrench discrimination. Understandings of ‘merit’ have been and continue to be determined by those at the highest levels of the organisational hierarchy–dominated by men, although there is some interest in the rise of women in positions of power (see Huffman, 2013 ), meaning that the benchmark for success is often based upon masculine traits and the male life-course. Simpson and Kumra ( 2016 ) add that such bias is largely hidden by the desire to see merit in fixed, universal terms (Sen, 2000 ) where it can assuage concerns about unequal allocations of power and authority and provide a discursive mechanism by which inequality is justified.
It follows that merit will also fail to stick to the bodies of other individuals who differ from the white, male, able-bodied ‘ideal worker,’ which has been found in other studies, including those that study the intersectional effects of gender alongside demographic factors such as ethnicity, class, family education history and disability on employment outcomes (Bowleg, 2008 ; Crew, 2020 ; Rickett & Morris, 2021 ; Śliwa & Johansson, 2014 ; Woodhams et al., 2015 ). Whilst an espoused meritocracy, the UK HE sector is responding to significant labour market pressures, which challenge attempts to ensure standard and transparent reward allocation. Government funding has been withdrawn, so the sector is in a period of rapid global reform. To compete for global talent, pressure is brought to bear to ensure that salaries are flexible. For example, in both case study universities, following a selection panel, senior managers debate a salary point to offer based on perceived ‘deservingness’. The full grade range is available including ‘discretionary’ points in ‘exceptional’ circumstances. Pay offers are almost always negotiated (see Gamage et al., 2020 ), maybe with less motivation from female academics (Sarfaty et al., 2007 ). The agreed pay outcome is put to HR for approval and is rarely rejected. Enhanced pay increments can also be negotiated within-role as a retention payment. Subjective assessments of ‘merit’ have potential to undermine equitable outcomes.
Best Practice Equality and the ‘Merit’ Principle
It is recognised that women may be particularly constrained in demonstrating their ‘merit’ due to a range of factors such as additional responsibilities in the home domain, stereotyping and discrimination (Lewis & Simpson, 2010 ; Lips, 2013a , b ). To give them full opportunity to develop, a raft of university initiatives has been introduced (Saltmarsh & Randell-Moon, 2015 ). In our two chosen universities, initiatives cover flexible hours of work and location (Rafnsdóttir & Heijstra, 2013 ) plus a variety of academic contract types, including part-time working, fixed-term working, and term-time working. To assist with social capital development, several women’s leadership and mentoring initiatives have been introduced (see Gallant, 2014 ). Both universities hold Athena Swan awards (Advance HE, n.d. ), an external audit of good diversity practice. At least one department in each holds the highest gold level award. Compulsory training ensures equality and diversity compliance. The modern HE landscape is thus aligned with broader discussions of neoliberal feminism (Rottenberg, 2018 ) viewing the ideal neoliberal feminist subject as a ‘balanced woman’ (Rottenberg, 2014 ) who can manage a professional job role alongside intensive caring responsibilities. Neoliberal structures and cultures emphasise individual competition and merit and suggest the ‘ideal worker’ (Acker, 1990 ) is one unencumbered by responsibilities outside of work. Whilst our female academic subject might note the structures that disadvantage her as a woman (thus differentiating the neo-liberal subjectivity from the postfeminist one), she looks inwardly, guided by these workplace equality initiatives that focus on individual action and adaptation (around working hours and better ‘leaning in’ to organisational structures) to resolve the tension, rather than looking towards collective action to change underlying structures.
There is also criticism from gender scholars concerning interpretation of meritocratic principles within HE, arguing that activities that are seen to be meritorious are those on which men spend more time and have greater success. The highest valued activities when it comes to pay and progression in academia are entrepreneurial research activities (Priola, 2007 ; Thornton, 2013 ), including peer-reviewed publications in high-ranking academic journals and citation figures. There is some evidence that men outperform women in these metrics (Monroe et al., 2008 ), but this is by no means universal (Nakhaie, 2007 ; Nielsen, 2016 ; Shauman & Xie, 2003 ). Female academics tend to spend more time on pastoral work, as they are expected to be nurturing and accommodating to student requests (El-Alayli et al., 2018 ) and undertake the bulk of administration and citizenship activities (Perna, 2005 ). Male academics engage in greater institutional mobility than women academics (Leemann, 2010 ), enabling networking and increased opportunities to collaborate (Loacker & Sliwa, 2015 ). Universities tend to be sites where patriarchal relations and gendered hierarchies of power flourish to the disadvantage of women (Bagilhole & Goode, 2001 ).
Policy Implications
There are significant policy implications in this area. The UK’s Athena Swan, Gender Equality Charter Mark (Madrell et al., 2016 ) and Gender Pay Gap mandatory reporting initiatives are all shedding light on pay gaps at the employer level. These initiatives raise awareness of pay gaps and provide data that is useful in making sectoral comparisons. However, given that reported data is aggregated, there are limitations in their usefulness in illuminating comparative and potentially unfair reward practices at the employee level. Our analysis addresses that gap.
Ethical approval was sought and obtained from the University of Exeter prior to the analysis of this data. Data is secondary in nature. Data is confidential and storage arrangements complied with General Data Protection Regulations.
Sample Characteristics
Tables 1 and 2 provide descriptive statistics for two Russell Group universities that comprised the analysis. The two universities are matched in their gender spilt being 43% and 44% female. Ethnic origin data is categorised into sixteen categories. Nationality data is given in 76 categories in one university and 54 in the other. To ensure viable categories for analytical purposes they were recategorized into White/BME and British/non-British dummy variables. In University 1, 85% of men and 89% of women identify as white. Sixty-six percent of men and 61% of women identify as British. University 2 is matched with corresponding figures of 90%, 89%, 70% and 63%, respectively. Disabled status is self-nominated at the point of recruitment or by updating the self-service HR administration platform. Disabled workers comprise 4% of the workforce in both universities. Sex is given in binary format. Maternity leave taken in the past five years (yes/no) is a dummy variable for women only. The maternity leave variable cannot be added to a fully-fledged Oaxaca-Blinder decomposition as it is meaningfully defined for female academics only. It is not included in the main analyses reported. We add a note below explaining its effects entered in the regression equation.
Grade and seniority are denoted in five hierarchical bands (Associate Lecturer, Lecturer, Senior Lecturer, Reader and Professor, in order of seniority). In both universities, men are significantly more likely to be more senior in higher grades. Men have significantly longer length of service (LOS; 6.18 and 9.25 years for men, compared with 5.41 and 6.84 for women) and significantly more years in the HE sector (8.83 years compared with 8.07 for women) in University 1, but less in University 2 (11.58 years compared with 15.29). Most staff (75% and 92%) hold a doctorate as their highest-level qualification.
The dependent variable is salary. Individual payroll data was obtained for all academics employed by University 1 ( N = 1,998) and University 2 ( N = 1,789). Payroll data has greater reliability than self-reported pay (see Leslie et al., 2017 ) and greater validity for investigating the connection of employment histories to pay than aggregated data (van Wanrooy et al., 2013 ). Salary data is taken for a single month (Feb 2018 for University 1 and July 2018 for University 2). To protect the anonymity of the universities we obscure certain features including the organisation’s location in the UK. Support staff are excluded.
The salary structure in both universities is a multi-grade single pay spine linked to tenure and grade and based on a Higher Education Role Analysis job evaluation exercise. Starting salary is based on qualifications, experience, perceived merit, and previous salary. Movement between grades is determined by promotion into a different role. Scheduled pay raises (so-called 'increments') are awarded annually (as of 1 August each year) until the job holder reaches the top of the normal grade range. Each grade, except Professor, then has four to five ‘discretionary’ points that can be used to recognise extra ‘merit’. Professorial salaries are personally negotiated, subject to university-specific banding of pay. Starters and leavers have been removed from the dataset. Full-time equivalent (FTE) pay has been created to remove the effects of part-time working. Both universities award increments during maternity leave.
Salaries are attached to a common UK HE intuitions 51–point pay scale (UCU, 2022 ). There is considerable variation between universities in attaching grades to pay scale points, for example in one university a Reader grade applicant might be appointed between scale point 45 (currently £52,559) and scale point 50 (currently £60,905) and in another, the Reader scale might sit between points 41 and 47. However, internally, a university will always (in theory) appoint staff in the same academic grade to the same range of scale points. University 2 has awarded their female professors a one-off salary uplift (mean of £3,435) following Essex University (BBC News, 2016 ). The uplift was applied in Sept 2016 with reference to the mean of male professorial salaries in the discipline and taking account of length of service.
Analytic Strategy
To examine the first research question on the reasons for gender pay differences, we calculate simple mean gender differences in base pay rates. We then make use of regression analysis, which isolates gender pay differences if all other variables are held constant. This is, of course, hypothetical as men and women are rarely matched, so we use the Oaxaca-Blinder decomposition (OBD) technique (Blinder, 1973 ; Oaxaca, 1973 ). This technique identifies the extent to which pay gaps are due to the different 'endowments' of men and women. Endowments constitute differences between men and women that are meaningful within pay allocation; in other words, their simultaneous distribution across ranks of well-rewarded and less well-rewarded features. For ease of reporting, we have bundled these features into a) demographic (being age, gender, disability, ethnicity and nationality), b) human capital (education, length of service, and length of service in HE), and finally c) segregation and job (faculty of employment, grade & seniority, type of contract, duration of contract, and whether FT or PT). This analytic technique examines which differences and in what proportion men’s and women’s 'endowments' create the gender pay gap.
To address the second research question, we further explore the outcomes of the OBD highlighting the different rates of financial return to endowments, known as 'coefficients' and 'interaction' elements. These elements reveal whether having the same feature, for example a doctorate, results in a differential financial return for men, vis a vis women. Where, and if, this occurs, we consider this to be pay discrimination and indicative of an unbalanced institutionalised interpretation of salary-worthy ‘merit.’
Research Question 1
The mean salary for men academics is £50,050 and £42,192 for women ( t = 9.21, p < .001, see Table 1 ) in University 1 and £54,668 and £46,556 in University 2 ( t = 9.48, p < .001, see Table 2 ). Despite differences between universities in pay levels, gender pay differences are consistent. University 1 has a gender disparity of £8,308, or 15.7% and University 2 has £8,112 or 14.8%, favoring men. Table A1 (University 1) and A2 (University 2) in the online appendix provide mean pay based on demographic and job-related characteristics. Based on this initial analysis, we can only draw limited conclusions on ways that job, work, and personal characteristics underlie gender pay differences. To explore further, we first conduct regression analysis and then undertake Oaxaca-Blinder decomposition analyses (Jann, 2008 ).
Tables 3 and 4 give results of pooled and subsample regression analyses. Regression analysis is informative because it shows the effect on pay of a single characteristic isolated from others. The pooled (men and women) sample shows that a significant proportion of pay is explained by factors of horizontal and vertical segregation (i.e., faculty and grade), however segregation is not the only effect. Experience at the university (University 2) and in the HE sector (University 1) is positively correlated with salary, as is age and job family at both universities. Education level is not a strong predictor of wage in this sector, except that in University 2 having an ‘other’ qualification creates a significant disadvantage of £4,140 per year. After inserting all controls, detriments of £1,070 and £1,272 for women are attached to gender.
The origins of the alarming and unexplainable pay difference can be explored first via subsample regression analysis. Regression analysis measures the differences between men and women in their pay as if all other characteristics are equal. Tables 3 and 4 show that employment factors are not equally rewarded, and not always in the expected direction. For example, in both universities, men experience a penalty compared with women for being in a Humanities faculty (-£3,140 compared with -£1,932 in University 1 and -£3,012 compared with -£745 in University 2) with similar patterns in Social Science faculties. Similarly, men are paid less in every grade in University 2, when all other factors are accounted for, and in all except the Professorial grade in University 1. There is also a difference between how men and women are rewarded for length of service at both universities; men being rewarded for short service at both universities. Whilst this is an interesting analysis, it is hypothetical one because it assumes all characteristics other than gender are identical. But gender career differences are dynamic and interactional and regression analysis is imprecise as to whether and to what extent each difference contributes to the actual pay disparity between men and women. For this we turn to an OBD. What follows is an explanation of those findings.
Endowment Effects
Decomposing the pay gap shows consistency between universities. In total, as shown within Tables 5 and 6 , a total of over 81% (£6,335.60) of the gender gap at University 1 and 79% (£6,554.21) at University 2 is attributable to gender differences in bundles of endowments: being demographic, human capital, and segregation/ job characteristics. In other words, most of the pay gap is explained by differences in the way that men and women engage with the jobs, roles, and disciplines that are linked to higher [or lower] pay. A further 12% (£904.51) in University 1 and 11.9% (£978.70) in University 2 per year is due to gender differences in coefficients – i.e. differences in the way these endowments attract reward. The remaining 7% (£563.62) and 8.6% (£706.42) is due to the interaction of gender differences in coefficients and the strength of their effects.
More specifically, most of the pay gap in both universities pertains to job segregation. For example, although like-for-like women are paid more, for example, in a Reader role (as above), the fact that they are underrepresented in Reader and Professorial grades is key. If women academics were as likely to reach the Professor grade as men, the annual gender pay gap would shrink by £5,518.14 at University 1 and £6,825.93 in University 2. Additionally, women are over-represented in the low-paid research-only job family in University 1 and teaching-only job family in University 2, adding to the gender pay gap. Women are over-represented in the lowest-paying faculty (Faculty of Humanities) in University 1 and under-represented in the highest-paying faculty (Faculty of Social Sciences) in University 2. In University 2, women are over-represented in the lower-paying academic grades. Job segregation in seniority and faculty, then, explains over three-quarters of the gender discrepancy in pay in both universities (with Professoriate under-representation solely accounting for over 70%). Differences in demographic and human capital endowments also contribute to the gender disparity in pay. Since women academics are, on average, slightly younger and age has a strong positive association with pay, age constitutes another source of gender pay differences. Differences in LOS at University 1 (men have more service) also helps to explain their higher pay.
Research Question 2
We have seen that segregation (i.e., differences in ways that men and women engage in HE careers), accounts for the majority, but not all the pay difference. There are also uneven gender effects in the financial return to these features, which can be seen in the coefficient and interaction columns of Tables 5 and 6 . For example, whilst women academics being younger and less likely to hold senior academic positions contributed to the pay gap (as above), the coefficient component indicates that age and seniority have a higher return for equal endowments for men academics. Being older benefits men by £288.15 per year in University 1 and £370.33 in University 2, but women 'return' less than half (£142.17 and £170.90 per annum) of this for the exact same feature (i.e. being a year older). This unequal return to age accumulates year-on-year to contribute £5,939.98 / £8,577.29 in favour of men to the gender pay gap. Moreover, we know fewer women academics have reached the Professorial grade, however the coefficient column shows that women in University 1 reap a significantly smaller financial return after achieving it (explaining £243.33 of the gender pay gap) compared to their otherwise-equal male peers. In other words, there seems to be a 'double-whammy' discriminating effect for women: not only are they less likely to possess the characteristics associated with higher pay, even those who do so, are under-paid in comparison. University 2 appears to have staved off these effects, perhaps via their targeted salary uplift in 2016.
The effects of differences in coefficients pertaining to age and seniority are partly offset by gender differences in the effect of the length of service at both universities. Women benefit from longer tenure (reducing the pay gap by £1,889.52 / £1,278.25 pa). Whilst this might seem positive, it indicates that men, because they gain through age, but not length of service, benefit more from increased mobility. Men move more often, and this works to their financial benefit.
Differences in the financial return to demographic features are also important. At University 1, all else being equal, being British is lucrative for men academics but not women (explaining £842.15; more than 10% of the pay gap). At University 2, being white is a benefit for men only, returning an additional £1,792.81 per year into their pay packets. There is also a small, yet statistically significant, gender difference in the effects that disability has on pay in University 1, to the benefit of disabled women; and a larger advantage to women working in Humanities and the Arts in university 2 of £480.13 annually.
Interaction Effects
The aforementioned effects of age and length of service are further strengthened by the significant differences in the effects of interactions of coefficients and endowments in both datasets. For instance, the age interaction component is positive as the returns to age for men tend to be greater, while at the same time they have higher values attached to the age variable.
This paper has analysed payroll data from two UK Russell Group universities with formal payment schemes, based on incremental pay scales and job evaluation. By controlling for human capital, job segregation, and demographic variables, our findings suggest flaws with the way that gender pay differences are regarded and being addressed in academic institutions. The findings help us understand how ‘merit’ is represented within the ostensibly 'objectively determined' pay scales of both universities. As we might anticipate, most ‘merit’ is attributed to seniority and length of service. However, these features are not equally rewarded between men and matched women. The seniority effect is disproportionately advantageous (in pay terms) when attached to men. Men are rewarded for mobility while women are rewarded for loyalty. And a significant proportion of our gender pay gap is linked to features that are not of direct relevance. Men are rewarded in one university for Britishness and the other for whiteness. There are small advantages for women, but these are less numerate and not as financially advantageous.
To elaborate, our findings pertaining to our first research question support previous observations around occupational segregation in explaining pay gaps, i.e., that through conformance to social role (Eagly, 1987 ), individual preference (Hakim, 2000 ) or discriminatory treatment (Lips, 2013a ), women are under-represented in highly-paid academic roles (Doucet et al., 2012 ), and higher-paying grades (Ornstein et al., 2007 ) and over-represented in wage-depressed women-dense disciplines (Reskin & Roos, 2009 ). We show that women and men have different ‘endowments’ (i.e., men are more likely to be older and to be a Professor) that pay out to men’s advantage. Good equality practices such as those within the Athena Swan accreditation, will, if effective, decrease pay differences in relation to these factors. However, our analysis also shows in line with neo-liberal critiques that the benefit of investing in remedies like these will be limited because of organisation-level management practices.
Analysis pertaining to the second research question demonstrated that even if women were to become equally endowed, a significant proportion of the pay gap will be left untouched. Equally endowed women at University 1 earn less like-for-like in the Professorial grade. In both, they earn less each year for equal age. It could be argued that these variations stem from cohort-level differences in human capital, with older women accumulating less quality experience, even if their qualifications and length of service match, however prior literature argues that cohort effects are less significant than life-cycle effects, i.e. ageism in academia (Maguire, 1995 ). It could also be the case that the gender-specific returns to age might result from career breaks stemming from maternity leave periods, however when the maternity leave dummy is included in the regression model the main effect is not significant and other results are upheld. Additionally, length of service is most strongly rewarded if it is short and if the academic is male. Our overall finding is that women have a significant pay penalty, for reasons of segregation (which might also contain discriminatory influences that are hidden from our view), but most importantly because they do not have features in common with older white or British professors who frequently move universities.
There are two inferences here. The first inference in our findings is that pay judgements in academia are made based on an organisational-level understanding of ‘merit’ that ‘sticks’ to certain types of men’s bodies, specifically, white and British older Professors with a record of mobility. This finding supports previous work that shows how these features are of benefit to men. Results of ‘wisdom’ studies show that older men are more likely than older women to be regarded as cognitively ‘wise’ (Ardelt, 2009 ; Baltes et al., 1995 ), and that men, rather than women, inhabit the role of ‘Professor’, not ‘Teacher’, with ease (Miller & Chamberlin, 2000 ). Job mobility is lucrative for academics; however, women feel the need to build and sustain a reputation with their employer to demonstrate competence (Blackaby et al., 2005 ; Booth et al., 2003 ) rather than moving jobs to demonstrate ambition. Women remain on the margins in academia trying to prove their skills whilst men strategize reputation (Krefting, 2003 ). Finally, intersectional ethnic academic women appear to be disproportionately disadvantaged by the combination of ethnicity and nationality and gender in comparison with ethnic men and white women (Eaton et al., 2020 ; McCall, 2005 ).
The second inference points to the failure of formalised payment systems in standardising starting and ongoing salary awards. It might be that women’s actual or perceived inability to negotiate better salary packages into the discretionary grade points is the cause (Dittrich et al., 2014 ). It is well known that negotiation is a complex skill that is deeply ingrained in societal gender roles (Bowles & Babcock, 2013 ); women are less likely to be well-evaluated when they initiate negotiations (Bowles et al., 2005 ) and more likely to receive backlash (Amanatullah & Tinsley, 2013 ; Dannals et al, 2021 ; Rudman, 1998 ; Williams & Tiedens, 2016 ) which may serve to discourage them.
Limitations and Future Research Directions
There are limitations to the generalisability of our work. The paper is based on two cases with reputations for best-practice equality. Both are in the elite research-intensive group. Given the similarities between the two cases, it is highly likely that similar findings would be realised elsewhere in UK universities with a similar best practice-approach and use of standardised national pay and reward structures. However, higher pay gaps and greater wage dispersion has been found in research-intensive universities, so findings may differ in institutions that differently emphasise research output (Bailey et al., 2016 ; Mumford & Sechel, 2020 ). There are also limitations to validity of the data given that we do not have a full set of covariates on productivity/performance and how this might inform promotion and extra-ordinary decisions around base pay. Analysis of social class data, which was not available in this dataset, would add a valuable dimension of understanding for scholars interested in intersectional studies. To further strengthen our understanding of ways that organisations produce and reproduce unequal personifications of a ‘meritorious’ academic in future research projects, we encourage researchers to replicate our methodology in different universities and country contexts, comparing our outcomes with those achieved in organisations with different, and maybe less flexible, reward arrangements. We encourage studies that delve more deeply into the effects of intersecting identities on the causes of gender pay gaps for academics.
Practice Implications
Our findings have specific implications for human resource management professionals and senior leaders in HE and beyond, as they suggest flaws in the ways that gender pay differences are reproduced at the organisational level. In order to tackle the systemic problems highlighted in this paper, we recommend that alongside the typical package of positive action recruitment and promotion measures, such as mentoring (Cullen & Luna, 1993 ), changes are needed around how pay is structured and determined, as both appear to unfairly disadvantage women that are otherwise equally endowed. For example, we recommend the removal of ‘discretionary’ pay points that are typically used in circumstances where staff persistently self-proclaim their ‘merit’ to their managers, creating shorter pay scales which leave less room for managerial subjectivity to choose between pay points. We also recommend stronger guidance on the way that pay is set on appointment. A specific recommendation for University 1 is an immediate salary uplift of the type implemented at University 2. We also recommend positive action measures are extended to recognise the intersectional effects of gender with other disadvantaging personal characteristics such as nationality, ethnicity, and age. Our findings also have implications for academic women working/seeking work in UK HE institutions who may be unaware of their disadvantaged intersectional positioning, due to the principles of ‘meritocratic ideology’ underpinning existing structures and postfeminist/neoliberal feminist discourse. They are encouraged to explore collective forms of agency more akin to second-wave feminist action, such as vocal protest against pay disparities and engagement in trade union action.
Explanations of gender pay gaps are complex and multi-layered. In part, as previously identified in higher education, they result from differences in occupational segregation (Blau & Kahn, 2017 ), which is being tackled in many universities via established equality practice. Our findings, however, indicate additional contributors to pay gaps linked to intersecting features, for example increased age is less advantageous for women, and disability potentially less advantageous for men, and how organisation-level recognition of ‘merit’ sticks to certain bodies, enabled by specific and widespread reward practices. In conclusion we argue that pay structures premised on ‘meritocracy’, and initiatives that aim to level the playing field for academic women under the banner of 'best practice' reinforce postfeminist or neoliberal feminist sensibilities. Women academics, unknowingly complicit, look inwardly for the resolution of disadvantage whilst structures continue to discriminate against them.
However, our primary point here is that salary negotiation involves two parties and responsibility lies with those that carry institutional authority to recognise and reward to ensure that perceived ‘merit’ does not cloud judgement. We contend that our research raises awareness that the organisational space in which resource allocation takes place is influenced by socially defined relational power inequalities (Tomaskovic-Devey & Avent-Holt, 2019 ) that shape perceptions of ‘meritorious’ and ‘deserving’ features.
Data Availability
Data is held by each institution. We have a contract to publish with express agreement, but not to share data.
Code Availability
STATA code available on request.
Acker, J. (1990). Hierarchies, jobs, bodies: A theory of gendered organizations. Gender & Society, 4 (2), 139–158. https://doi.org/10.1177/089124390004002002
Article Google Scholar
Advance HE. (n.d.). Athena Swan Charter . https://www.advance-he.ac.uk/equality-charters/athena-swan-charter
Amanatullah, E., & Tinsley, C. (2013). Punishing female negotiators for asserting too much…or not enough: Exploring why advocacy moderates backlash against assertive female negotiators. Organizational Behavior and Human Decision Processes, 120 (1), 110–122. https://doi.org/10.1016/j.obhdp.2012.03.006
Ardelt, M. (2009). How similar are wise men and women? A comparison across two age cohorts. Research in Human Development, 6 (1), 9–26. https://doi.org/10.1080/15427600902779354
Bailey, J., Peetz, D., Strachan, G., Whitehouse, G., & Broadbent, K. (2016). Academic pay loadings and gender in Australian universities. Journal of Industrial Relations, 58 (5), 647–668. https://doi.org/10.1177/0022185616639308
Bagilhole, B., & Goode, J. (2001). The contradiction of the myth of individual merit, and the reality of a patriarchal support system in academic careers: A feminist investigation. European Journal of Women's Studies, 8 (2), 161–180. https://doi.org/10.1177/135050680100800203
Baker, M. (2016). Women graduates and the workplace: Continuing challenges for academic women. Studies in Higher Education, 41 (5), 887–900. https://doi.org/10.1080/03075079.2016.1147718
Baltes, P. B., Staudinger, U. M., Maercker, A., & Smith, J. (1995). People nominated as wise: A comparative study of wisdom-related knowledge. Psychology and Aging, 10 (2), 155. https://doi.org/10.1037/0882-7974.10.2.155
Article PubMed Google Scholar
BBC News. (2016). University wipes out gender pay gap with salary hike . https://www.bbc.co.uk/news/education-36444063
Becker, G. (1975). Human capital: A theoretical and empirical analysis, with special reference to education . University of Chicago Press.
Google Scholar
Blackaby, D., Booth, A., & Frank, J. (2005). Outside offers and the gender pay gap: Empirical evidence from the UK academic labour market. The Economic Journal, 115 (501), F81–F107. https://doi.org/10.1111/j.0013-0133.2005.00973.x
Blau, F. D., & Kahn, L. M. (2017). The gender wage gap: Extent, trends, and explanations. Journal of Economic Literature, 55 (3), 789–865. https://doi.org/10.1257/jel.20160995
Blinder, A. S. (1973). Wage discrimination: Reduced form and structural estimates. The Journal of Human Resources, 8 (4): 436–455. https://doi.org/10.2307/144855
Booth, A. L., Francesconi, M., & Frank, J. (2003). A sticky floors model of promotion, pay, and gender. European Economic Review, 47 (2), 295–322. https://doi.org/10.1016/S0014-2921(01)00197-0
Bowleg, L. (2008). When Black + lesbian + woman ≠ Black lesbian woman: The methodological challenges of qualitative and quantitative intersectionality research. Sex Roles, 59 , 312–325. https://doi.org/10.1007/s11199-008-9400-z
Bowles, H. R., & Babcock, L. (2013). How can women escape the compensation negotiation dilemma? Relational accounts are one answer. Psychology of Women Quarterly, 37 (1), 80–96. https://doi.org/10.1177/0361684312455524
Bowles, H. R., Babcock, L., & McGinn, K. L. (2005). Constraints and triggers: Situational mechanics of gender in negotiation. Journal of Personality and Social Psychology, 89 (6), 951. https://doi.org/10.1037/0022-3514.89.6.951
Cama, G. M., Jorge, L. M., & Peña, A. F. J. (2016). Gender differences between faculty members in higher education: A literature review of selected higher educational journals. Educational Research Review, 18 , 58–69. https://doi.org/10.1016/j.edurev.2016.03.001
Castilla, E. J. (2008). Gender, race, and meritocracy in organizational careers. The American Journal of Sociology, 113 (6), 1479–1526. https://doi.org/10.1086/588738
Castilla, E. J. (2012). Gender, race, and the new (merit-based) employment relationship. Industrial Relations: A Journal of Economy and Society, 51 (s1), 528–562. https://doi.org/10.1111/j.1468-232X.2012.00689.x
Castilla, E. J., & Benard, S. (2010). The paradox of meritocracy in organizations. Administrative Science Quarterly, 55 (4), 543–676. https://doi.org/10.2189/asqu.2010.55.4.543
Crew, T. (2020). Higher education and working-class academics . Springer International Publishing.
Cullen, D. L., & Luna, G. (1993). Women mentoring in academe: Addressing the gender gap in higher education. Gender and Education, 5 (2), 125–137. https://doi.org/10.1080/0954025930050201
Dannals, J. E., Zlatev, J. J., Halevy, N., & Neale, M. A. (2021). The dynamics of gender and alternatives in negotiation. Journal of Applied Psychology, 106 (11), 1655–1672. https://doi.org/10.1037/apl0000867
Dittrich, M., Knabe, A., & Leipold, K. (2014). Gender differences in experimental wage negotiations. Economic Inquiry, 52 (2), 862–873. https://doi.org/10.1111/ecin.12060
Doucet, C., Smith, M., & Durand, C. (2012). Pay structure, female representation and the gender pay gap among university professors. Relations Industrielles/ Industrial Relations, 67 (1), 51–75. https://doi.org/10.7202/1008195ar
Eagly, A. H. (1987). Sex differences in social behavior: A social-role interpretation. Lawrence Erlbaum Associates, Inc.
Eaton, A. A., Saunders, J. F., Jacobson, R. K., & West, K. (2020). How gender and race stereotypes impact the advancement of scholars in STEM: Professors’ biased evaluations of physics and biology post-doctoral candidates. Sex Roles, 82 (3), 127–141. https://doi.org/10.1007/s11199-019-01052-w
El-Alayli, A., Hansen-Brown, A. A., & Ceynar, M. (2018). Dancing backwards in high heels: Female professors experience more work demands and special favor requests, particularly from academically entitled students. Sex Roles, 79 , 136–150. https://doi.org/10.1007/s11199-017-0872-6
Elvira, M. M., & Graham, M. (2002). Not just a formality: Pay system formalisation and sex- related earnings effects. Organisation Science, 13 (6), 601–617. https://doi.org/10.1287/orsc.13.6.601.499
Fagan, C., & Teasdale, N. (2021). Women professors across STEMM and non-STEMM disciplines: Navigating gendered spaces and playing the academic game. Work, Employment and Society, 35 (4), 774–792. https://doi.org/10.1177/0950017020916182
Fritsch, N. (2015). At the leading edge – does gender still matter? A qualitative study of prevailing obstacles and successful coping strategies in academia. Current Sociology, 63 (4), 547–565. https://doi.org/10.1177/0011392115576527
Gallant, A. (2014). Symbolic interactions and the development of women leaders in Higher Education. Gender, Work and Organization, 21 (3), 203–216. https://doi.org/10.1111/gwao.12030
Gamage, D. D. K., Kavetsos, G., Mallick, S., & Sevilla, A. (2020). Pay transparency initiative and gender pay gap: Evidence from research-intensive universities in the UK. IZA Discussion Paper No. 13635 https://www.iza.org/publications/dp/13635/pay-transparency-initiative-and-gender-pay-gap-evidence-from-research-intensive-universities-in-the-uk
Gonäs, L., & Bergman, A. (2009). Equal opportunities, segregation and gender-based wage differences: The case of a Swedish university. The Journal of Industrial Relations, 51 (5), 669–686. https://doi.org/10.1177/0022185609346198
Hakim, C. (2000). Work-lifestyle choices in the 21st century: Preference theory . Oxford University Press
Hargens, L. L., & Long, J. S. (2002). Demographic inertia and women’s representation among faculty in higher education. The Journal of Higher Education, 73 (4), 494–517. https://doi.org/10.1080/00221546.2002.11777161
Hochschild, A. R. (1983). The managed heart . University of California Press.
Howe-Walsh, L., & Turnbull, S. (2016). Barriers to women leaders in academia: Tales from science and technology. Studies in Higher Education, 41 (3), 415–428. https://doi.org/10.1080/03075079.2014.929102
Huffman, M. L. (2013). Organizations, managers, and wage inequality. Sex Roles, 68 , 216–222. https://doi.org/10.1007/s11199-012-0240-5
Jacobsen, J. (2003). The human capital explanation for the gender gap in earnings. In K. Moe (Ed.), Women, family, and work: Writings on the economics of gender . Blackwell.
Jann, B. (2008). The Blinder-Oaxaca decomposition for linear regression models. The Stata Journal, 8 (4), 453–479. https://doi.org/10.1177/1536867X0800800401
Krefting, L. (2003). Intertwined discourses of merit and gender: Evidence from academic employment in the USA. Gender, Work and Organisation, 10 (2), 260–278. https://doi.org/10.1111/1468-0432.t01-1-00014
Leemann, R. (2010). Gender inequalities in transnational academic mobility and the ideal type of academic entrepreneur. Discourse: Studies in the Cultural Politics of Education, 31 (5), 605–625. https://doi.org/10.1080/01596306.2010.516942
Leslie, L., Flaherty Manchester, C., & Dahm, P. (2017). Why and when does the gender gap reverse? Diversity goals and the pay premium for high potential women. Academy of Management Journal, 60 (2), 402–432. https://doi.org/10.5465/amj.2015.0195
Lewis, P., & Simpson, R. (2010). Meritocracy, difference and choice: Women’s experiences of advantage and disadvantage at work. Gender in Management: An International Journal, 25 (3), 165–169. https://doi.org/10.1108/17542411011036374
Lips, H. M. (2013a). The gender pay gap: Challenging the rationalizations, perceived equity, discrimination, and the limits of human capital models. Sex Roles, 68 , 169–185. https://doi.org/10.1007/s11199-012-0165-z
Lips, H. M. (2013b). Acknowledging discrimination as a key to the gender pay gap. Sex Roles, 68 , 223–230. https://doi.org/10.1007/s11199-012-0245-0
Littler, J. (2018). Against meritocracy: Culture, power and myths of mobility (1st ed.). Routledge.
Loacker, B., & Sliwa, M. (2015). Moving to stay in the same place?’ Academics and theatrical artists as exemplars of the ‘mobile middle. Organization, 23 (5), 657–679. https://doi.org/10.1177/1350508415598247
Macarie, F. C., & Moldovan, O. (2015). Horizontal and vertical gender segregation in higher education: EU 28 under scrutiny. Managerial Challenges of the Contemporary Society. Proceedings, 8 (1): 162.
Madrell, A., Strauss, K., Thomas, N., & Wyse, S. (2016). Mind the gap: Gender disparities still to be addressed in UK Higher Education geography. Area, 48 (1), 48–56. https://doi.org/10.1111/area.12223
McCall, L. (2005). The complexity of intersectionality. Signs, 30 (3), 1771–1801. https://doi.org/10.1086/426800
Metcalf, H. (2009). Pay gaps across the equality strands: A review. Equality and Human Rights Commission Research Report 14 . https://www.equalityhumanrights.com/sites/default/files/research-report-14-pay-gaps-across-equality-strands.pdf
Miller, J., Chamberlin, M. (2000). Women are teachers, men are professors: A study of student perceptions. Teaching Sociology , 28 (4) 283–298. https://doi.org/10.2307/1318580
Monroe, K., Ozyurt, S., Wrigley, T., & Alexander, A. (2008). Gender equality in academia: Bad news from the trenches, and some possible solutions. Perspectives on Politics, 6 (2), 215–233. https://doi.org/10.1017/S1537592708080572
Mumford, K., & Sechel, C. (2020). Pay and Job Rank among Academic Economists in the UK: Is Gender Relevant? British Journal of Industrial Relations, 58 (1), 82–113. https://doi.org/10.1111/bjir.12468
Nakhaie, M. R. (2007). Universalism, ascription and academic rank: Canadian professors, 1987–2000. Canadian Review of Sociology/revue Canadienne De Sociologie, 44 (3), 361–386. https://doi.org/10.1111/j.1755-618X.2007.tb01190.x
Nielsen, M. (2016). Gender inequality and research performance: Moving beyond individual-meritocratic explanations of academic advancement. Studies in Higher Education, 41 (11), 2044–2060. https://doi.org/10.1080/03075079.2015.1007945
Oaxaca, R. (1973). Male-female wage differentials in urban labor markets. International Economic Review, 14 (3), 693–709. https://www.jstor.org/stable/2525981
Ornstein, M., Stewart, P., & Drakich, J. (2007). Promotion at canadian universities: The intersection of gender, discipline, and institution. Canadian Journal of Higher Education, 37 (3), 1–25.
Peng, Y. W., Kawano, G., Lee, E., Tsai, L. L., Takarabe, K., Yokoyama, M., Ohtsubo, H., & Ogawa, M. (2017). Gender segregation on campuses: A cross-time comparison of the academic pipeline in Japan, South Korea, and Taiwan. International Journal of Gender, Science and Technology , 9 (1), 3–24. http://genderandset.open.ac.uk/index.php/genderandset/article/view/409
Perkins, S. J., & White, G. (2010). Modernising pay in the UK public services: Trends and implications. Human Resource Management Journal, 20 (3), 244–257. https://doi.org/10.1111/j.1748-8583.2009.00125.x
Perna, L. (2005). Sex difference in faculty tenure and promotion: The contribution of family ties. Research in Higher Education, 46 , 277–307. https://doi.org/10.1007/s11162-004-1641-2
Priola, V. (2007). Being female doing gender. Narratives of women in education management. Gender and Education , 19 (1), 21–40. https://doi.org/10.1080/09540250601087728
Rabovsky, T., & Lee, H. (2018). Exploring the antecedents of the gender pay gap in US higher education. Public Administration Review, 78 (3), 375–385. https://doi.org/10.1111/puar.12827
Rafnsdóttir, G., & Heijstra, T. (2013). Balancing work-family life in academia: The power of time. Gender, Work and Organization, 20 (3), 283–296. https://doi.org/10.1111/j.1468-0432.2011.00571.x
Reskin, B. F. (2000). The proximate causes of employment discrimination. Contemporary Sociology, 29 (2), 319–328. https://doi.org/10.2307/2654387
Reskin, B. F., Roos, P. A. (2009). Job queues, gender queues: Explaining women's inroads into male occupations. Temple University Press.
Rottenberg, C. A. (2014). Happiness and the liberal imagination: How superwoman became balanced. Feminist Studies, 40(1) , 144–168. https://doi.org/10.15767/feministstudies.40.1.144
Rottenberg, C. A. (2018). The rise of neoliberal feminism . Oxford University Press.
Book Google Scholar
Rudman, L. A. (1998). Self-promotion as a risk factor for women: The costs and benefits of counterstereotypical impression management. Journal of Personality and Social Psychology, 74 (3), 629. https://doi.org/10.1037/0022-3514.74.3.629
Saltmarsh, S., & Randell-Moon, H. (2015). Managing the risky humanity of academic workers: Risk and reciprocity in university work-life balance policies. Policy Futures in Education, 13 (5), 662–682. https://doi.org/10.1177/1478210315579552
Sarfaty, S., Kolb, D., Barnett, R., Szalacha, L., Caswell, C., Inui, T., & Carr, P. L. (2007). Negotiation in academic medicine: A necessary career skill. Journal of Women’s Health, 16 (2), 235–244. https://doi.org/10.1089/jwh.2006.0037
Sen, A. (2000). Merit and justice in meritocracy and economic inequality, in K. Arrow, S. Bowles, & S. N. Durlauf, (Eds.), Meritocracy and inequality . Princeton University Press.
Shauman, K. A., Xie, Y. (2003). Explaining sex differences in publication productivity among postsecondary faculty. In L.S Hornig (Ed.), Equal rites, unequal outcomes (pp. 175–208). Springer.
Simpson, R., & Kumra, S. (2016). The Teflon effect: When the glass slipper meets merit. Gender in Management: An International Journal, 31 (8), 562–576. https://doi.org/10.1108/GM-12-2014-0111
Simpson, R., Kumra, S., Lewis, P., & Rumens, N. (2020). Towards a performative understanding of deservingness: Merit, gender and the BBC pay dispute. Gender, Work and Organisation, 27 (2), 181–197. https://doi.org/10.1111/gwao.12397
Śliwa, M., & Johansson, M. (2014). The discourse of meritocracy contested/reproduced: Foreign women academics in UK business schools. Organization, 21 (6), 821–843. https://doi.org/10.1177/1350508413486850
Smith, M. (2009). Gender, pay and work satisfaction in a UK university. Work, Employment and Society, 16 (5), 621–641. https://doi.org/10.1111/j.1468-0432.2008.00403.x
Thornton, M. (2013). The mirage of merit: Reconstituting the ’ideal academic’. Australian Feminist Studies, 28 (76), 127–143. https://doi.org/10.1080/08164649.2013.789584
Tomaskovic-Devey, D., & Avent-Holt, D. (2019). Relational inequalities: An organizational approach . Oxford University Press.
Toutkoushian, R., Bellas, M., & Moore, J. (2007). The interaction effects of gender, race, and marital status on faculty salaries. The Journal of Higher Education, 78 (5), 572–601. https://doi.org/10.1080/00221546.2007.11772330
Travis, C., Gross, L., & Johnson, B. (2009). Tracking the gender pay gap: A case study. Psychology of Women Quarterly, 33 (4), 410–418. https://doi.org/10.1111/j.1471-6402.2009.01518.x
Uhly, K., Visser, L., & Zippel, K. (2017). Gendered patterns in international research collaborations in academia. Studies in Higher Education, 42 (4), 760–782. https://doi.org/10.1080/03075079.2015.1072151
Umbach, P. (2007). Gender equity in the academic labour market: An analysis of academic disciplines. Research in Higher Education, 48 , 169–192. https://doi.org/10.1007/s11162-006-9043-2
van Wanrooy, B., Bewley, H., Bryson, A., Forth, J., Freeth, S., Stokes, L., & Wood, S. (2013). Employment relations in the shadow of recession: Findings from the 2011 Workplace Employment Relations Study . Palgrave MacMillan.
Williams, M. J., & Tiedens, L. Z. (2016). The subtle suspension of backlash: A meta-analysis of penalties for women’s implicit and explicit dominance behavior. Psychological Bulletin, 142 (2), 165–197. https://doi.org/10.1037/bul0000039
Woodhams, C., Lupton, B., & Cowling, M. (2015). The presence of ethnic minority and disabled men in feminised work: Intersectionality, vertical segregation and the glass escalator. Sex Roles, 72 , 277–293. https://doi.org/10.1007/s11199-014-0427-z
Xiaoni, R., & Caudle, D. (2016). Walking the tightrope between work and non-work life: Strategies employed by British and Chinese academics and their implications. Studies in Higher Education, 41 (4), 599–618. https://doi.org/10.1080/03075079.2014.942277
Download references
Acknowledgements
We are grateful for the provision of data from the two anonymised university institutions and to the anonymous reviewers for their comments.
Research was not directly funded.
Author information
Authors and affiliations.
Surrey Business School, University of Surrey, Surrey, UK
Carol Woodhams
University of Exeter Business School, Exeter, UK
Grzegorz Trojanowski
Manchester Metropolitan University Business School, Manchester, UK
Krystal Wilkinson
You can also search for this author in PubMed Google Scholar
Contributions
All authors contributed to the study conception and design. Material preparation, data collection and analysis were performed by Carol Woodhams and Grzegorz Trojanowski. The first draft of the manuscript was written by Krystal Wilkinson and Carol Woodhams and all authors commented on previous versions of the manuscript. All authors read and approved the final manuscript.
Corresponding author
Correspondence to Carol Woodhams .
Ethics declarations
Conflicts of interest.
We do not have conflicts of interest or competing interests to declare.
Additional information
Publisher's note.
Springer Nature remains neutral with regard to jurisdictional claims in published maps and institutional affiliations.
Supplementary Information
Below is the link to the electronic supplementary material.
Supplementary file1 (DOCX 18 KB)
Rights and permissions.
Open Access This article is licensed under a Creative Commons Attribution 4.0 International License, which permits use, sharing, adaptation, distribution and reproduction in any medium or format, as long as you give appropriate credit to the original author(s) and the source, provide a link to the Creative Commons licence, and indicate if changes were made. The images or other third party material in this article are included in the article's Creative Commons licence, unless indicated otherwise in a credit line to the material. If material is not included in the article's Creative Commons licence and your intended use is not permitted by statutory regulation or exceeds the permitted use, you will need to obtain permission directly from the copyright holder. To view a copy of this licence, visit http://creativecommons.org/licenses/by/4.0/ .
Reprints and permissions
About this article
Woodhams, C., Trojanowski, G. & Wilkinson, K. Merit Sticks to Men: Gender Pay Gaps and (In)equality at UK Russell Group Universities. Sex Roles 86 , 544–558 (2022). https://doi.org/10.1007/s11199-022-01277-2
Download citation
Accepted : 28 February 2022
Published : 12 May 2022
Issue Date : May 2022
DOI : https://doi.org/10.1007/s11199-022-01277-2
Share this article
Anyone you share the following link with will be able to read this content:
Sorry, a shareable link is not currently available for this article.
Provided by the Springer Nature SharedIt content-sharing initiative
- Gender pay gap
- UK Russell Group
- Discrimination
- Relational inequalities
- Find a journal
- Publish with us
- Track your research
Tell us whether you accept cookies
We would like to use cookies to collect information about how you use ons.gov.uk .
We use this information to make the website work as well as possible and improve our services.
You’ve accepted all cookies. You can change your cookie settings at any time. Hide
- Release calendar
- Methodology
Gender pay gap in the UK: 2023
Differences in pay between women and men by age, region, full-time and part-time, and occupation.
This is the latest release. View previous releases
Contact: Email Nicola J White
Release date: 1 November 2023
Next release: To be announced
Table of contents
- Other pages in this release
- Main points
The gender pay gap
- Gender pay gap data
- Measuring the data
- Strengths and limitations
- Related links
- Cite this statistical bulletin
Print this Statistical bulletin
Download as PDF
1. Other pages in this release
Commentary on topics covered in the Annual Survey of Hours and Earnings (ASHE) is split between three separate bulletins. The other two can be found on the following pages:
Employee earnings in the UK (from Annual Survey of Hours and Earnings): 2023
Low and high pay in the UK: 2023
2. Main points
The gender pay gap has been declining slowly over time; over the last decade it has fallen by approximately a quarter among full-time employees, and in April 2023 it stands at 7.7%.
There remains a large difference in the gender pay gap between employees aged 40 years and over and those aged under 40 years.
Compared with lower-paid employees, the gender pay gap among higher earners is much larger, however this difference has decreased in recent years.
The gender pay gap has decreased across all major occupational groups between 2022 and 2023.
The gender pay gap in skilled trades occupations remains the largest of the major occupational groups, however, it has also decreased by the largest amount over the past years.
The gender pay gap among full-time employees is higher in every English region than in Wales, Scotland or Northern Ireland.
The gender pay gap measures the difference between average hourly earnings (excluding overtime) of men and women as a proportion of men's average hourly earnings (excluding overtime). It is a measure across all jobs in the UK, not of the difference in pay between men and women for doing the same job.
The Annual Survey for Hours and Earnings (ASHE) is based on employer responses for a 1% sample of employee jobs, using HM Revenue and Customs Pay As You Earn (PAYE) records to identify individuals' current employer. Throughout this bulletin, the terms 'jobs' and 'employees' are used interchangeably.
3. The gender pay gap
Figure 1: the gender pay gap has been declining slowly over time, falling by approximately a quarter over the last decade among full-time employees and all employees, gender pay gap for median gross hourly earnings (excluding overtime), uk, april 1997 to 2023.
Source: Annual Survey of Hours and Earnings from the Office for National Statistics
- Vertical lines represent discontinuities in the 2006, 2011 and 2021 ASHE because of a change in occupation coding.
- Estimates for 2023 data are provisional.
- Employees are on adult rates, pay is unaffected by absence unless furloughed.
- Full-time is defined as employees working more than 30 paid hours per week (or 25 or more for the teaching professions).
- Figures represent the difference between men's and women's hourly earnings as a percentage of men's hourly earnings excluding overtime.
Download this chart Figure 1: The gender pay gap has been declining slowly over time, falling by approximately a quarter over the last decade among full-time employees and all employees
The gender pay gap has been declining slowly over time. Over the last decade it has fallen by approximately a quarter among both full-time employees and all employees.
In 2023, the gap among full-time employees increased to 7.7%, up from 7.6% in 2022. This is still below the gap of 9.0% before the coronavirus (COVID-19) pandemic in 2019. Among all employees, the gender pay gap decreased to 14.3% in 2023, from 14.4% in 2022, and is still below the levels seen in 2019 (17.4%).
The gender pay gap reported by the Office for National Statistics is a long time-series, calculated from the Annual Survey of Hours and Earnings (ASHE) which samples from all employee jobs in all sizes of company. The ASHE gender pay gap analysis is different from the gender pay gap based on compulsory reporting; since 2017, organisations employing 250 or more employees have been required by the UK government to publish and report specific figures about their gender pay gap. This is done across all their employees, not differentiated by full-time and part-time status. No findings from that initiative are reported in this publication.
The gender pay gap for part-time employees stayed consistent at negative 3.3%, however, over the long term the upward trend in the part-time gender pay gap seen since 2015 is continuing.
The gender pay gap is higher for all employees than it is for full-time employees or part-time employees. This is because women fill more part-time jobs , which in comparison with full-time jobs have lower hourly median pay. ASHE data shows that in 2023 approximately 86% of male employees were in full-time jobs, compared with approximately 61% of female employees.
Figure 2: The gender pay gap for full-time employees aged 40 years and over is much higher than for employees aged below 40 years
Gender pay gap for full-time median gross hourly earnings (excluding overtime), by age group, uk, april 1997 to 2023.
- The age group for those aged 16 to 17 years has been excluded from this chart because of sample size volatility.
- Figures represent the difference between men's and women's hourly earnings as a percentage of men's hourly earnings.
Download this chart Figure 2: The gender pay gap for full-time employees aged 40 years and over is much higher than for employees aged below 40 years
The clearest insight into the gender pay gap is provided by analysis across age groups. For groups aged under 40 years, the gender pay gap for full-time employees (which is a more comparable basis than all employees for measuring differences in hourly pay) is low, at 4.7% or below. This has been the case since 2015.
However, for the age group for those aged 40 to 49 years and older, the gender pay gap for full-time employees is much higher, at 10.3% or higher. The gender pay gap increased across all age groups between 2022 and 2023, except for those aged 18 to 21 years where it decreased from 1.1% to negative 0.2%. The largest increase was seen among employees aged 30 to 39 years, where the gender pay gap increased from 2.3% to 4.7%. This is the highest value of the gender pay gap for this age group since 2009.
The gender pay gap for full-time employees aged 60 years and over is currently the largest of all age groups. Between 2022 and 2023, the gender pay gap for this group has increased from 13.5% to 14.2%.
Figure 3: The gender pay gap fell for all occupational groupings from 2022 to 2023, with the largest fall coming from skilled trades occupations
Gender pay gap for full-time median gross hourly earnings (excluding overtime), by occupation, uk, april 2022 and april 2023.
- Figures represent the difference between men’s and women’s hourly earnings as a percentage of men’s hourly earnings.
- Occupations are defined by the Standard Occupational Classification (SOC) 2020.
Download this chart Figure 3: The gender pay gap fell for all occupational groupings from 2022 to 2023, with the largest fall coming from skilled trades occupations
Median hourly earnings excluding overtime is higher for males than it is for females among full-time employees in each of the nine main occupation groups. However, this difference has fallen in all occupation groups since last year, which continues the downward trend in the gender pay gap by occupation.
The following occupation groups saw the largest gender pay gap decrease for 2023 compared with 2022: skilled trades occupations (down 3.3 percentage points), sales and customer service occupations (down 2.0 percentage points) and administrative and secretarial occupations (down 1.9 percentage points).
Figure 4: Fewer women in their 40s and 50s are in occupations such as managers, directors and senior officials, at an age when pay for these occupations typically increases
Median gross hourly earnings (excluding overtime) by the percent of full-time employees in each group that are women, for age and occupation group, uk, 2023.
- Employees are on adult rates, pay is unaffected by absence.
Figure 4 highlights the specific occupation types that women mainly work in. The clearest insight into the gap between those aged under 40 years and those aged 40 years and over can be obtained by looking at the proportion of full-time employees who are women in the higher-paid occupation groups (such as managers, directors and senior officials) where the proportion is lower among those aged 40 to 49 years and those aged 50 to 59 years. This is important because not only is the average pay in that occupation nearly 20% higher for employees aged 40 to 49 years than it is for employees aged 30 to 39 years, but the proportion of women also decreases. Although less pronounced, a similar trend can also be observed in professional and associate professional employees.
The proportion of women in these age groups in the higher-paid professional, associate professional, and managers, directors and senior officials groups remains below 50% for all age groups. The difference in earnings between employees aged under 40 years and those aged 40 years and over is also much larger for these occupational groupings than it is for the others.
In comparison with full-time women employees aged between 30 and 39 years, those aged 40 to 49 years are more likely to work in most of the lower-paid occupations, and in many cases this trend continues for those aged 50 to 59 years. Pay per hour in these occupations remains broadly unchanged.
Figure 5: Explore the gender pay gap by occupation
Gender pay gap for median gross hourly earnings (excluding overtime), all employees, full-time employees, and part-time employees, by occupations, april 2023.
- Some occupations can be included in more than one grouping.
- Some data are unavailable as they are considered unreliable (small sample size).
- The quality of earnings estimates vary by occupation; quality measures are available in the accompanying published data tables.
Figure 6: The difference in pay between the sexes is largest among higher earners
Difference in gross hourly earnings (excluding overtime) for full-time men and women at the top and bottom deciles and median, uk, 1997 to 2023.
- Full-time is defined as employees working more than 30 paid hours per week (or 25 or more for the teaching professions).
- Figures represent the difference between men's and women's hourly earnings as a percentage of men's hourly earnings.
Download this chart Figure 6: The difference in pay between the sexes is largest among higher earners
The 90th percentile male employee (one who earns more than 90% of other male employees, but less than the other 10%) earns substantially more than the equivalent female employee. The difference in pay, expressed in gender pay gap terms, is 14.8% for full-time employees. This is much higher than the gap among median earners (7.7%), which in turn is also higher than the bottom 10% of earners (3.1%).
The changes to the gender pay gap across all deciles have been minimal between 2022 and 2023. However, the gender pay gaps for medium-high earners (60th to 80th percentiles) have increased among full-time employees. For example, the 80th percentile gender pay gap in 2023 was 1.6% higher than it was in 2022. All deciles remain below pre-coronavirus pandemic levels in April 2019.
Figure 7: The gender pay gap is higher in all English regions than in Scotland, Wales or Northern Ireland
Gender pay gap for median gross hourly earnings (excluding overtime) for full-time employees, by work region, uk, april 1997 and 2023.
The gender pay gap varies substantially between regions. It is higher in every region of England than in Northern Ireland (negative 3.5%), Scotland (1.7%) and Wales (5.6%). In the case of Northern Ireland in particular, the gender pay gap is affected by a higher proportion of women working in the public sector, where pay rates for some jobs are higher than in the private sector.
This is a very different pattern from 1997, when the gender pay gap was relatively equal between the regions of the UK.
London stands out as being the region where the gender pay gap has decreased by the smallest amount when compared with its 1997 level. This is not a new development and has been highlighted previously. Drivers of the gender pay gap are numerous and, although jobs in London are more likely to be higher-skilled occupations when compared to other UK regions, the relative change in proportion of full-time jobs by occupation since 1997 shows a similar pattern in London to that of the whole UK, meaning that factors beyond this need to be considered.
The Office for National Statistics (ONS) conducted an analysis based on ASHE 2017 data which concluded that, for the UK, only 36% of the difference between men and women's pay could be explained by the attributes modelled from the ASHE (with occupation being the highest, explaining 23% of the difference); for further details, see our Understanding the gender pay gap in the UK article . This highlights the need for additional investigation. For example, separate ONS analysis has identified that, when changing job, women are more likely than men to accept lower pay in favour of a shorter commute, as explained in our The commuting gap: women are more likely than men to leave their job over a long commute analysis . This is particularly noticeable in parts of the South East where commuting time to London is a consideration, and is likely to affect the number of women moving into managerial positions.
4. Gender pay gap data
Gender pay gap Dataset | Released 1 November 2023 Annual gender pay gap estimates for UK employees by age, occupation, industry, full-time and part-time, region and other geographies, and public and private sector. Compiled from the Annual Survey of Hours and Earnings.
5. Glossary
The gender pay gap is calculated as the difference between average hourly earnings (excluding overtime) of men and women as a proportion of average hourly earnings (excluding overtime) of men's earnings. In practice, this means that a positive value for the gender pay gap indicates that on average men earn more than women, whereas a negative value indicates that on average women earn more than men.
Full-time and part-time
Full-time is defined as employees working more than 30 paid hours per week (or 25 or more hours for the teaching professions). Part-time is defined as employees working less than or equal to 30 paid hours per week (or less than or equal to 25 hours for the teaching professions).
Standard Occupational Classification
The Standard Occupational Classification (SOC) is a common classification of occupational information for the UK.
6. Measuring the data
The Annual Survey of Hours and Earnings (ASHE) collects information on actual payments made to the employee and the hours on which this pay was calculated. All estimates for 2023 are provisional and relate to the pay period that includes 19 April 2023. Estimates for 2022 have been revised and relate to the pay period that includes 27 April 2022.
The estimates in this bulletin are based on information gathered from a sample of 1% of employees in the UK. The achieved sample for 2023 was 156,000. Prior to the coronavirus (COVID-19) pandemic, the achieved sample size of ASHE was approximately 180,000 each year. However, given the challenges to data collection during the coronavirus pandemic and response rates not recovering since, the final achieved sample size was 144,000 for 2020, 142,000 for 2021 and 148,000 for 2022.
Over the coronavirus pandemic period, earnings estimates were affected by changes in the composition of the workforce and the impact of the Coronavirus Job Retention Scheme (furlough), making interpretation difficult. For more information, see our Far from average: How COVID-19 has impacted the Average Weekly Earnings data blog . Along with data collection disruption and lower response rates during this time, this means that for 2020 and 2021 the data were subject to more uncertainty and should be treated with caution. Therefore, over these periods we would encourage users to focus on long-term trends rather than year-on-year changes.
During and following the coronavirus pandemic period, the ASHE showed some divergence compared with other earnings data sources (Average Weekly Earnings and Earnings and employment from Pay As You Earn, Real Time Information). We set out the reasons why we expect to see differences in the data sources in our Comparison of labour market data source methodology . In addition, we also believe that differential non-response, the calibrating to the Labour Force Survey (LFS), increased variance because of sample size reduction, and the way the bonus element of the ASHE is captured are all contributing to the divergence in a small way. We will continue to monitor the patterns and look into this further where required.
An explanation for the difference in the gender pay gap estimate between full-time and all employees can be found in our Guide to interpreting ASHE estimates methodology . It also addresses common questions about the data.
ASHE data are weighted to UK population totals from the LFS based on classes defined by region, occupation, age and sex.
From 2021, we have moved our occupation coding to Standard Occupation Classification (SOC) 2020 from 2010. This means estimates for earnings in April 2021 on a SOC 2020 basis represent a break in the ASHE time series. Estimates will not be directly comparable with estimates for earnings on a SOC 2010 basis and, as such, should not be used in direct comparison with each other.
Our Guide to interpreting ASHE estimates methodology addresses common questions about the data. Further information about the ASHE can be found in our ASHE methodology and guidance article and our ASHE, low pay and pension results Quality and Methodology Information (QMI) report .
7. Strengths and limitations
The gender pay gap estimates presented here do not include overtime. Overtime can skew the results because men work higher overtime hours on average than women, and using hourly earnings better accounts for the fact that men work more hours per week on average than women.
The strengths and limitations of the Annual Survey of Hours and Earnings (ASHE) can be found in our ASHE, low pay and pension results Quality and Methodology Information (QMI) report and our Income and earnings statistics guide methodology .
8. Related links
The commuting gap: women are more likely than men to leave their job over a long commute Article | Released 4 September 2019 When deciding whether to leave their job, women are more likely than men to accept lower pay in favour of a shorter commute, contributing to the overall gender pay gap.
Understanding the gender pay gap in the UK Article | Released 17 January 2018 This analysis builds on the raw gender pay gap, using regressions techniques to provide more insight into the factors that affect men's and women's pay.
Decoding the gender pay gap Blog | Released 16 April 2019 This Office for National Statistics (ONS) blog post explores the paradox found in the gender pay gap and how occupation and type of employment affect the statistics.
Labour market overview Bulletin | Released 24 October 2023 Estimates of employment, unemployment, economic inactivity and other employment-related statistics for the UK.
Ethnicity pay gaps in Great Britain: 2019 Article | Released 12 October 2020 Earnings and employment statistics for different ethnic groups in Great Britain, using regression analysis to provide more insight into factors that affect pay.
Disability pay gaps in the UK: 2021 Bulletin | Released 25 April 2022 Earnings statistics for disabled and non-disabled employees in the UK, using regression analysis to provide more insight into factors that affect pay.
9. Cite this statistical bulletin
Office for National Statistics (ONS), released 1 November 2023, ONS website, statistical bulletin, Gender pay gap in the UK: 2023
Contact details for this Statistical bulletin
Report | Wages, Incomes, and Wealth
“Women’s work” and the gender pay gap : How discrimination, societal norms, and other forces affect women’s occupational choices—and their pay
Report • By Jessica Schieder and Elise Gould • July 20, 2016
Download PDF
Press release
Share this page:
What this report finds: Women are paid 79 cents for every dollar paid to men—despite the fact that over the last several decades millions more women have joined the workforce and made huge gains in their educational attainment. Too often it is assumed that this pay gap is not evidence of discrimination, but is instead a statistical artifact of failing to adjust for factors that could drive earnings differences between men and women. However, these factors—particularly occupational differences between women and men—are themselves often affected by gender bias. For example, by the time a woman earns her first dollar, her occupational choice is the culmination of years of education, guidance by mentors, expectations set by those who raised her, hiring practices of firms, and widespread norms and expectations about work–family balance held by employers, co-workers, and society. In other words, even though women disproportionately enter lower-paid, female-dominated occupations, this decision is shaped by discrimination, societal norms, and other forces beyond women’s control.
Why it matters, and how to fix it: The gender wage gap is real—and hurts women across the board by suppressing their earnings and making it harder to balance work and family. Serious attempts to understand the gender wage gap should not include shifting the blame to women for not earning more. Rather, these attempts should examine where our economy provides unequal opportunities for women at every point of their education, training, and career choices.
Introduction and key findings
Women are paid 79 cents for every dollar paid to men (Hegewisch and DuMonthier 2016). This is despite the fact that over the last several decades millions more women have joined the workforce and made huge gains in their educational attainment.
Critics of this widely cited statistic claim it is not solid evidence of economic discrimination against women because it is unadjusted for characteristics other than gender that can affect earnings, such as years of education, work experience, and location. Many of these skeptics contend that the gender wage gap is driven not by discrimination, but instead by voluntary choices made by men and women—particularly the choice of occupation in which they work. And occupational differences certainly do matter—occupation and industry account for about half of the overall gender wage gap (Blau and Kahn 2016).
To isolate the impact of overt gender discrimination—such as a woman being paid less than her male coworker for doing the exact same job—it is typical to adjust for such characteristics. But these adjusted statistics can radically understate the potential for gender discrimination to suppress women’s earnings. This is because gender discrimination does not occur only in employers’ pay-setting practices. It can happen at every stage leading to women’s labor market outcomes.
Take one key example: occupation of employment. While controlling for occupation does indeed reduce the measured gender wage gap, the sorting of genders into different occupations can itself be driven (at least in part) by discrimination. By the time a woman earns her first dollar, her occupational choice is the culmination of years of education, guidance by mentors, expectations set by those who raised her, hiring practices of firms, and widespread norms and expectations about work–family balance held by employers, co-workers, and society. In other words, even though women disproportionately enter lower-paid, female-dominated occupations, this decision is shaped by discrimination, societal norms, and other forces beyond women’s control.
This paper explains why gender occupational sorting is itself part of the discrimination women face, examines how this sorting is shaped by societal and economic forces, and explains that gender pay gaps are present even within occupations.
Key points include:
- Gender pay gaps within occupations persist, even after accounting for years of experience, hours worked, and education.
- Decisions women make about their occupation and career do not happen in a vacuum—they are also shaped by society.
- The long hours required by the highest-paid occupations can make it difficult for women to succeed, since women tend to shoulder the majority of family caretaking duties.
- Many professions dominated by women are low paid, and professions that have become female-dominated have become lower paid.
This report examines wages on an hourly basis. Technically, this is an adjusted gender wage gap measure. As opposed to weekly or annual earnings, hourly earnings ignore the fact that men work more hours on average throughout a week or year. Thus, the hourly gender wage gap is a bit smaller than the 79 percent figure cited earlier. This minor adjustment allows for a comparison of women’s and men’s wages without assuming that women, who still shoulder a disproportionate amount of responsibilities at home, would be able or willing to work as many hours as their male counterparts. Examining the hourly gender wage gap allows for a more thorough conversation about how many factors create the wage gap women experience when they cash their paychecks.
Within-occupation gender wage gaps are large—and persist after controlling for education and other factors
Those keen on downplaying the gender wage gap often claim women voluntarily choose lower pay by disproportionately going into stereotypically female professions or by seeking out lower-paid positions. But even when men and women work in the same occupation—whether as hairdressers, cosmetologists, nurses, teachers, computer engineers, mechanical engineers, or construction workers—men make more, on average, than women (CPS microdata 2011–2015).
As a thought experiment, imagine if women’s occupational distribution mirrored men’s. For example, if 2 percent of men are carpenters, suppose 2 percent of women become carpenters. What would this do to the wage gap? After controlling for differences in education and preferences for full-time work, Goldin (2014) finds that 32 percent of the gender pay gap would be closed.
However, leaving women in their current occupations and just closing the gaps between women and their male counterparts within occupations (e.g., if male and female civil engineers made the same per hour) would close 68 percent of the gap. This means examining why waiters and waitresses, for example, with the same education and work experience do not make the same amount per hour. To quote Goldin:
Another way to measure the effect of occupation is to ask what would happen to the aggregate gender gap if one equalized earnings by gender within each occupation or, instead, evened their proportions for each occupation. The answer is that equalizing earnings within each occupation matters far more than equalizing the proportions by each occupation. (Goldin 2014)
This phenomenon is not limited to low-skilled occupations, and women cannot educate themselves out of the gender wage gap (at least in terms of broad formal credentials). Indeed, women’s educational attainment outpaces men’s; 37.0 percent of women have a college or advanced degree, as compared with 32.5 percent of men (CPS ORG 2015). Furthermore, women earn less per hour at every education level, on average. As shown in Figure A , men with a college degree make more per hour than women with an advanced degree. Likewise, men with a high school degree make more per hour than women who attended college but did not graduate. Even straight out of college, women make $4 less per hour than men—a gap that has grown since 2000 (Kroeger, Cooke, and Gould 2016).
Women earn less than men at every education level : Average hourly wages, by gender and education, 2015
| Education level | Men | Women |
|---|---|---|
| Less than high school | $13.93 | $10.89 |
| High school | $18.61 | $14.57 |
| Some college | $20.95 | $16.59 |
| College | $35.23 | $26.51 |
| Advanced degree | $45.84 | $33.65 |
The data below can be saved or copied directly into Excel.
The data underlying the figure.
Source : EPI analysis of Current Population Survey Outgoing Rotation Group microdata
Copy the code below to embed this chart on your website.
Steering women to certain educational and professional career paths—as well as outright discrimination—can lead to different occupational outcomes
The gender pay gap is driven at least in part by the cumulative impact of many instances over the course of women’s lives when they are treated differently than their male peers. Girls can be steered toward gender-normative careers from a very early age. At a time when parental influence is key, parents are often more likely to expect their sons, rather than their daughters, to work in science, technology, engineering, or mathematics (STEM) fields, even when their daughters perform at the same level in mathematics (OECD 2015).
Expectations can become a self-fulfilling prophecy. A 2005 study found third-grade girls rated their math competency scores much lower than boys’, even when these girls’ performance did not lag behind that of their male counterparts (Herbert and Stipek 2005). Similarly, in states where people were more likely to say that “women [are] better suited for home” and “math is for boys,” girls were more likely to have lower math scores and higher reading scores (Pope and Sydnor 2010). While this only establishes a correlation, there is no reason to believe gender aptitude in reading and math would otherwise be related to geography. Parental expectations can impact performance by influencing their children’s self-confidence because self-confidence is associated with higher test scores (OECD 2015).
By the time young women graduate from high school and enter college, they already evaluate their career opportunities differently than young men do. Figure B shows college freshmen’s intended majors by gender. While women have increasingly gone into medical school and continue to dominate the nursing field, women are significantly less likely to arrive at college interested in engineering, computer science, or physics, as compared with their male counterparts.
Women arrive at college less interested in STEM fields as compared with their male counterparts : Intent of first-year college students to major in select STEM fields, by gender, 2014
| Intended major | Percentage of men | Percentage of women |
|---|---|---|
| Biological and life sciences | 11% | 16% |
| Engineering | 19% | 6% |
| Chemistry | 1% | 1% |
| Computer science | 6% | 1% |
| Mathematics/ statistics | 1% | 1% |
| Physics | 1% | 0.3% |
Source: EPI adaptation of Corbett and Hill (2015) analysis of Eagan et al. (2014)
These decisions to allow doors to lucrative job opportunities to close do not take place in a vacuum. Many factors might make it difficult for a young woman to see herself working in computer science or a similarly remunerative field. A particularly depressing example is the well-publicized evidence of sexism in the tech industry (Hewlett et al. 2008). Unfortunately, tech isn’t the only STEM field with this problem.
Young women may be discouraged from certain career paths because of industry culture. Even for women who go against the grain and pursue STEM careers, if employers in the industry foster an environment hostile to women’s participation, the share of women in these occupations will be limited. One 2008 study found that “52 percent of highly qualified females working for SET [science, technology, and engineering] companies quit their jobs, driven out by hostile work environments and extreme job pressures” (Hewlett et al. 2008). Extreme job pressures are defined as working more than 100 hours per week, needing to be available 24/7, working with or managing colleagues in multiple time zones, and feeling pressure to put in extensive face time (Hewlett et al. 2008). As compared with men, more than twice as many women engage in housework on a daily basis, and women spend twice as much time caring for other household members (BLS 2015). Because of these cultural norms, women are less likely to be able to handle these extreme work pressures. In addition, 63 percent of women in SET workplaces experience sexual harassment (Hewlett et al. 2008). To make matters worse, 51 percent abandon their SET training when they quit their job. All of these factors play a role in steering women away from highly paid occupations, particularly in STEM fields.
The long hours required for some of the highest-paid occupations are incompatible with historically gendered family responsibilities
Those seeking to downplay the gender wage gap often suggest that women who work hard enough and reach the apex of their field will see the full fruits of their labor. In reality, however, the gender wage gap is wider for those with higher earnings. Women in the top 95th percentile of the wage distribution experience a much larger gender pay gap than lower-paid women.
Again, this large gender pay gap between the highest earners is partially driven by gender bias. Harvard economist Claudia Goldin (2014) posits that high-wage firms have adopted pay-setting practices that disproportionately reward individuals who work very long and very particular hours. This means that even if men and women are equally productive per hour, individuals—disproportionately men—who are more likely to work excessive hours and be available at particular off-hours are paid more highly (Hersch and Stratton 2002; Goldin 2014; Landers, Rebitzer, and Taylor 1996).
It is clear why this disadvantages women. Social norms and expectations exert pressure on women to bear a disproportionate share of domestic work—particularly caring for children and elderly parents. This can make it particularly difficult for them (relative to their male peers) to be available at the drop of a hat on a Sunday evening after working a 60-hour week. To the extent that availability to work long and particular hours makes the difference between getting a promotion or seeing one’s career stagnate, women are disadvantaged.
And this disadvantage is reinforced in a vicious circle. Imagine a household where both members of a male–female couple have similarly demanding jobs. One partner’s career is likely to be prioritized if a grandparent is hospitalized or a child’s babysitter is sick. If the past history of employer pay-setting practices that disadvantage women has led to an already-existing gender wage gap for this couple, it can be seen as “rational” for this couple to prioritize the male’s career. This perpetuates the expectation that it always makes sense for women to shoulder the majority of domestic work, and further exacerbates the gender wage gap.
Female-dominated professions pay less, but it’s a chicken-and-egg phenomenon
Many women do go into low-paying female-dominated industries. Home health aides, for example, are much more likely to be women. But research suggests that women are making a logical choice, given existing constraints . This is because they will likely not see a significant pay boost if they try to buck convention and enter male-dominated occupations. Exceptions certainly exist, particularly in the civil service or in unionized workplaces (Anderson, Hegewisch, and Hayes 2015). However, if women in female-dominated occupations were to go into male-dominated occupations, they would often have similar or lower expected wages as compared with their female counterparts in female-dominated occupations (Pitts 2002). Thus, many women going into female-dominated occupations are actually situating themselves to earn higher wages. These choices thereby maximize their wages (Pitts 2002). This holds true for all categories of women except for the most educated, who are more likely to earn more in a male profession than a female profession. There is also evidence that if it becomes more lucrative for women to move into male-dominated professions, women will do exactly this (Pitts 2002). In short, occupational choice is heavily influenced by existing constraints based on gender and pay-setting across occupations.
To make matters worse, when women increasingly enter a field, the average pay in that field tends to decline, relative to other fields. Levanon, England, and Allison (2009) found that when more women entered an industry, the relative pay of that industry 10 years later was lower. Specifically, they found evidence of devaluation—meaning the proportion of women in an occupation impacts the pay for that industry because work done by women is devalued.
Computer programming is an example of a field that has shifted from being a very mixed profession, often associated with secretarial work in the past, to being a lucrative, male-dominated profession (Miller 2016; Oldenziel 1999). While computer programming has evolved into a more technically demanding occupation in recent decades, there is no skills-based reason why the field needed to become such a male-dominated profession. When men flooded the field, pay went up. In contrast, when women became park rangers, pay in that field went down (Miller 2016).
Further compounding this problem is that many professions where pay is set too low by market forces, but which clearly provide enormous social benefits when done well, are female-dominated. Key examples range from home health workers who care for seniors, to teachers and child care workers who educate today’s children. If closing gender pay differences can help boost pay and professionalism in these key sectors, it would be a huge win for the economy and society.
The gender wage gap is real—and hurts women across the board. Too often it is assumed that this gap is not evidence of discrimination, but is instead a statistical artifact of failing to adjust for factors that could drive earnings differences between men and women. However, these factors—particularly occupational differences between women and men—are themselves affected by gender bias. Serious attempts to understand the gender wage gap should not include shifting the blame to women for not earning more. Rather, these attempts should examine where our economy provides unequal opportunities for women at every point of their education, training, and career choices.
— This paper was made possible by a grant from the Peter G. Peterson Foundation. The statements made and views expressed are solely the responsibility of the authors.
— The authors wish to thank Josh Bivens, Barbara Gault, and Heidi Hartman for their helpful comments.
About the authors
Jessica Schieder joined EPI in 2015. As a research assistant, she supports the research of EPI’s economists on topics such as the labor market, wage trends, executive compensation, and inequality. Prior to joining EPI, Jessica worked at the Center for Effective Government (formerly OMB Watch) as a revenue and spending policies analyst, where she examined how budget and tax policy decisions impact working families. She holds a bachelor’s degree in international political economy from Georgetown University.
Elise Gould , senior economist, joined EPI in 2003. Her research areas include wages, poverty, economic mobility, and health care. She is a co-author of The State of Working America, 12th Edition . In the past, she has authored a chapter on health in The State of Working America 2008/09; co-authored a book on health insurance coverage in retirement; published in venues such as The Chronicle of Higher Education , Challenge Magazine , and Tax Notes; and written for academic journals including Health Economics , Health Affairs, Journal of Aging and Social Policy, Risk Management & Insurance Review, Environmental Health Perspectives , and International Journal of Health Services . She holds a master’s in public affairs from the University of Texas at Austin and a Ph.D. in economics from the University of Wisconsin at Madison.
Anderson, Julie, Ariane Hegewisch, and Jeff Hayes 2015. The Union Advantage for Women . Institute for Women’s Policy Research.
Blau, Francine D., and Lawrence M. Kahn 2016. The Gender Wage Gap: Extent, Trends, and Explanations . National Bureau of Economic Research, Working Paper No. 21913.
Bureau of Labor Statistics (BLS). 2015. American Time Use Survey public data series. U.S. Census Bureau.
Corbett, Christianne, and Catherine Hill. 2015. Solving the Equation: The Variables for Women’s Success in Engineering and Computing . American Association of University Women (AAUW).
Current Population Survey Outgoing Rotation Group microdata (CPS ORG). 2011–2015. Survey conducted by the Bureau of the Census for the Bureau of Labor Statistics [ machine-readable microdata file ]. U.S. Census Bureau.
Goldin, Claudia. 2014. “ A Grand Gender Convergence: Its Last Chapter .” American Economic Review, vol. 104, no. 4, 1091–1119.
Hegewisch, Ariane, and Asha DuMonthier. 2016. The Gender Wage Gap: 2015; Earnings Differences by Race and Ethnicity . Institute for Women’s Policy Research.
Herbert, Jennifer, and Deborah Stipek. 2005. “The Emergence of Gender Difference in Children’s Perceptions of Their Academic Competence.” Journal of Applied Developmental Psychology , vol. 26, no. 3, 276–295.
Hersch, Joni, and Leslie S. Stratton. 2002. “ Housework and Wages .” The Journal of Human Resources , vol. 37, no. 1, 217–229.
Hewlett, Sylvia Ann, Carolyn Buck Luce, Lisa J. Servon, Laura Sherbin, Peggy Shiller, Eytan Sosnovich, and Karen Sumberg. 2008. The Athena Factor: Reversing the Brain Drain in Science, Engineering, and Technology . Harvard Business Review.
Kroeger, Teresa, Tanyell Cooke, and Elise Gould. 2016. The Class of 2016: The Labor Market Is Still Far from Ideal for Young Graduates . Economic Policy Institute.
Landers, Renee M., James B. Rebitzer, and Lowell J. Taylor. 1996. “ Rat Race Redux: Adverse Selection in the Determination of Work Hours in Law Firms .” American Economic Review , vol. 86, no. 3, 329–348.
Levanon, Asaf, Paula England, and Paul Allison. 2009. “Occupational Feminization and Pay: Assessing Causal Dynamics Using 1950-2000 U.S. Census Data.” Social Forces, vol. 88, no. 2, 865–892.
Miller, Claire Cain. 2016. “As Women Take Over a Male-Dominated Field, the Pay Drops.” New York Times , March 18.
Oldenziel, Ruth. 1999. Making Technology Masculine: Men, Women, and Modern Machines in America, 1870-1945 . Amsterdam: Amsterdam University Press.
Organisation for Economic Co-operation and Development (OECD). 2015. The ABC of Gender Equality in Education: Aptitude, Behavior, Confidence .
Pitts, Melissa M. 2002. Why Choose Women’s Work If It Pays Less? A Structural Model of Occupational Choice. Federal Reserve Bank of Atlanta, Working Paper 2002-30.
Pope, Devin G., and Justin R. Sydnor. 2010. “ Geographic Variation in the Gender Differences in Test Scores .” Journal of Economic Perspectives , vol. 24, no. 2, 95–108.
See related work on Wages, Incomes, and Wealth | Women
See more work by Jessica Schieder and Elise Gould
Cookies on GOV.UK
We use some essential cookies to make this website work.
We’d like to set additional cookies to understand how you use GOV.UK, remember your settings and improve government services.
We also use cookies set by other sites to help us deliver content from their services.
You have accepted additional cookies. You can change your cookie settings at any time.
You have rejected additional cookies. You can change your cookie settings at any time.
Register to vote Register by 18 June to vote in the General Election on 4 July.
- Women’s Progression in the Workplace: actions for employers
- Government Equalities Office
What works to reduce the gender pay gap: women’s progression in the workplace action note
Published 22 March 2019

© Crown copyright 2019
This publication is licensed under the terms of the Open Government Licence v3.0 except where otherwise stated. To view this licence, visit nationalarchives.gov.uk/doc/open-government-licence/version/3 or write to the Information Policy Team, The National Archives, Kew, London TW9 4DU, or email: [email protected] .
Where we have identified any third party copyright information you will need to obtain permission from the copyright holders concerned.
This publication is available at https://www.gov.uk/government/publications/womens-progression-in-the-workplace-actions-for-employers/what-works-to-reduce-the-gender-pay-gap-womens-progression-in-the-workplace-action-note
Women’s progression in the workplace action note
One of the drivers of the gender pay gap is that women are not progressing in the workplace as fully as their talents would allow.
Women are less likely to progress out of junior roles or into senior roles and are more likely to be overqualified for the role they are in.
Women are also more likely to work part-time, which is associated with limited pay progression, and can face structural barriers and bias during recruitment, appointment, reward and promotion processes.
Supporting women to progress can help to make the best use of their skills and experience, help to attract and retain talent, and improve productivity and performance.
Evidence suggests that the following actions can support women in your organisation to progress and help to close the gender pay gap:
- create an inclusive culture
- support women’s career development
- progression for part-time workers
- improve recruitment and promotion processes
- measure and evaluate policies to support diversity and inclusion
Create an inclusive culture
Women, ethnic minorities, disabled people and LGBT people can feel that they do not fit or belong in their organisation. This can lead to lower performance, lower work-life balance, lower ambition and higher intention to leave, despite them being equally as talented as other staff.
Creating an environment where all employees feel supported and valued could lead to better outcomes for your organisation and help retain talent and reduce turnover.
To create a diverse and inclusive workplace, you could:
ensure that senior leaders are accountable for addressing the barriers to women’s progression and retention, and are open about what action they are taking
- senior leaders should role model positive and inclusive behaviour, such as working flexibly and sponsoring women with high potential
- communicate through line management and talent management processes that everyone has the potential to be successful in their careers and that those who want to progress will be supported to do so
- create guidance on the positive and inclusive behaviours everyone in your organisation is expected to demonstrate, and clearly define what behaviour is unacceptable and inappropriate. For example, when chairing a meeting, give everyone the chance to contribute to ensure that everyone feels that their opinion and expertise is valued, and support those who work flexibly by normalising dial-in and video-conferencing
Support women’s career development
Evidence shows that women aren’t given the same opportunities and development support as men. Women are more likely to receive generic feedback and can be encouraged to behave in a more masculine way or focus on short-term skills development, as opposed to building networks and following long-term development strategies.
They are more often asked to undertake tasks that are resource or time intensive, such as organising staff events, but are not as valued in promotion processes.
Women and men who work flexibly or have caring responsibilities can find it hard to find time for learning and development or networking outside of working hours. Sometimes, women who have spent time out of work or work part-time are not given equal opportunity to take on challenging work or more responsibility.
This can impact women’s confidence and ambition, and mean that during reward and promotion processes, they can appear to have less experience or be less qualified.
Ensuring that women’s talents and achievements are recognised and that they are supported to access challenging work, networking and development opportunities, can help them to progress.
- regularly review how work is allocated, based on workload, skills and experience, in order to support development and progression
- offer formal and informal networking opportunities during working hours
- ensure that sponsorship programmes are transparent, with clear and measurable aims and objectives
- be proactive in identifying employees with high potential, and support them by providing equal access to stretching work and sponsorship from senior leaders
- holding regular, formal conversations about career development
- allocating stretching and interesting work
- identifying and allowing time for learning and development opportunities to build experience, such as shadowing
- providing good quality feedback that recognises the individual’s potential, and focuses on both improving technical skills and acquiring skills required for progression into senior leadership, such as strategic thinking
- implement standardised performance management processes, such as using a talent grid, to measure performance and potential, with guidance on what potential means, and clear criteria on the skills and experience required at each stage of progression
- link your performance management processes with reward processes to ensure that those who perform well are fairly rewarded for their performance
Improve recruitment and promotion processes
When generic criteria are used in job advertisements, potential applicants can find it difficult to identify if they have the right skills and experience. Traditional stereotypes of what characteristics “good leaders” should have, such as being assertive or having international experience, can disadvantage women during recruitment and promotion.
Informal and unstructured promotion and recruitment processes can lead to more bias in decision making, which can mean that the best candidates are missed. Once appointed or promoted, women are also less likely to negotiate their pay.
Ensuring there is structure and transparency to recruitment, appointment and promotion processes can reduce bias and increase the number of successful female applicants.
To improve your recruitment and promotion processes, you could:
- when advertising jobs, consider what specific skills and experience are relevant to the role and clearly state that flexible working is available where possible
- use name blind, skills and competency-based recruitment to ensure that the best-qualified individual gets the jo
- where possible, clearly indicate that the salary is negotiable or provide salary ranges on job advertisements
- use structured interviews for recruitment and promotion. This means that, for a given role, all candidates are asked the same questions in the same order, and their responses are scored according to pre-agreed criteria
- implement recruitment, reward and promotion processes where individuals are considered based on their experience and performance by an independent panel
- base pay decisions on the individual’s skills and experience, not their previous salary
- ensure that pay negotiation, recruitment, reward and promotion processes are clear and transparent to employees. This means having standardised, formal criteria around performance and reward that employees understand
Progression for part-time workers
Women who work part-time experience limited wage progression, and working part-time can sometimes be associated with negative perceptions about ability and ambition.
However, part-time workers can be ambitious, skilled and experienced, proactive and flexible in managing their workload, and committed to their career.
To support part-time and flexible workers to progress, you could:
- highlight senior leaders, including men and those who are parents and carers, who work part-time, to bust myths around the ambition and abilities of part-time workers
- clearly advertise that part-time and job-sharing is available on job advertisements, particularly for manager and senior roles
- support those moving from full-time to part-time - explore reallocating work to account for reduced hours and allocate work that reflects their skills and experience
- holding regular conversations about career development - ask if they want to progress and support them to do so
- ensuring they are able to access networking, and learning and development opportunities, at a time that is convenient for them
Measure and evaluate policies to support diversity and inclusion
It is important to measure and evaluate your policies and procedures to support progression, in order to identify progress and address problems.
Setting specific, time-bound objectives that can be tracked will help you to achieve them. Openly publicising these objectives within your organisation lets your employees know that you are committed to supporting gender equality and encourages employees to work collectively to meet them.
To improve the implementation and evaluation of policies, you could:
- set specific, realistic objectives for diversity and inclusion across your organisation to create leadership accountability
- measure and evaluate the take-up and effectiveness of policies such as flexible working and talent development programmes, to identify problems and bottlenecks
- use exit interviews to understand the reasons people leave your organisation, and use this information to inform your HR processes and diversity and inclusion strategy
- use your gender pay gap data to understand the causes of your organisation’s gender pay gap
- develop an effective, targeted action plan that seeks to improve policies and practices across the whole of your organisation, including work-life balance policies, and recruitment, progression, talent management and line management processes
The evidence for the actions in this report comes from the academic research contributed to the women’s progression in the workplace theme of the Workplace and Gender Equality (WAGE) Research Programme.
For detailed sources, please contact [email protected]
Is this page useful?
- Yes this page is useful
- No this page is not useful
Help us improve GOV.UK
Don’t include personal or financial information like your National Insurance number or credit card details.
To help us improve GOV.UK, we’d like to know more about your visit today. Please fill in this survey (opens in a new tab) .

Gender pay gap reporting: Understand what it is, if you need to report and why
Learn about the gender pay gap, find out which employers need to report on it and understand why it's important
This guide is designed to help employers understand more about the gender pay gap and find out if they need to report on it. It provides a summary of the regulations, which organisations they apply to, and what happens if you don’t report your gender pay gap figures. It explains what the gender pay gap is, what causes it, why it needs to be tackled, and why gender pay gap reporting has been introduced.
There has been a government consultation since gender pay gap reporting was introduced, looking at mandatory reporting of ethnicity pay data and, although there is not a legal requirement, some organisations are already reporting. We strongly encourage you to also report on ethnicity pay gaps. For more information, see the CIPD guide on Ethnicity pay reporting .
The CIPD provides information on the legislation relating to gender pay gap reporting in our dedicated member resource. This legal information provided is for guidance only and if your organisation is following related legal proceedings, you should seek further legal advice from a specialist solicitor.
For guidance on how to calculate and publish your gender pay gap report refer to our guide on calculation and publication
What is the gender pay gap.
The gender pay gap is a measure of labour market or workplace disadvantage, expressed in terms of a comparison between men’s and women’s average (median) hourly rates of pay. It’s about pay, but also about other factors, such as occupational segregation, or the fact that in the main it’s women who look after children and other dependants.
Gender pay gap reporting doesn’t specifically ask who earns what, but what women earn compared with men. It provides a framework within which gender pay gaps can be surfaced, enabling us to constructively consider why they exist and what to do about them.
The gap can be measured in various ways, and it’s important to understand how, in any specific context, the gap is being measured. A gender pay gap can be expressed as:
- A positive measure, for example, a gap of 13.9% – this indicates the extent to which women earn, on average, less per hour than their male counterparts.
- A negative measure, for example, a gap of −9.2% – this indicates the extent to which women earn, on average, more per hour than their male counterparts. This may happen, for example, if you employ a high proportion of men in low-paid, part-time work, and/or your senior and higher-paid employees are women.
Example: A negative gender pay gap
Avocet Care employs 305 staff across six residential homes providing specialist dementia care. The employees are predominantly female. The highest-paid employees are highly qualified nursing and managerial staff, only three of whom are male. At each home four to five men are employed as maintenance staff and drivers. These jobs are relatively low paid.
Avocet’s mean and median gender pay gap calculations show gaps in favour of women, and its pay quartiles show the predominance of women in all four quartiles. The company does not pay bonuses.
In its narrative Avocet points to the predominance of women in the care home sector, and to the shortage of suitably qualified male carers. It also sets out what action it is taking to recruit more men into its caring and nursing roles, and explains that, given its mixed-sex client profile, attracting more men is a business priority.
To fully understand the gender pay gap, we need to think about it in three different ways:
- As a measure of labour market disadvantage – for example, throughout the economy, women are concentrated in lower-paid jobs.
- As a measure of workplace disadvantage – for example, women in your organisation are concentrated in lower-paid jobs; this is where the government wants you to act. Taking steps to reduce the gap at workplace level will help narrow the gap at national level.
- As a measure of the difference between the individual earnings of a man and a woman – a difference doesn’t automatically mean that the woman is missing out on equal pay. To be entitled to equal pay, a woman must be employed by the same employer, on the same terms and conditions, and the work that she does has to be equal to that being done by her male colleague. And even then, there may be an acceptable reason for the pay difference, such as location. However, it’s also important not to lose sight of the fact that unequal pay may be contributing to the gender pay gap.
Gender pay gaps are the outcome of economic, cultural, societal and educational factors. Some argue that they reflect personal choice but, although the decision to seek paid employment may be an individual choice, that choice is strongly influenced by matters outside of the individual’s control, such as the availability and affordability of childcare, and it is still the case that the choices available to women are more constrained than those available to men. The key influences on the gender pay gap are summarised in figure 1.
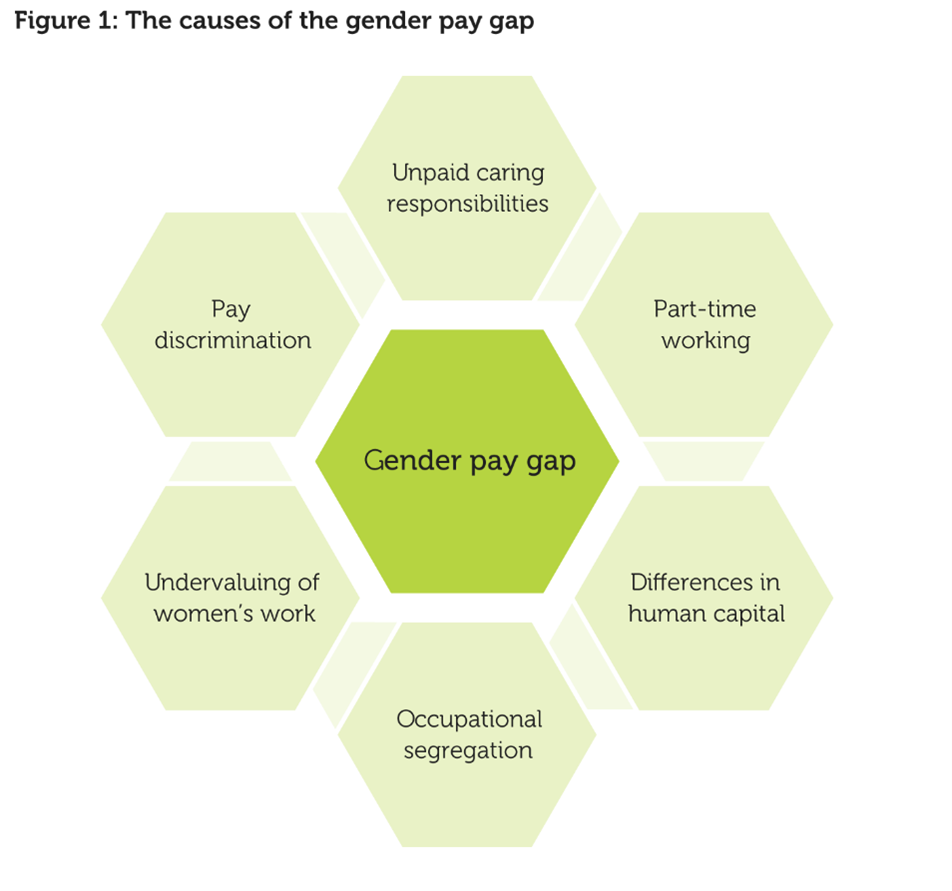
Unpaid caring responsibilities
The cost of childcare has been identified as a particular problem that affects women’s participation in the labour market. A 2017 report from Working Families found that childcare costs account for a significant proportion of family expenditure and that the high cost of childcare has a great influence on whether parents, particularly mothers, choose to either give up work or reduce their working hours. And, in so far as the care of adults is concerned, women are more likely than men to be carers.
Women as unpaid carers: A survey carried out by Carers UK in 2022 found that 80% of carers are female .
Between 2000 and 2015, time spent caring for adults by people aged over 50 has increased, but there is concern that there may not be enough unpaid carers to meet future demand. Factors such as increasing female employment, fewer children and higher divorce rates among men over 60 years may affect the future availability of children to provide unpaid care for their elderly parents. In 2015/16, an estimated 345,000 unpaid carers aged 16-64 in England, predominantly women, left employment to provide care.
In 2022, 600 people a day, on average, left work to take on caring responsibilities, and 75% of carers still in employment worry about juggling work and care.
Occupational segregation
Despite half a century of equalities legislation, the UK labour market remains highly segregated, with men dominating some types of job and women others; many women are concentrated in the ‘five Cs’ of caring, cleaning, catering, clerical and cashiering, all of which tend to be lower paid. In terms of the gender pay gap, the problem with occupational segregation is not that men and women are doing different types of work, but that segregation is associated with these jobs being valued differently. The introduction of the National Minimum Wage and the National Living Wage provides a wage floor for the lowest-paid jobs but does nothing to challenge any underlying undervaluation of the work.
In terms of gender pay gap reporting, a lot of attention has been paid to vertical segregation – jobs in the higher echelons of an organisation being dominated by men – but horizontal segregation also contributes to the gender pay gap. Horizontal segregation occurs lower down the hierarchy and manifests as men and women doing distinctly different types of work, with the ‘male’ jobs being paid more than the ‘female’ jobs. When the reverse is true – the ‘female’ jobs being paid more than the ‘male’ jobs – a negative gender pay gap may arise. In the first two years of gender pay gap reporting, some employers have been paying increasing attention to the impact of horizontal segregation and are looking to find ways of tackling it.
Pay discrimination
In terms of the gender pay gap’s contribution to actual inequalities in pay, horizontal occupational segregation presents a high risk of equal pay claims, as does a high mean bonus gap. We look at this later in What your measures tell you , but it would be sensible to take account of the risk of equal pay claims being brought. In 2017/18, the Employment Tribunal received 35,558 equal pay claims . In 2018/19 the figure fell to 26,860, but as the reports only provide the headline figures for the number of cases filed, it is not possible to form a view as to why there has been a substantial drop.
Part-time working
Looking only at part-time employees, we see a negative gender pay gap, with median pay for part-time employees being higher for women than for men . However, hourly rates of pay for part-time work tend to be lower than for full-time work and, with such a high percentage of women working part-time, their low hourly rates of pay mean that the gender pay gap for all employees is greater than that for full-time employees alone. Seventy-one per cent of part-time workers are women; 38% of women work part-time, compared with 14% of men. And whereas men tend to work part-time at the beginning and end of their working lives, women do so in their middle years.
As well as the moral case for making access to work and progression opportunities more equal for men and women, the economic benefits of closing the gap are considerable. Because of this, the government considers that the rate of progress is too slow and has committed to closing the gap within a generation. Gender pay gap reporting is one way of fulfilling that commitment. We look at the benefits in more detail in the section 'Why should the gender pay gap be addressed?’.
Promoting pay transparency
Pay transparency, which provides people with the information to assess the fairness of the way in which pay is allocated, is increasingly being demanded by regulators and the public. For some time now, companies have been required to disclose their directors’ pay, while public bodies must disclose the pay of their senior officers.
The pay transparency afforded by gender pay gap reporting helps to illuminate the structural drivers of inequality, such as occupational segregation or the unequal distribution of family responsibilities.
It also prompts employers to examine structural or cultural barriers within the organisation that may be contributing to the pay gap and, ideally, tackle them. In other words, addressing the factors that are creating a ‘glass ceiling’, preventing women from progressing to the most senior roles.
Gender pay gap reporting is also consistent with the kind of transparency that has long been required by the equal pay legislation, namely that everyone involved in a pay system should know how it operates. This means employees and their managers knowing what an employee must do to earn each component of their pay packet. For example, what does an employee have to do to earn their salary, or why does one employee receive a particular allowance, but another employee doesn’t?
Putting the kind of transparency afforded by the equal pay legislation alongside gender pay gap reporting means we have the information needed to uncover the causes of gender pay inequality. An example of how, in the context of gender pay gap reporting, these two kinds of transparency complement each other would be to know why you are paying someone a bonus, information which could help you to explain the bonus gap reported in your gender pay gap report.
At whole economy level, the gender pay gap is calculated from data drawn from the Annual Survey of Hours and Earnings (ASHE), which is carried out by the Office for National Statistics (ONS). ASHE is based on a 1% sample of employee jobs, drawn from HMRC Pay As You Earn records. ASHE collects information on the levels, distribution and make-up of earnings and hours paid. Results are produced by gender and by various industrial, occupational and geographic breakdowns, as well as by public and private sectors and by age group.
In the absence of an annual report on the overall gender pay gap in the UK (such as, for example, that produced by Belgium ), ASHE is the key official source of information on the gender pay gap in the UK, but to get a full picture of women’s earnings relative to men’s, it’s important to read the annual survey in its entirety, and not just the section on the gender pay gap. Knowing, say, that average earnings in the private sector are lower than those in the public sector, and that in 2018 earnings growth was greater for full-time than for part-time workers , helps to put the gender pay gap into context.
In April 2023, the UK’s gender pay gap for full-time employees was 7.7%, meaning that average pay for full-time female employees was 7.7% lower than for full-time male employees, or for every £1 a full-time male employee earned, a full-time female worker earned 92.3 pence.
Among all employees, the gender pay gap decreased to 14.3% from 14.9% in 2022. The Office for National Statistics notes that during the COVID-19 pandemic period, earnings estimates were affected by changes in composition of the workforce and the impact of the Coronavirus Job Retention Scheme (furlough) making interpretation difficult. Additionally, data collection disruption and lower response rates mean that, for 2020 and 2021, data were subject to more uncertainty and should be treated with caution.
Source: The gender pay gap 2023
How the ONS estimates the UK gender pay gap
The ONS estimates the gender pay gap based on hourly earnings, excluding overtime, and bases its calculations on median rather than mean earnings.
- Hourly earnings are used because they take account of the fact that men are proportionally more likely than women to work full-time. At ages 16–21, men’s jobs are split almost equally between full-time (52.1%) and part-time (47.9%), but, between the ages of 30–39 and 40–49, more than 90% of men’s jobs are full-time (93.7% and 92.8% respectively). For women, only 67.5% (ages 30–39) and 64.1% (ages 40–49) hold full-time jobs.
- Overtime is excluded because, as it is still in the main women who bear the day-to-day responsibility for looking after children or dependent relatives, they are less likely than men to work overtime.
- The ONS prefers median rather than mean earnings because the median is not affected by extreme values. However, as the mean gap captures the fact that the upper end of the earnings distribution is dominated by men, the mean is an important measure of women’s labour market disadvantage.
Women’s patterns of paid work differ from those of men, and this can put them at a disadvantage, but men’s and women’s work experience is converging – the proportion of men working part-time, for example, rose from around 7% in 1992, to 13% in 2010 and to 15.2% in 2021. And for women, full-time employment has grown more quickly than part-time employment.
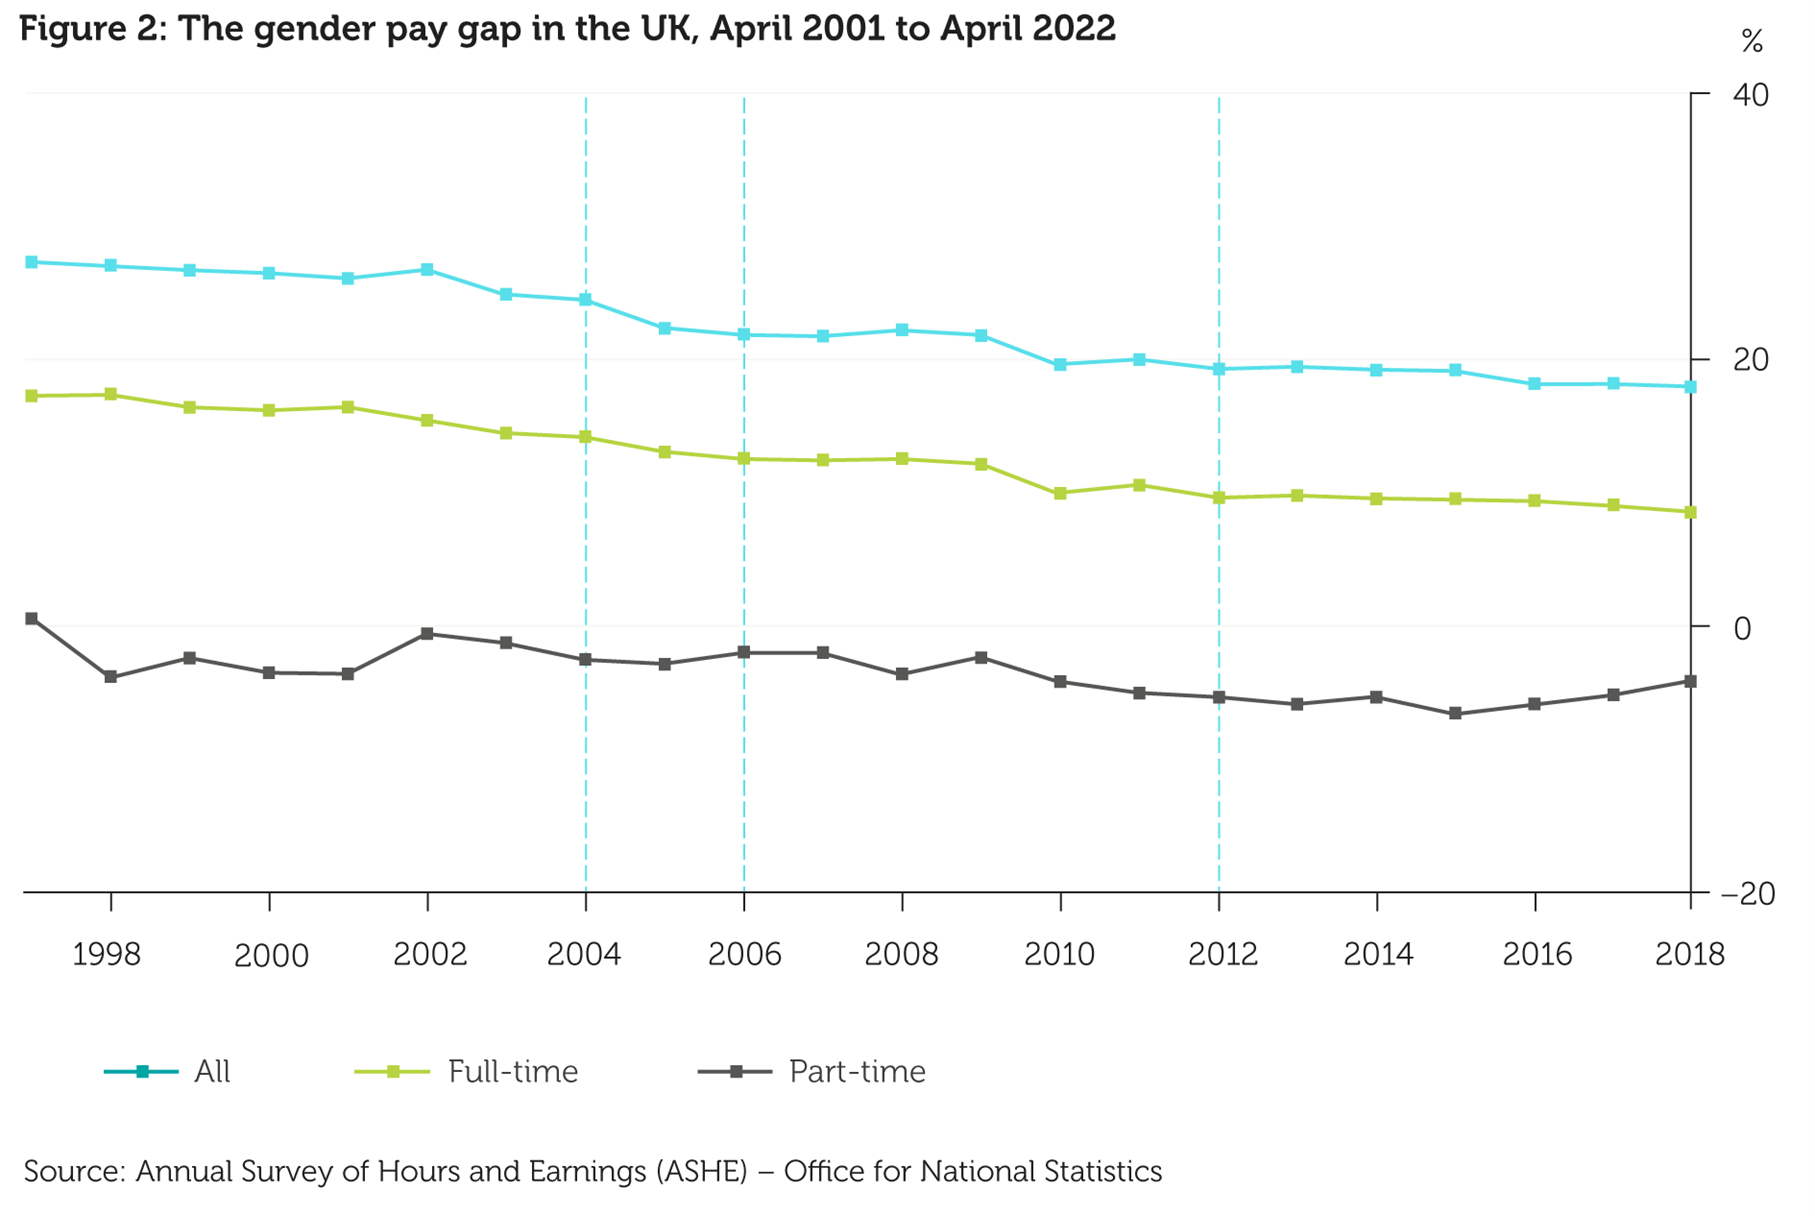
While the baseline measurement for both ASHE and gender pay gap reporting is of hourly earnings, it’s also possible to calculate the gender pay gap by weekly, monthly and annual earnings, and by occupation, age, ethnicity and disability status, and to analyse the gap at various points in the earnings distribution. You probably feel that the six measures you are being asked to produce are more than enough, but it’s worthwhile bearing in mind that the deeper down you drill into your people and pay data, the more likely you are to recognise what it is you need to do to take effective action to reduce your gender pay gap.
Over the past 30 years the gender pay gap in full-time employment has narrowed, but the pace of improvement has been uneven and there’s still a way to go. Knowing where the sticking points are may help you deal with your organisation’s own gender pay gap.
As can be seen from figure 2 above, the gender pay gap has decreased markedly over time, but what the figure doesn’t show is that the extent to which it has done so has varied across different age groups. The gender pay gap is small or negative for employees in their 20s or 30s but widens considerably for older age groups.
The gender pay gap within different groups of occupations also varies considerably, and in different ways for different occupations. The pay gap has been consistently high for those in the skilled trades, and for managers and directors. It has been consistently lower than the national average for professional and associate professional occupations, because, with increased attendance at universities, there have been proportionately more women entering professional and associate professional occupational groups. However, a lack of flexible working arrangements on offer at senior levels more generally is a factor affecting women’s progression opportunities.
In addition to the moral and social justice case for gender equality, there are further national and organisational benefits of seeking to close the gender pay gap (figure 3).
With women outperforming men educationally, the case for ensuring their skills are fully utilised is incontestable. In addition, failing to tackle a gender pay gap is likely to cause damage to your organisation’s reputation in the eyes of both current and potential clients and employees.
The economy: Gender equality, economic growth, pay and pensions
A key source of evidence on the economic dimensions of the gender pay gap is the report of the 2016 inquiry into the gap by the Women and Equalities Committee (WEC). The WEC found that the UK’s 19.2% gap (2016) was not only an equality issue, it also represented a significant loss to UK productivity and, in the face of an ageing workforce, a skills crisis, the need for a more competitive economy, and that the gap needed to be addressed. The WEC concluded that tackling the underlying causes of the gender pay gap would not only increase productivity and address skills shortages, but it would also improve the performance of individual organisations.
Several studies support the WEC’s conclusion:
- In its evidence to the inquiry, the former UK Commission for Employment and Skills (UKCES) quoted research suggesting that the underutilisation of women’s skills costs the UK economy between 1.3% and 2% of GDP every year. The UKCES also suggested that eradicating the full-time gender pay gap would contribute an additional £41 billion of spending into the economy each year.
- McKinsey’s 2016 report , The Power of Parity: Advancing women’s equality in the United Kingdom, suggested that even partial progress towards parity had the potential to add as much as £150 billion to GDP by 2025, over and above the business-as-usual scenario – in fact, an estimated 6.8% more. This would be the equivalent of raising GDP growth by 0.7% per year for the next 10 years.
- The Gender Pensions Gap Report 2022 study showed that while women’s expected retirement income is increasing and the gender gap is shrinking, women’s pension wealth is only 33.5% of men’s, or for every £1 a man had in his pension pot, a woman had just 33.5 pence. Closing the gap by bringing women’s earnings up to the level of men’s would increase the likelihood of women being able to provide for their own pensions, thereby reducing both pensioner poverty and the welfare support needed to counter it.
The workplace: Gender equality, talent and reputation
At an organisational level, promoting gender equality is part of being a good employer, one that strives to achieve fairness. Being open about your gender pay gap and how you’re tackling it increases employee confidence in you as an employer, and in your pay and reward processes.
Organisations with gender-diverse profiles at senior levels make a better financial return than those who do not. McKinsey’s Diversity Matters research has shown that for every 10% increase in gender diversity in a UK company’s executive team, earnings before interest and taxes rose by 3.5%. But the national ratio of women in leadership relative to men is poor (there are currently two male managers for every female manager), with the UK lagging behind comparable economies such as the United States, Sweden and Canada.
Women make up around half the talent pool, so attracting and retaining them is central to future success. Women are better qualified than ever before with girls still doing better than boys at both GCSE and A level in England, Wales and Northern Ireland.
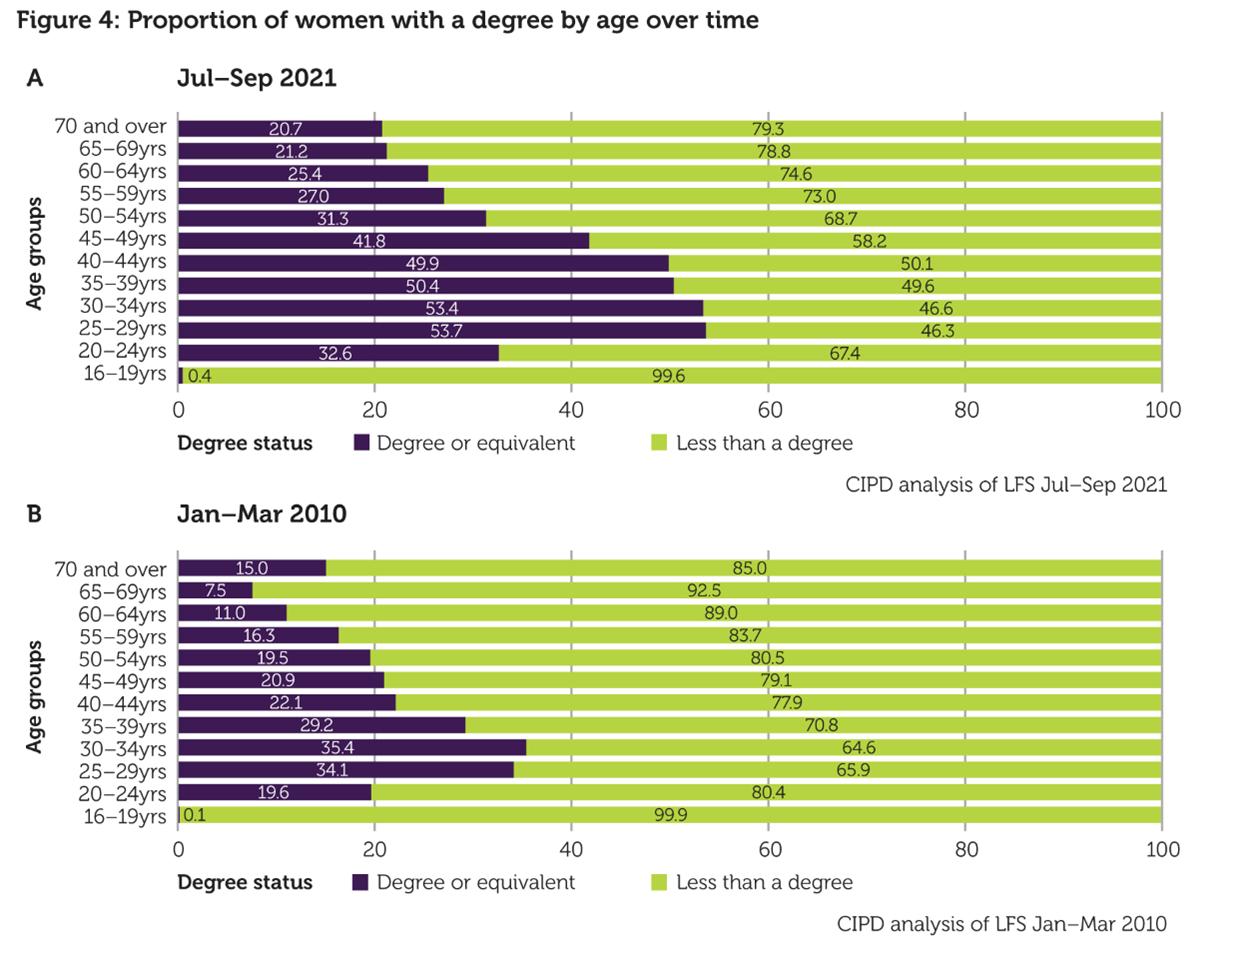
Even before gender pay gap reporting was introduced, employees and job seekers were taking pay gap data into account when applying for a job or considering whether to stay in one. Now, with gender pay gap reports available on the government’s gender pay gap viewing service site, school-leavers, graduates and older workers looking to change jobs are all now able to access information about your gender pay gap, and they are sure to do so.
CIPD guidance on reward
For more on employee attitudes to reward, take a look at the CIPD’s factsheet on reward and pay . For women, an employer’s record on equality, inclusion and diversity is especially important. PwC’s report, The Female Millennial: A new era of talent , shows that young women seek out employers with a strong record on equality, diversity and inclusion. Eighty-five per cent of female millennials surveyed said an employer’s policy on equality, diversity and workforce inclusion was important when deciding whether or not to work for them. Being open about your gender pay gap, and proactive in tackling its causes, will reduce the likelihood of your organisation being seen as a second- or third-choice employer.
What do I have to report and when?
Regulations introduced in 2017 require public, private and voluntary sector organisations, with 250 or more employees, to report annually on their gender pay gap using a specified ‘snapshot date’ relevant to their sector (see figure 5).
The snapshot date will always be 31 March for public authorities, and 5 April for all other employers, in any year in which they have 250 or more relevant employees. This date is:
- the date which determines who counts as an employee for the purposes of gender pay gap reporting
- the date used to determine employees’ hourly pay (your gender pay gap calculations are based on hourly pay, as defined by the Regulations)
- the date from which you have a year to publish your gender pay gap report.
Most employers will know if they have 250 or more employees on the relevant snapshot date (figure 5). Those whose headcount hovers around or varies above and below the 250 threshold, is so close to 250 that the definition of employee used in the Regulations means they may end up hitting 250, or includes a large number of non-standard employees employees (such as agency workers, or self-employed workers), will need to check if the Regulations apply. It’s also important to note that the definition of employee used to work out if you are a relevant employer may not be one you are used to using, and that duration of employment is not taken into account.
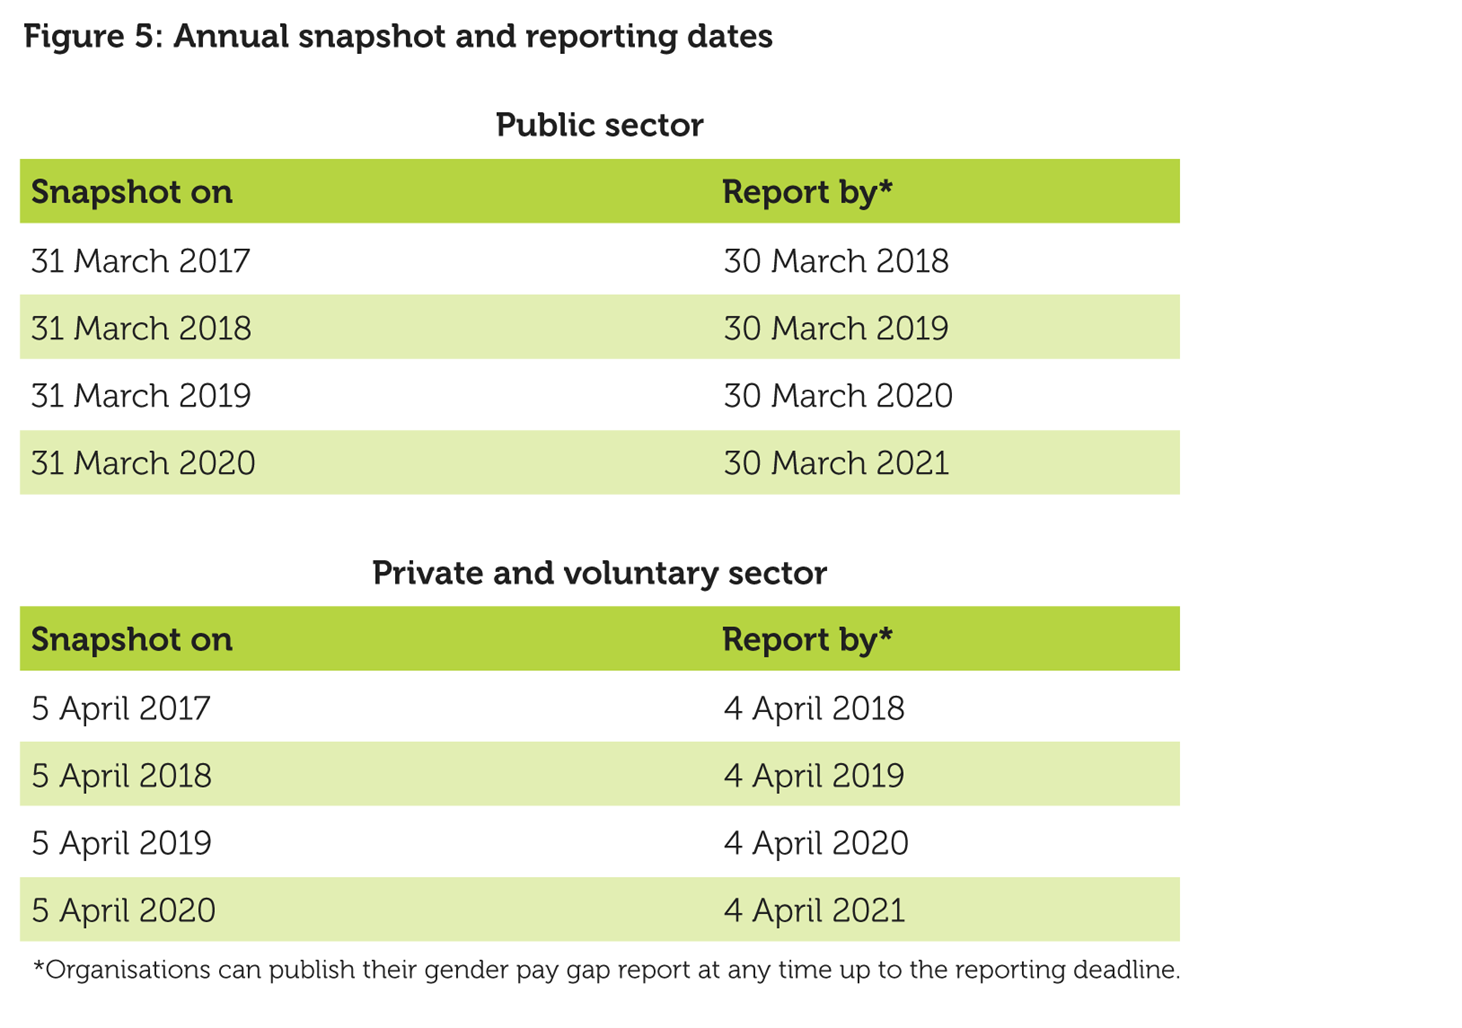
If your organisation employs fewer than 250 people, it is still a useful discipline for you to calculate the size of your organisation’s gender pay gap and think about what action may be required. We encourage all employers of whatever size to calculate and publish their pay gaps. And if your employee numbers cross over the threshold or the government should at any time lower the 250-employee reporting threshold, if you’re already collecting and analysing the data, you will be ahead of the game.
There are six different measures (figure 6) of the gender pay gap and each provides a slightly different take, but each is more meaningful if read alongside the others and in the context of your overall HR and payroll policies and practices, such as training and development, or recruitment and selection. It is likely that your recruitment practices, for example, will impact on starting salaries, which will in turn feed into both your mean and median gender pay gap figures, while the way in which you manage performance may well feed into your bonus pay gap. You will also want to read each year’s figures alongside those of previous years, both to measure progress and to gain a greater understanding of your gender pay gap.
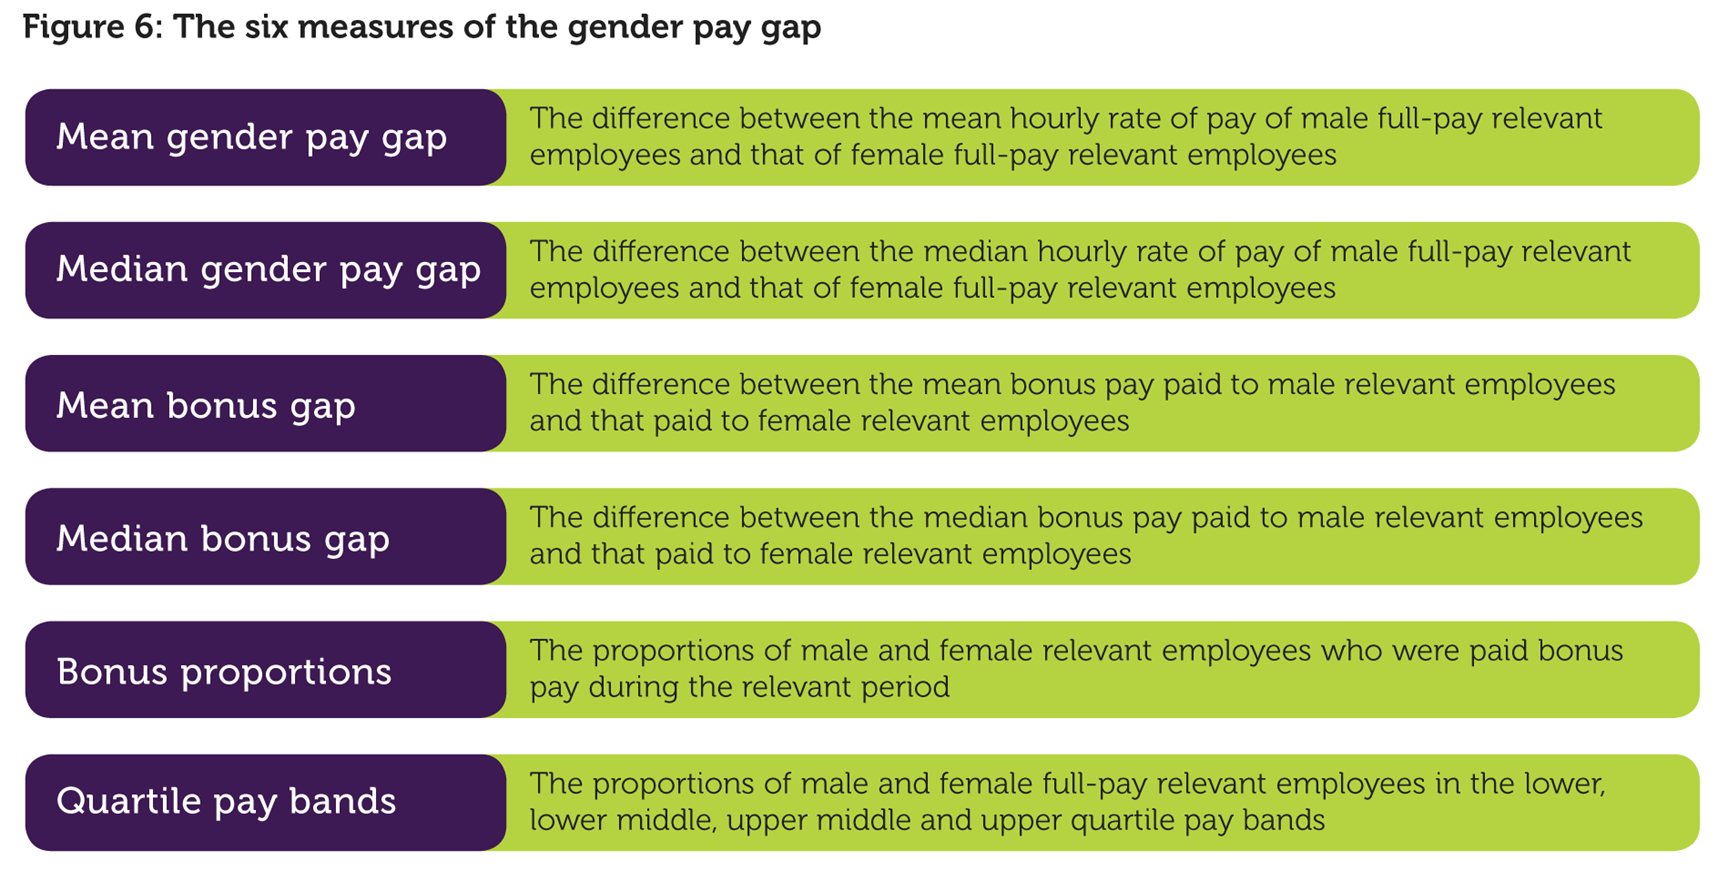
As with the snapshot date, the deadline varies depending on the sector (see figure 5 above). If you decide to publish before the deadline, which we would encourage, you may find it helpful to stick to the same date every year to ensure consistency, and help your readers gain a clearer understanding of any gender pay gap.
You must publish the required data on the UK Government’s gender pay gap reporting service website . For private and voluntary sector employers, the information will have to be accompanied by a statement confirming its accuracy, signed by a director or equivalent, which includes their name and job title. Once you have published your report on the reporting service website, it automatically appears on the government’s viewing service website, where any interested person is able to access it. The viewing service website also lets people know if a report is late.
You must also publish your pay data on your own organisation’s website in a manner that is accessible to employees and the public, and you will have to ensure that it remains there for at least three years.
We look in detail at how to calculate employee earnings in this guide . Here, you simply need to know that your calculations will be based on:
- gross ordinary pay (including basic pay, piecework pay, shift premiums, paid leave pay and allowances)
- bonus pay (personal, team bonuses and so on)
Paid in the relevant pay period (pay period including the snapshot date) and by the snapshot date (31 March for public sector, 5 April for businesses and charities).
What you say about your gender pay gap, and where and how you choose to say it, is of paramount importance. While the reporting process makes publication of your figures and the sign-off of those figures compulsory, you also have the option of including an accompanying narrative and an action plan. Communication is also about how you inform your employees and the wider world about your organisation’s gender pay gap report. We look at this in the section: How to communicate your gender pay gap .
Narratives and action plans
Although there is currently no legal obligation, the government strongly encourages employers to produce a voluntary accompanying narrative that provides context, explains any pay gaps, and sets out what actions will be taken. We also encourage you to produce a narrative, and the Regulations may change in the future.
The government’s reporting site enables you to include a link to where your full report appears on your own site. The government’s viewing service site (which mirrors the reporting site) provides readers with a link headed ‘See what this employer has to say about their gender pay gap’; clicking on this takes readers through to where your report appears on your own site.
The Regulations do not require you to publish an action plan either, or even to draw one up, but the government encourages you to do so, as do the CIPD. Uploading an action plan on your website, alongside a narrative, lets people know what action you are planning to take to address the gap, and that you are serious about doing so. In addition to helping you tackle the gender pay gap itself, drawing up an action plan will help you to answer questions about what you are doing.
We also recommend that you draw up a communications plan well before you publish any data, to ensure that you tell the story you want to tell and are ready to respond to questions. We look at this in the 'How to communicate your gender pay gap' section .
- the Equality Act 2010 (Specific Duties and Public Authorities) Regulations 2017 – these apply to public bodies
- the Equality Act 2010 (Gender Pay Gap Information) Regulations 2017 – these apply to private and voluntary sector organisations.
Who should perform the calculations?
Payroll software should do most of the work for you, so do engage with your software provider. You will also want, as with any major HR or payroll project, to ensure that you have the right skills on board to interpret your figures and understand the causes of any gap, communicate effectively to your various stakeholders, and plan how you will address your gap. Larger organisations may want to create a team that includes people with knowledge of the organisation’s payroll and HR systems, a communications expert, and someone with an understanding of statistics. The Royal Statistical Society has noted that with the introduction of gender pay gap reporting, the government is, in effect, asking HR professionals to take on some important statistical tasks, and one of the aims of this guide is to support HR professionals in obtaining, analysing and taking action on their data.
If you think you are at risk of equal pay claims
Despite some overlap, the gender pay gap is a different issue to equal pay, and the two should be considered independently. Reducing a gender pay gap does not necessarily reduce the risk of equal pay claims. The gender pay gap regulations and equal pay regulations provide more information on each.
What happens if an employer doesn't report on their gender pay gap?
Failure to comply amounts to a breach of the Equality Act 2010 and would therefore open an organisation up to action by the Equality and Human Rights Commission (EHRC). The EHRC have a series of actions and penalties that they can impose on organisations depending on the type of business and nature of the breach. We provide focused legal guidance on each of these stages in our dedicated Gender pay gap law page .
Where can I find more information?
Cipd sources.
Employment law: Equal pay: UK employment law Topic page: Flexible and hybrid working Topic page: Recruitment Topic page: Reward Factsheet: Induction
External sources
Acas Business in the Community Equality and Human Rights Commission Equal Pay Portal
Gov.UK Gender pay gap reporting service Gender pay gap viewing service website Equality Act 2010 (Gender Pay Gap Information) Regulations 2017 Equality Act 2010 (Specific Duties and Public Authorities) Regulations 2017
Tackling barriers to work today whilst creating inclusive workplaces of tomorrow.
Bullying and harassment
Discover our practice guidance and recommendations to tackle bullying and harassment in the workplace.
Related content

11 Jun, 2024

The CIPD Good Work Index provides an annual snapshot of job quality in the UK, giving insight to drive improvement to working lives

Understand the fundamentals, as well as how to choose and install the right scheme for your organisation

While offering different pay methods could be a boost for employees, we need to ensure there are no unintended consequences
Latest guides

Practical guidance on helping employees adapt and thrive when faced with workplace stress

Advice and tips on how HR professionals can support organisational and individual resilience

Guidance for employers on starting or improving an internship programme, including a checklist and model agreement

Practical advice on how to use this approach as part of your wider conflict management strategy

Goal 5: Achieve gender equality and empower all women and girls
Gender equality is not only a fundamental human right, but a necessary foundation for a peaceful, prosperous and sustainable world. There has been progress over the last decades, but the world is not on track to achieve gender equality by 2030.
Women and girls represent half of the world’s population and therefore also half of its potential. But gender inequality persists everywhere and stagnates social progress. On average, women in the labor market still earn 23 percent less than men globally and women spend about three times as many hours in unpaid domestic and care work as men.
Sexual violence and exploitation, the unequal division of unpaid care and domestic work, and discrimination in public office, all remain huge barriers. All these areas of inequality have been exacerbated by the COVID-19 pandemic: there has been a surge in reports of sexual violence, women have taken on more care work due to school closures, and 70% of health and social workers globally are women.
At the current rate, it will take an estimated 300 years to end child marriage, 286 years to close gaps in legal protection and remove discriminatory laws, 140 years for women to be represented equally in positions of power and leadership in the workplace, and 47 years to achieve equal representation in national parliaments.
Political leadership, investments and comprehensive policy reforms are needed to dismantle systemic barriers to achieving Goal 5 Gender equality is a cross-cutting objective and must be a key focus of national policies, budgets and institutions.
How much progress have we made?
International commitments to advance gender equality have brought about improvements in some areas: child marriage and female genital mutilation (FGM) have declined in recent years, and women’s representation in the political arena is higher than ever before. But the promise of a world in which every woman and girl enjoys full gender equality, and where all legal, social and economic barriers to their empowerment have been removed, remains unfulfilled. In fact, that goal is probably even more distant than before, since women and girls are being hit hard by the COVID-19 pandemic.
Are they any other gender-related challenges?
Yes. Worldwide, nearly half of married women lack decision-making power over their sexual and reproductive health and rights. 35 per cent of women between 15-49 years of age have experienced physical and/ or sexual intimate partner violence or non-partner sexual violence.1 in 3 girls aged 15-19 have experienced some form of female genital mutilation/cutting in the 30 countries in Africa and the Middle East, where the harmful practice is most common with a high risk of prolonged bleeding, infection (including HIV), childbirth complications, infertility and death.
This type of violence doesn’t just harm individual women and girls; it also undermines their overall quality of life and hinders their active involvement in society.
Why should gender equality matter to me?
Regardless of where you live in, gender equality is a fundamental human right. Advancing gender equality is critical to all areas of a healthy society, from reducing poverty to promoting the health, education, protection and the well-being of girls and boys.
What can we do?
If you are a girl, you can stay in school, help empower your female classmates to do the same and fight for your right to access sexual and reproductive health services. If you are a woman, you can address unconscious biases and implicit associations that form an unintended and often an invisible barrier to equal opportunity.
If you are a man or a boy, you can work alongside women and girls to achieve gender equality and embrace healthy, respectful relationships.
You can fund education campaigns to curb cultural practices like female genital mutilation and change harmful laws that limit the rights of women and girls and prevent them from achieving their full potential.
The Spotlight Initiative is an EU/UN partnership, and a global, multi-year initiative focused on eliminating all forms of violence against women and girls – the world’s largest targeted effort to end all forms of violence against women and girls.

Facts and figures
Goal 5 targets.
- With only seven years remaining, a mere 15.4 per cent of Goal 5 indicators with data are “on track”, 61.5 per cent are at a moderate distance and 23.1 per cent are far or very far off track from 2030 targets.
- In many areas, progress has been too slow. At the current rate, it will take an estimated 300 years to end child marriage, 286 years to close gaps in legal protection and remove discriminatory laws, 140 years for women to be represented equally in positions of power and leadership in the workplace, and 47 years to achieve equal representation in national parliaments.
- Political leadership, investments and comprehensive policy reforms are needed to dismantle systemic barriers to achieving Goal 5. Gender equality is a cross-cutting objective and must be a key focus of national policies, budgets and institutions.
- Around 2.4 billion women of working age are not afforded equal economic opportunity. Nearly 2.4 Billion Women Globally Don’t Have Same Economic Rights as Men
- 178 countries maintain legal barriers that prevent women’s full economic participation. Nearly 2.4 Billion Women Globally Don’t Have Same Economic Rights as Men
- In 2019, one in five women, aged 20-24 years, were married before the age of 18. Girls | UN Special Representative of the Secretary-General on Violence Against Children
Source: The Sustainable Development Goals Report 2023
5.1 End all forms of discrimination against all women and girls everywhere
5.2 Eliminate all forms of violence against all women and girls in the public and private spheres, including trafficking and sexual and other types of exploitation
5.3 Eliminate all harmful practices, such as child, early and forced marriage and female genital mutilation
5.4 Recognize and value unpaid care and domestic work through the provision of public services, infrastructure and social protection policies and the promotion of shared responsibility within the household and the family as nationally appropriate
5.5 Ensure women’s full and effective participation and equal opportunities for leadership at all levels of decisionmaking in political, economic and public life
5.6 Ensure universal access to sexual and reproductive health and reproductive rights as agreed in accordance with the Programme of Action of the International Conference on Population and Development and the Beijing Platform for Action and the outcome documents of their review conferences
5.A Undertake reforms to give women equal rights to economic resources, as well as access to ownership and control over land and other forms of property, financial services, inheritance and natural resources, in accordance with national laws
5.B Enhance the use of enabling technology, in particular information and communications technology, to promote the empowerment of women
5.C Adopt and strengthen sound policies and enforceable legislation for the promotion of gender equality and the empowerment of all women and girls at all levels
He for She campaign
United Secretary-General Campaign UNiTE to End Violence Against Women
Every Woman Every Child Initiative
Spotlight Initiative
United Nations Children’s Fund (UNICEF)
UN Population Fund: Gender equality
UN Population Fund: Female genital mutilation
UN Population Fund: Child marriage
UN Population Fund: Engaging men & boys
UN Population Fund: Gender-based violence
World Health Organization (WHO)
UN Office of the High Commissioner for Human Rights
UN High Commissioner for Refugees (UNHCR)
UN Education, Scientific and Cultural Organisation (UNESCO)
UN Department of Economic and Social Affairs, Gender Statistics
Fast Facts: Gender Equality

Infographic: Gender Equality

The Initiative is so named as it brings focused attention to this issue, moving it into the spotlight and placing it at the centre of efforts to achieve gender equality and women’s empowerment, in line with the 2030 Agenda for Sustainable Development.
An initial investment in the order of EUR 500 million will be made, with the EU as the main contributor. Other donors and partners will be invited to join the Initiative to broaden its reach and scope. The modality for the delivery will be a UN multi- stakeholder trust fund, administered by the Multi-Partner Trust Fund Office, with the support of core agencies UNDP, UNFPA and UN Women, and overseen by the Executive Office of the UN Secretary-General.
Related news
Press release| the world is failing girls and women, according to new un report.
Yinuo 2023-09-06T19:30:02-04:00 07 Sep 2023 |
The world is failing girls and women, according to new UN report New figure points to the need of an additional $360 billion in investment per year to achieve genderequality and women’s empowerment by 2030. [...]
Liberia, Mexico, Niger, Senegal and Sierra Leone to tackle barriers to the deployment of women in peace operations with the support of the UN Elsie Initiative Fund
Vesna Blazhevska 2021-04-28T13:20:09-04:00 28 Apr 2021 |
PRESS RELEASE 28 APRIL 2021 MEDIA ENQUIRIES [email protected] Liberia, Mexico, Niger, Senegal and Sierra Leone to tackle barriers to the deployment of women in peace operations with the support of the UN Elsie Initiative [...]
Women’s job market participation stagnating at less than 50% for the past 25 years, finds UN report
Vesna Blazhevska 2020-10-20T15:06:56-04:00 20 Oct 2020 |
New York, 20 October – Less than 50% of working-age women are in the labour market, a figure that has barely changed over the last quarter of a century, according to a new UN report launched today. Unpaid domestic and care work falls disproportionately on women, restraining their economic potential as the COVID-19 pandemic additionally affects women’s jobs and livelihoods, the report warns.
Related videos
11-13 june | 17th session of the conference of states parties to the crpd (cosp17), world oceans day event highlights immediate action to protect oceans.
UN World Oceans Day, celebrated on Friday at UN Headquarters in New York, focused on “opening minds, igniting senses, and inspiring possibilities” to protect marine life worldwide. Read Full Story on UN News
Media advisory | Rethinking Disability Inclusion: A Global Call to Action
Conference of States Parties to the Convention on the Rights of Persons with Disabilities Rethinking Disability Inclusion: A Global Call to Action Follow LIVE on UN Web TV At a time when the world is [...]
- Share full article
Advertisement
Supported by
Guest Essay
The Gender Gap Is Now a Gender Gulf

By Thomas B. Edsall
Mr. Edsall contributes a weekly column from Washington, D.C., on politics, demographics and inequality.
Regardless of who wins the presidential election, the coalitions supporting President Biden and Donald Trump on Nov. 5, 2024, will be significantly different from those on Nov. 3, 2020.
On May 22, Split Ticket , a self-described “group of political and election enthusiasts” who created a “website for their mapping, modeling and political forecasting,” published “ Cross Tabs at a Crossroads : Six Months Out.”
Split Ticket aggregated “subgroup data from the cross tabs of 12 reputable national 2024 general election polls” and compared them with 2020 election results compiled by Pew, Catalist and A.P.
Combining data from multiple surveys allowed Split Ticket to analyze large sample sizes and reduce margins of error for key demographic groups.
The Split Ticket report identified the groups in which Trump and Biden are gaining or losing ground.
In Biden’s case, the analysis shows the president falling behind his 2020 margins among Black voters (down 23 percentage points); urban voters (down 15 points); independents, including so-called partisan leaners (down 14); Latinos (down 13); moderates (down 13); and voters ages 18 to 29 (down 12).
We are having trouble retrieving the article content.
Please enable JavaScript in your browser settings.
Thank you for your patience while we verify access. If you are in Reader mode please exit and log into your Times account, or subscribe for all of The Times.
Thank you for your patience while we verify access.
Already a subscriber? Log in .
Want all of The Times? Subscribe .
COMMENTS
Many believe that in this 21 st century, gender impacts the level of income an individual can attain, especially women who it seems to be affecting the most. However, in the U.K the rate at which the gender pay gap is increasing is as of date one of the highest in the EU. Men earn 18.1% more than woman, in relation to the difference between ...
Median pay for all employees was 14.3% less for women than for men in April 2023. The full-time pay gap has been getting smaller since 1997 and the overall pay gap has also decreased over the period. The part-time pay gap has generally remained small and negative, with women earning more than men on average.
The gender pay gap in the UK: children and experience in work Monica Costa Dias, Robert Joyce,* ** and Francesca Parodi*** Abstract: In this study, we document the evolution of the gender pay gap in the UK over the past three decades and its association with fertility, examining the role of various differences in career patterns
This briefing provides statistics on the size of the gender pay gap in the UK and looks at some of the reasons why there is a gender pay gap. Note that figures for 2020 especially, but also 2021, should be treated with ... Gender Pay Gap, explains that while unequal pay is a cause of the pay gap, there are also other contributing factors. It says:
The report contributes to ongoing efforts to monitor the Gender Pay Gap (GPG) in an effort to approach parity in pay for men and women. ONS estimates suggest a median gender pay gap of 19.3% in 2015 for the UK as a whole, in its analysis of the Annual Survey of Hours and Earnings (ASHE) data.
But of the 4,428 employers — out of an estimated 9,000 total — who had reported by Tuesday at 2pm GMT, three out of every four pay men more on average, while only just over one in 10 pays women more, based on the median hourly pay gap. The remaining 1 per cent report no pay gap at all. The average, measured by the median, is 9.9 per cent.
I.Introduction. Gender differences in earnings are essentially universal across countries. Within the developed world those gaps have tended to fall greatly over the last century, although progress has stalled in recent decades and the gaps remain sizeable (Goldin, 2014; Blau and Kahn, 2017).The opening of the pay gap happens gradually over the course of life and is strongly related with the ...
gender pay gaps that are similar to the UK average, although the gap is slightly ... The gender pay gap is larger in the private sector, at £3.11 per hour over the period 1993-2014, than in the public sector where the gap is £2.38 per hour (adjusted for inflation). The pay gap between male and female graduates in the
The work uses decomposition techniques to analyse the main predictors of the gender pay gap using waves of the British Household Panel Survey (BHPS) and the United Kingdom Household Longitudinal ...
The clearest insight into the gender pay gap is provided by analysis across age groups. For groups aged under 40 years, the gender pay gap for full-time employees (which is a more homogenous basis than all employees for measuring differences in hourly pay) is low, at 3.2% or below. This has been the case since 2017.
2. Introduction. The gender pay gap has always been a topic of interest, but in an attempt to increase awareness and improve pay equality, the UK government introduced compulsory reporting of the gender pay gap for organisations with 250 or more employees by April 2018 1.For the UK as a whole, the gap has reduced in the last 10 years but is still in favour of men 2.
The UK Higher Education (HE) sector has historically been male dominated, with evidence of horizontal and vertical segregation (Fagan & Teasdale, 2021).Job segregation by gender is also an international phenomenon (Macarie & Moldovan, 2015; Peng et al., 2017; Rabovsky & Lee, 2018).There is evidence for the closing of the HE gender gap internationally in recent decades (Baker, 2016) and an ...
Abstract. Equal pay legislation has been in existence for over 40 years in the UK and the legal rules dealing with equal pay have been consolidated and amended recently with the implementation of the Equality Act 2010. However, despite this, problems can still be identified with equal pay in the UK, most notably the continued existence of a ...
The difference in pay, expressed in gender pay gap terms, is 14.8% for full-time employees. This is much higher than the gap among median earners (7.7%), which in turn is also higher than the bottom 10% of earners (3.1%). The changes to the gender pay gap across all deciles have been minimal between 2022 and 2023.
The gender pay gap is driven at least in part by the cumulative impact of many instances over the course of women's lives when they are treated differently than their male peers. Girls can be steered toward gender-normative careers from a very early age. At a time when parental influence is key, parents are often more likely to expect their ...
A gender pay gap of 9.4%, which is the national average, means that the average woman at a company earns 91p for each £1 earned by the average man. Pay gap v unequal pay. The median gender pay ...
The findings suggest that the gender pay gap has a significant impact on women's economic empowerment, limiting their financial independence and autonomy. The study also highlights the need for ...
Getty Images. The gender pay gap in the UK will "take 45 years to close", according to data from PwC, despite organisations reporting a decrease in their pay gaps this year. According to PwC's Mandatory UK Gender Pay Gap Reporting, an analysis of the gender pay gap using government data, the mean hourly pay gap has dropped by 0.4 per cent ...
The gender pay gap in the UK has been persistent despite the Equal Pay Act 1970. Universities were given a positive duty to redress this in the Equality Act 2010. Some British universities introduced a system of 'professorial banding'. All professors were regraded from scratch. Surprisingly, this had almost no impact on the gender pay gap.
The gender pay gap is just one relevant instance of if gender disparity. Mortimer (2018) describes the prevalence of unequal pay between men and women in the UK. According to the article, men were paid 9% -10% more than their female counterparts on average leading to the conclusion that a wage disparity exists based on gender in the UK.
Evidence suggests that the following actions can support women in your organisation to progress and help to close the gender pay gap: create an inclusive culture. support women's career ...
In April 2023, the UK's gender pay gap for full-time employees was 7.7%, meaning that average pay for full-time female employees was 7.7% lower than for full-time male employees, or for every £1 a full-time male employee earned, a full-time female worker earned 92.3 pence.
On average, women earn less than men in equivalent employment. The gap between men and women's pay for full-time workers was 7.4% in April 2020, compared with 9.5% in 2015. The gender pay gap for ...
Goal 5: Achieve gender equality and empower all women and girls. Gender equality is not only a fundamental human right, but a necessary foundation for a peaceful, prosperous and sustainable world ...
2.1 Ordinary pay. The mean gender pay gap is the difference between men's and women's average. For Tata Technologies' full pay relevant employees, the mean gender pay gap is 21.6% in favour of men. The median gender pay gap is 10.47% also in favour of men. 21.6% Mean gender pay gap.
In a June 2023 essay, ... P.R.R.I.'s study on Gen Z shows a gender gap, certainly, on ideology, but Gen Z men are still slightly more likely to self-identify as liberal than conservative." ...