

Statistics in Year 2 (age 6–7)
In Year 2, your child will learn to draw simple charts and graphs. They will be able to sort categories by their quantities and will be able to compare sets of data.
The key words for this section are block graph , pictogram , and tally chart .
What your child will learn
Take a look at the National Curriculum expectations for statistics in Year 2 (age 6–7):
Draw pictograms, tally charts, block diagrams, and tables
A pictogram is a graph that uses pictures to represent quantity:

A tally chart uses marks to represent numbers:

Your child will use block graphs (or block diagrams) where types of items are shown on the x -axis , the number of items is shown on the y -axis , and one block represents one item. A block graph is made up of separate blocks, and children can count the blocks to find out how many are in the group:

Count objects in multiple category and sort the categories by quantity
Your child will ask and answer simple questions about pictograms , tally charts , block graphs , and simple tables. For example:
How many children like grapes? How many children like apples and bananas? How many more children prefer apples to grapes?
Total and compare categorical data
Your child will ask and answer questions about data they collect. For example:
How many children took part in the survey? What was their most popular option?
How to help at home
There are lots of everyday ways you can help your child to understand statistics. Here are just a few ideas.
1. Present data
In school, your child will be learning to present data with simple tables, pictograms , tally charts , and block graphs . You can encourage your child at home by having them investigate topics that particularly interest them and then present their data in tables, charts, and graphs.
For instance, your child could collect information about the planets in our solar system, favourite book characters, or football. See if they can create their own tables, charts, and graphs to represent the data in new and interesting ways. For example, they could by compare football players by goals scored so far this season.
Your child can record their findings using tables and present them with pictograms or block graphs.
Your child might need extra help when it comes to creating block graphs. Block graphs show types of items on the x -axis , the number of items on the y -axis , and have one block representing each item:
Once your child has practised lots of different ways of showing data, your child should be able to pick when it is best to use a block graph and when it is best to use a different method. They should be able to explain why.
2. Conduct a survey
If your child would prefer to gather their own data, why not do a survey? They could ask family and friends about their favourite food, film, sport, or anything else that takes their fancy.
Encourage your child to analyse their data and discuss any interesting findings. For example, did lots of people have the same favourite food? How many more people chose the most popular choice compared to the least popular choice?
Ask questions about the data they have found and encourage your child to begin asking their own questions, such as, ‘If I asked this question at school, would I get different results?’
3. Interpret data
You can help your child learn to interpret data in the form of tables, pictograms , tally charts , and block graphs by encouraging them to explore interesting topics. For example, if your child is interested in football, encourage them to interpret football team statistics in tables, charts, and graphs. You can find lots of examples online and in football magazines.
Look at non-fiction texts together. Can your child find any data presented in interesting ways? Encourage them to chat about the data they find and point out anything they would not have expected.
- Age 3–4 (Early Years)
- Age 4–5 (Reception)
- Age 5–6 (Year 1)
- Age 6–7 (Year 2)
- Age 7–8 (Year 3)
- Age 8–9 (Year 4)
- Age 9–10 (Year 5)
- Age 10–11 (Year 6)
- Year 1 (age 5–6)
- Year 2 (age 6–7)
- Year 3 (age 7–8)
- Year 4 (age 8–9)
- Year 5 (age 9–10)
- Year 6 (age 10–11)
- Help with times tables
- Ratio & proportion
- Learning to tell the time
- Numicon parent guide
- MyMaths parent guide
- Maths activity books
- STEM Ambassadors
- School trusts
- ITE and governors
- Invest in schools
- STEM careers inspiration
- Benefits and impact
- Our supporters
- Become a STEM Ambassador
- Request a STEM Ambassador
- Employer information
- Training and support
- STEM Ambassadors Partners
- Working with community groups
- Search icon
- Join the STEM Community
Year 2: Statistics
This list consists of visual resources, activities and games designed to support the new curriculum programme of study in Year Two. Containing tips on using the resources and suggestions for further use, it covers:
Interpret and construct simple pictograms, tally charts, block diagrams and simple tables, ask and answer simple questions by counting the number of objects in each category and sorting the categories by quantity, ask and answer questions about totalling and comparing categorical data.
Visit the primary mathematics webpage to access all lists.
Sticky Data
This NRICH investigation asks children to work together, in a hands-on way, to display data about their own class. The use of sticky notes, which are all the same size, makes it a great introduction to block graphs.
Extra online content finder
Use this content finder to find SolutionBank, GeoGebra interactives and Casio calculator support for Statistics and Mechanics Year 2. The chapter links below take you the interactives and calculator support for each chapter and to full worked solutions for each exercise. You can also download SolutionBank for the whole textbook.
Technical support
Statistics and Mechanics 2 combined SolutionBank
1 Regression, correlation and hypothesis testing
2 Conditional probability
3 The normal distribution
Review exercise 1
4 Moments
5 Forces and friction
6 Projectiles
7 Applications of forces
8 Further kinematics
Review exercise 2
Practice exam paper, 1 regression, correlation and hypothesis testing.
Return to top
• Page 3: Explore the original and coded data graphically using technology.
• GeoGebra interactive
• Exercise 1A SolutionBank
• Page 6: Use your calculator to calculate the PMCC.
• Graphic calculator tutorial
• Scientific calculator tutorial
• Exercise 1B SolutionBank
• Exercise 1C SolutionBank
• Mixed exercise 1 SolutionBank
2 Conditional probability
• Page 17: Explore set notation on a Venn diagram using GeoGebra.
• Exercise 2A SolutionBank
• Exercise 2B SolutionBank
• Exercise 2C SolutionBank
• Exercise 2D SolutionBank
• Exercise 2E SolutionBank
• Mixed exercise 2 SolutionBank
3 The normal distribution
• Page 40: Explore the normal distribution curve using technology.
• Exercise 3A SolutionBank
• Page 41: Use the Normal CD function on your calculator to find probabilities from a normal distribution.
• Exercise 3B SolutionBank
• Page 45: Use the Inverse Normal function on your calculator to calculate values which satisfy given probability statements for the normal distribution.
• Exercise 3C SolutionBank
• Exercise 3D SolutionBank
• Page 50: Use the Inverse Normal function on your calculator with the standard normal distribution.
• Exercise 3E SolutionBank
• Exercise 3F SolutionBank
• Page 58: Use the inverse normal distribution function on your calculator to find the critical region directly.
• Exercise 3G SolutionBank
• Mixed exercise 3 SolutionBank
• Review exercise 1 SolutionBank
4 Moments
• Page 71: Explore the moment of a force acting about a point using GeoGebra.
• Exercise 4A SolutionBank
• Exercise 4B SolutionBank
• Exercise 4C SolutionBank
• Page 80: Explore the moment acting about pivot M using GeoGebra
• Exercise 4D SolutionBank
• Page 83: See the point at which the beam starts to tilt due to the weight of the child and explore the problem with different forces and distances using GeoGebra.
• Exercise 4E SolutionBank
• Mixed exercise 4 SolutionBank
5 Forces and friction
• Page 94: Explore the resultant of two forces using GeoGebra.
• Exercise 5A SolutionBank
• Exercise 5B SolutionBank
• Page 102: Explore this problem with different masses, slopes and frictional coefficients using GeoGebra.
• Exercise 5C SolutionBank
• Mixed exercise 5 SolutionBank
6 Projectiles
• Exercise 6A SolutionBank
• Page 112: Find cos α and sin α using your calculator.
• Exercise 6B SolutionBank
• Page 115: Use your calculator to solve a quadratic equation.
• Exercise 6C SolutionBank
• Page 120: Explore the parametric equations for the path of the particle and their Cartesian form, both algebraically and graphically using technology.
• Exercise 6D SolutionBank
• Mixed exercise 6 SolutionBank
7 Applications of forces
• Exercise 7A SolutionBank
• Exercise 7B SolutionBank
• Page 139: Use the STO function to store exact values on your calculator.
• Exercise 7C SolutionBank
• Page 143: Explore the forces in this question in a more detailed diagram using GeoGebra.
• Exercise 7D SolutionBank
• Exercise 7E SolutionBank
• Exercise 7F SolutionBank
• Mixed exercise 7 SolutionBank
8 Further kinematics
• Page 160: Explore the solution to this example using technology.
• Page 162: Explore the solution to this example using technology.
• Exercise 8A SolutionBank
• Exercise 8B SolutionBank
• Exercise 8C SolutionBank
• Exercise 8D SolutionBank
• Exercise 8E SolutionBank
• Mixed exercise 8 SolutionBank
• Review exercise 2 SolutionBank
• Practice exam paper SolutionBank
If you are having issues accessing the links in this content folder, check this list of common problems .
Alternatively you can get in touch by phone or email. Our digital support team are available from 8 am to 5 pm Monday to Friday (excluding bank holidays).
Email [email protected], tel. 0845 313 8888*
Please provide as much detail as possible in your email:
• the product you are using (e.g. ActiveLearn Digital Service)
• the nature of the problem, including any error messages that have appeared
• the steps you have already taken to solve the problem
• the computer being used (e.g. which version of Windows, which browser)
• your contact details including a telephone number
Where we do need to call you, if possible, please be at the computer or workstation that is experiencing technical difficulty.
* Calls to 0845 numbers cost 3p per minute, plus your phone company's access charge. International call charges vary.
Statistics and Probability Worksheets
Welcome to the statistics and probability page at Math-Drills.com where there is a 100% chance of learning something! This page includes Statistics worksheets including collecting and organizing data, measures of central tendency (mean, median, mode and range) and probability.
Students spend their lives collecting, organizing, and analyzing data, so why not teach them a few skills to help them on their way. Data management is probably best done on authentic tasks that will engage students in their own learning. They can collect their own data on topics that interest them. For example, have you ever wondered if everyone shares the same taste in music as you? Perhaps a survey, a couple of graphs and a few analysis sentences will give you an idea.
Statistics has applications in many different fields of study. Budding scientists, stock market brokers, marketing geniuses, and many other pursuits will involve managing data on a daily basis. Teaching students critical thinking skills related to analyzing data they are presented will enable them to make crucial and informed decisions throughout their lives.
Probability is a topic in math that crosses over to several other skills such as decimals, percents, multiplication, division, fractions, etc. Probability worksheets will help students to practice all of these skills with a chance of success!
Most Popular Statistics and Probability Worksheets this Week

Mean, Median, Mode and Range Worksheets
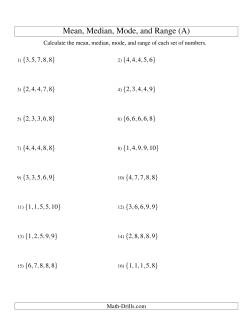
Calculating the mean, median, mode and range are staples of the upper elementary math curriculum. Here you will find worksheets for practicing the calculation of mean, median, mode and range. In case you're not familiar with these concepts, here is how to calculate each one. To calculate the mean, add all of the numbers in the set together and divide that sum by the number of numbers in the set. To calculate the median, first arrange the numbers in order, then locate the middle number. In sets where there are an even number of numbers, calculate the mean of the two middle numbers. To calculate the mode, look for numbers that repeat. If there is only one of each number, the set has no mode. If there are doubles of two different numbers and there are more numbers in the set, the set has two modes. If there are triples of three different numbers and there are more numbers in the set, the set has three modes, and so on. The range is calculated by subtracting the least number from the greatest number.
Note that all of the measures of central tendency are included on each page, but you don't need to assign them all if you aren't working on them all. If you're only working on mean, only assign students to calculate the mean.
In order to determine the median, it is necessary to have your numbers sorted. It is also helpful in determining the mode and range. To expedite the process, these first worksheets include the lists of numbers already sorted.
- Calculating Mean, Median, Mode and Range from Sorted Lists Sets of 5 Numbers from 1 to 10 Sets of 5 Numbers from 10 to 99 Sets of 5 Numbers from 100 to 999 Sets of 10 Numbers from 1 to 10 Sets of 10 Numbers from 10 to 99 Sets of 10 Numbers from 100 to 999 Sets of 20 Numbers from 10 to 99 Sets of 15 Numbers from 100 to 999
Normally, data does not come in a sorted list, so these worksheets are a little more realistic. To find some of the statistics, it will be easier for students to put the numbers in order first.
- Calculating Mean, Median, Mode and Range from Unsorted Lists Sets of 5 Numbers from 1 to 10 Sets of 5 Numbers from 10 to 99 Sets of 5 Numbers from 100 to 999 Sets of 10 Numbers from 1 to 10 Sets of 10 Numbers from 10 to 99 Sets of 10 Numbers from 100 to 999 Sets of 20 Numbers from 10 to 99 Sets of 15 Numbers from 100 to 999
Collecting and Organizing Data
Teaching students how to collect and organize data enables them to develop skills that will enable them to study topics in statistics with more confidence and deeper understanding.
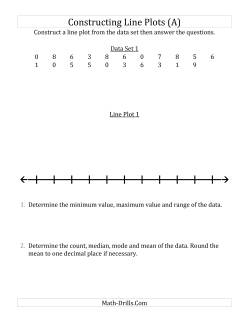
- Constructing Line Plots from Small Data Sets Construct Line Plots with Smaller Numbers and Lines with Ticks Provided (Small Data Set) Construct Line Plots with Smaller Numbers and Lines Only Provided (Small Data Set) Construct Line Plots with Smaller Numbers (Small Data Set) Construct Line Plots with Larger Numbers and Lines with Ticks Provided (Small Data Set) Construct Line Plots with Larger Numbers and Lines Only Provided (Small Data Set) Construct Line Plots with Larger Numbers (Small Data Set)
- Constructing Line Plots from Larger Data Sets Construct Line Plots with Smaller Numbers and Lines with Ticks Provided Construct Line Plots with Smaller Numbers and Lines Only Provided Construct Line Plots with Smaller Numbers Construct Line Plots with Larger Numbers and Lines with Ticks Provided Construct Line Plots with Larger Numbers and Lines Only Provided Construct Line Plots with Larger Numbers
Interpreting and Analyzing Data
Answering questions about graphs and other data helps students build critical thinking skills. Standard questions include determining the minimum, maximum, range, count, median, mode, and mean.
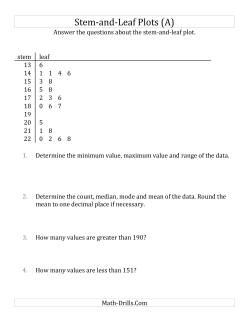
- Answering Questions About Stem-and-Leaf Plots Stem-and-Leaf Plots with about 25 data points Stem-and-Leaf Plots with about 50 data points Stem-and-Leaf Plots with about 100 data points
- Answering Questions About Line Plots Line Plots with Smaller Data Sets and Smaller Numbers Line Plots with Smaller Data Sets and Larger Numbers Line Plots with Larger Data Sets and Smaller Numbers Line Plots with Larger Data Sets and Larger Numbers
- Answering Questions About Broken-Line Graphs Answer Questions About Broken-Line Graphs
- Answering Questions About Circle Graphs Circle Graph Questions (Color Version) Circle Graph Questions (Black and White Version) Circle Graphs No Questions (Color Version) Circle Graphs No Questions (Black and White Version)
- Answering Questions About Pictographs Answer Questions About Pictographs
Probability Worksheets
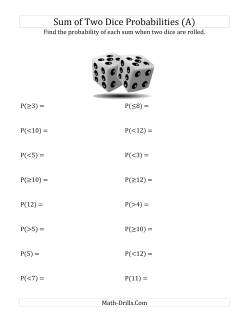
- Calculating Probabilities with Dice Sum of Two Dice Probabilities Sum of Two Dice Probabilities (with table)
Spinners can be used for probability experiments or for theoretical probability. Students should intuitively know that a number that is more common on a spinner will come up more often. Spinning 100 or more times and tallying the results should get them close to the theoretical probability. The more sections there are, the more spins will be needed.
- Calculating Probabilities with Number Spinners Number Spinner Probability (4 Sections) Number Spinner Probability (5 Sections) Number Spinner Probability (6 Sections) Number Spinner Probability (7 Sections) Number Spinner Probability (8 Sections) Number Spinner Probability (9 Sections) Number Spinner Probability (10 Sections) Number Spinner Probability (11 Sections) Number Spinner Probability (12 Sections)
Non-numerical spinners can be used for experimental or theoretical probability. There are basic questions on every version with a couple extra questions on the A and B versions. Teachers and students can make up other questions to ask and conduct experiments or calculate the theoretical probability. Print copies for everyone or display on an interactive white board.
- Probability with Single-Event Spinners Animal Spinner Probability ( 4 Sections) Animal Spinner Probability ( 5 Sections) Animal Spinner Probability ( 10 Sections) Letter Spinner Probability ( 4 Sections) Letter Spinner Probability ( 5 Sections) Letter Spinner Probability ( 10 Sections) Color Spinner Probability ( 4 Sections) Color Spinner Probability ( 5 Sections) Color Spinner Probability ( 10 Sections)
- Probability with Multi-Event Spinners Animal/Letter Combined Spinner Probability ( 4 Sections) Animal/Letter Combined Spinner Probability ( 5 Sections) Animal/Letter Combined Spinner Probability ( 10 Sections) Animal/Letter/Color Combined Spinner Probability ( 4 Sections) Animal/Letter/Color Combined Spinner Probability ( 5 Sections) Animal/Letter/Color Combined Spinner Probability ( 10 Sections)
Copyright © 2005-2024 Math-Drills.com You may use the math worksheets on this website according to our Terms of Use to help students learn math.
We are aware of some issues with pdfs on the website after last night's update. Some should now be fixed and others will be later today.

Edexcel Statistics & Mechanics Year 2 SolutionBank

University of Warwick - BSc Accounting & Finance
Accounting & Finance student with an excellent academic background and 2+ years of private tutoring experience.

Ch. 1: Regression, Correlation and Hypothesis Testing
- Exercise 1A
- Exercise 1B
- Exercise 1C
- Mixed Exercise 1
Ch. 2: Conditional Probability
- Exercise 2A
- Exercise 2B
- Exercise 2C
- Exercise 2D
- Exercise 2E
- Mixed Exercise 2
Ch. 3: The Normal Distribution
- Exercise 3A
- Exercise 3B
- Exercise 3C
- Exercise 3D
- Exercise 3E
- Exercise 3F
- Exercise 3G
- Mixed Exercise 3
Ch. 4: Moments
- Exercise 4A
- Exercise 4B
- Exercise 4C
- Exercise 4D
- Exercise 4E
- Mixed Exercise 4
Ch. 5: Forces and Friction
- Exercise 5A
- Exercise 5B
- Exercise 5C
- Mixed Exercise 5
Ch. 6: Projectiles
- Exercise 6A
- Exercise 6B
- Exercise 6C
- Exercise 6D
- Mixed Exercise 6
Ch. 7: Applications of Forces
- Exercise 7A
- Exercise 7B
- Exercise 7C
- Exercise 7D
- Exercise 7E
- Exercise 7F
- Mixed Exercise 7
Ch. 8: Further Kinematics
- Exercise 8A
- Exercise 8B
- Exercise 8C
- Exercise 8D
- Exercise 8E
- Mixed Exercise 8
Review Exercises
- Review Exercise 1
- Review Exercise 2
- Practice Exam Paper
Connect with PMT Education!
- Revision Courses
- Past Papers
- Solution Banks
- University Admissions
- Numerical Reasoning
- Legal Notices
Popular searches in the last week:
Problem-solving maths investigations for year 2.
Hamilton provide an extensive suite of problem-solving maths investigations for Year 2 to facilitate mathematical confidence, investigative inquiry and the development of maths meta skills in 'low floor – high ceiling' activities for all.
Explore all our in-depth problem solving investigations for Year 2 .
Use problem-solving investigations within every unit to encourage children to develop and exercise their ability to reason mathematically and think creatively.
Investigations provide challenges that offer opportunities for the development of the key mathematical skills while deepening conceptual understanding. They are designed to be accessible in different ways to all children. An added bonus is the substantial amount of extra calculation practice they often incorporate! The problems are designed to help children identify patterns, to explore lines of thinking and to reason and communicate about properties of numbers, shapes and measures.
Hamilton provide a mix of our own specially commissioned investigations, that include guidance for teachers together with a child-friendly sheet to guide your pupils through the investigation, as well as links to investigations on other highly regarded websites.
I am very grateful for Hamilton Trust resources, particularly the maths investigations. Julia, teacher in Wiltshire
You can find Hamilton's investigations for Year 2:
- Individually, they are incorporated into every unit in our Year 2 flexible maths blocks .
- Collectively, they appear on our resources page where you can explore all our in-depth problem solving investigations for Year 2 .
Do read our extensive range of advice for more information about the investigations and for tips on how to use them effectively.
Hamilton’s problem-solving investigations are 'low floor, high ceiling' activities that give all children opportunities to develop mastery and mathematical meta-skills. Explore a set for a whole year group.
Hamilton’s Problem-solving Investigations provide school-wide solutions to the challenges of building investigative skills from Early Years to Year 6.
This site uses cookies to give you the most relevant information. Learn more
Log in or sign up to get access to this resource
School subscription, reduce teacher workload.
From £155 (+ VAT) per year. Access to all key stages for multiple users.
Individual Subscription
For inspirational teaching.
Just £45 (£37.50 + VAT) per year to get access to all resources.
Early Career Teacher
Develop your teaching.
Just £33 (£27.50 + VAT) to get access to all resources for 2 years.
Taster Account
100s of resources.
Register to access all free resources.
Already subscribed?
Log in to get access.
If you're seeing this message, it means we're having trouble loading external resources on our website.
If you're behind a web filter, please make sure that the domains *.kastatic.org and *.kasandbox.org are unblocked.
To log in and use all the features of Khan Academy, please enable JavaScript in your browser.
Statistics and probability
Unit 1: analyzing categorical data, unit 2: displaying and comparing quantitative data, unit 3: summarizing quantitative data, unit 4: modeling data distributions, unit 5: exploring bivariate numerical data, unit 6: study design, unit 7: probability, unit 8: counting, permutations, and combinations, unit 9: random variables, unit 10: sampling distributions, unit 11: confidence intervals, unit 12: significance tests (hypothesis testing), unit 13: two-sample inference for the difference between groups, unit 14: inference for categorical data (chi-square tests), unit 15: advanced regression (inference and transforming), unit 16: analysis of variance (anova).
- Home |
- About |
- Contact Us |
- Privacy |
- Copyright |
- Shop |
- 🔍 Search Site
- Kindergarten
- All Generated Sheets
- Place Value Generated Sheets
- Addition Generated Sheets
- Subtraction Generated Sheets
- Multiplication Generated Sheets
- Division Generated Sheets
- Money Generated Sheets
- Negative Numbers Generated Sheets
- Fraction Generated Sheets
- Place Value Zones
- Number Bonds
- Addition & Subtraction
- Times Tables
- Fraction & Percent Zones
- All Calculators
- Fraction Calculators
- Percent calculators
- Area & Volume Calculators
- Age Calculator
- Height Calculator
- Roman Numeral Calculator
- Coloring Pages
- Fun Math Sheets
- Math Puzzles
- Mental Math Sheets
- Online Times Tables
- Online Addition & Subtraction
- Math Grab Packs
- All Math Quizzes
- 1st Grade Quizzes
- 2nd Grade Quizzes
- 3rd Grade Quizzes
- 4th Grade Quizzes
- 5th Grade Quizzes
- 6th Grade Math Quizzes
- Place Value
- Rounding Numbers
- Comparing Numbers
- Number Lines
- Prime Numbers
- Negative Numbers
- Roman Numerals
- Subtraction
- Add & Subtract
- Multiplication
- Fraction Worksheets
- Learning Fractions
- Fraction Printables
- Percent Worksheets & Help
- All Geometry
- 2d Shapes Worksheets
- 3d Shapes Worksheets
- Shape Properties
- Geometry Cheat Sheets
- Printable Shapes
- Coordinates
- Measurement
- Math Conversion
- Statistics Worksheets
- Bar Graph Worksheets
- Venn Diagrams
- All Word Problems
- Finding all possibilities
- Logic Problems
- Ratio Word Problems
- All UK Maths Sheets
- Year 1 Maths Worksheets
- Year 2 Maths Worksheets
- Year 3 Maths Worksheets
- Year 4 Maths Worksheets
- Year 5 Maths Worksheets
- Year 6 Maths Worksheets
- All AU Maths Sheets
- Kindergarten Maths Australia
- Year 1 Maths Australia
- Year 2 Maths Australia
- Year 3 Maths Australia
- Year 4 Maths Australia
- Year 5 Maths Australia
- Meet the Sallies
- Certificates
Year 2 Maths Worksheets UK Hub Page
Welcome to Math Salamanders Year 2 Maths Worksheets hub page.
In our Year 2 area, you will find a wide range of printable math worksheets and Maths activities for your child to enjoy.
Come and take a look at our dot-to-dot pages, or our maths games. Perhaps you would prefer our 2d shape worksheets, or learning about numbers using our number line worksheets?
Hopefully you will find something here to meet your child's maths requirements!
For full functionality of this site it is necessary to enable JavaScript.
Here are the instructions how to enable JavaScript in your web browser .
- This page contains links to other Math webpages where you will find a range of activities and resources.
- If you can't find what you are looking for, try searching the site using the Google search box at the top of each page.
Year 2 Maths Learning
Here are some of the key learning objectives for the end of Year 2:
- know and use Place value up to 100
- Compare and order numbers up to 100
- Counting on and back in 1s and 10s
- count in 2s, 5s and 10s
- Position numbers on a number line up to 1000
- use addition and subtraction facts to 20
- use related facts for addition and subtraction
- add or subtract 1 or 10 from a 2-digit number
- add and subtract 2-digit numbers
- number bonds to 100 using tens only
- add three single-digit numbers
- recognise and make equal groups
- use the x symbol to write multiplication sentences
- use arrays and pictures to represent multiplication sentences
- know multiplication facts for the 2, 5 and 10 times table
- recognise and find a half, a quarter and a third
- understand and use fraction notation
- understand the equivalence of a half and two-quarters
- count on in halves, thirds and quarters up to 10
- count in pence: 1p, 2p ,5p, 10p and 20p
- count in pounds: £1, £2, £5, £10 and £20
- find a simple total or difference between two money amounts
- find the change from simple amounts
- tell the time: o'clock, half-past, quarter-past and to
- understand and compare durations of time
- compare and measure length, mass, volume, capacity and temperature
- read a variety of scales going up in 1s, 2s, 5s and 10s
- recognise 2D and 3D shapes
- count sides and vertices on 2D shapes
- count faces, edges and vertices on 3D shapes
- sort and make patterns with 2D and 3D shapes
- describe movement and turns
- make tally charts
- draw and interpret pictograms
- understand and use block diagrams
Please note:
Our site is mainly based around the US Elementary school math standards.
Though the links on this page are all designed primarily for students in the US, but they are also at the correct level and standard for UK students.
The main issue is that some of the spelling is different and this site uses US spelling.
Year 2 is generally equivalent to 1st Grade in the US.
On this page you will find link to our range of math worksheets for Year 2.
Quicklinks to Year 2 ...
- Place Value Zone
Operations Zone
- Mental Math Zone
Word Problems Zone
- Measurement Zone
Geometry Zone
Data analysis zone.
- Fun Zone: games and puzzles
Coronavirus Stay At Home Support
For those parents who have found themselves unexpectedly at home with the kids and need some emergency activities for them to do, we have started to develop some Maths Grab Packs for kids in the UK.
Each pack consists of at least 10 mixed math worksheets on a variety of topics to help you keep you child occupied and learning.
The idea behind them is that they can be used out-of-the-box for some quick maths activities for your child.
They are completely FREE - take a look!
- Free Maths Grabs Packs
Place Value & Number Sense Zone
Year 2 Place Value Charts
Here you will find a range of Free Printable Place Value Charts for Year 2.
These printable charts will help your child learn to read and write numbers.
Some of the charts are partially filled to help your child learn their place value.
Using these sheets will help your child to:
- learn to count in tens and ones;
- learn to read and write numbers.
- Printable Number Charts 0-99
- Hundred Number Charts (100 Squares)
- Number Grid up to 200
Place Value and Counting Worksheets
Here you will find a range of Year 2 Place Value Worksheets.
These Year 2 maths worksheets will help your child learn their place value, reading, writing and ordering numbers up to 100.
There are also some money worksheets involving counting in dimes and pennies to support place value learning.
- learn to order numbers to 100;
- learn to count in dimes and pennies;
- learn to read and write numbers to 100.
Year 2 Place Value Worksheets
- Place Value to 20 Worksheets
- Math Place Value Worksheets Tens and Ones
- Ordering 2-digit numbers Worksheets
- Greater than Less than Worksheets - up to 2 digit numbers
- Printable Counting Worksheets to 50
- Missing Number Chart 1-100
- Counting by 2s Worksheets
- Math Worksheets Counting by 1s 5s and 10s
Number Line Worksheets
Here is our selection of free printable number line worksheets for Year 2 pupils.
These first grade math worksheets will give your child a good grasp of place value and number sequences up to 100.
- count on and back by ones;
- position numbers to 100 on a number line.
- Number lines to 20
- Number lines to 100
Year 2 Mental Maths Zone
Here you will find a range of printable mental math sheets designed especially for Year 2 children.
Each quiz tests the children on a range of math topics from number facts and mental arithmetic to geometry, solving word problems and measures questions.
A great way to revise topics, or use as a weekly math quiz!
- Year 2 Printable Mental Maths
Top of Page
Year 2 Addition Worksheets
Here you will find a range of Free Printable Addition Worksheets to support Year 2.
The following first grade math worksheets involve adding different amounts.
- learn their addition facts to 12+12;
- learn to solve an addition fact where one of the addends is missing;
- learn to add numbers in columns up to 100.
- Number Bonds to 10 and 12
- Addition Sentences to 12
- Addition Fact Practice to 12
- Addition Facts to 20 Worksheets
- Adding tens
- Addition Word Problems
- 2 Digit Addition Without Regrouping
- 2 Digit Addition Worksheets With Regrouping
- Free Addition Worksheets (randomly generated)
Year 2 Subtraction Worksheets
Here you will find a range of Year 2 Subtraction Worksheets.
The following worksheets involve using the Math skills of subtracting.
Using these Year 2 maths worksheets will help your child to:
- learn their addition and subtraction facts to 12;
- learn to subtract 2 digit numbers.
- Subtraction Facts to 12
- Subtracting tens
- Subtraction Word Problems
- Two Digit Subtraction Worksheets Without Regrouping
- 2 Digit Subtraction Worksheets With Regrouping
- Free Subtraction Worksheets (randomly generated)
Addition & Subtraction Worksheets
If you need to mix and match addition and subtraction fact questions within the same sheet, then use this section here.
The addition and subtraction worksheets involve counting on and back with numbers to 12.
- Math Activities Addition and Subtraction to 12
- Add and Subtract 10 Worksheets
- Addition Subtraction Worksheets (randomly generated)
- Addition and Subtraction Problems
Year 2 Maths Word Problems
Here you will find a range of math word problems aimed at Year 2 level. Each problem sheet is based on an interesting theme such as parties or the seaside.
- Add and subtract with numbers to 12;
- order numbers to 100;
- solve a range of math problems.
- Maths Problems for Year 2
Longer Math Problems
- Year 2 Maths Problems (1st Grade)
Year 2 Geometry Worksheets
Here is a range of free geometry worksheets for Year 2 pupils.
The following worksheets will help your child to:
- Identify and name a range of 2d and 3d shapes;
- Draw 2d shapes;
- Know some of the properties of 2d shapes.
- Year 2 Geometry Worksheets (1st Grade)
Measurement Zone, including Time & Money
Year 2 measurement worksheets.
Here is our selection of measurement worksheets for Year 2 pupils.
These sheets involve reading scales going up in ones to find the weight or liquid capacity.
Using these sheets will help children to consolidate their counting as well as learning to read a simple scale.
- Year 2 Measurement Worksheets (1st Grade)
Year 2 Money Worksheets
Here you will find a range of free printable First Grade Money Worksheets.
The following worksheets involve counting different amounts of money in pennies, nickels and dimes.
- learn the names and values of the US coins;
- learn to count up different amounts of money to £1 in coins.
- Free Counting Money Worksheets UK Coins (easier)
- Free Money Worksheets UK Coins up to £1
Printable Money Resources
- Printable Money Flashcards
- Kids Counting Money Dominoes
Telling the Time Worksheets
Here is our selection of telling the time worksheets for 1st grade.
- read o'clock and half-past times;
- convert o'clock and half-past times to digital;
- draw clock hands correctly to mark out o'clock and half-past.
The year 2 maths worksheets in this section will help your child learn to tell simple times on an analogue clock.
- Telling Time Worksheets o'clock and half-past
- Clock Worksheets - Quarter Past and Quarter To
Year 2 Bar Graph Worksheets
Here is our selection of bar graphs for first graders.
These Year 2 maths worksheets involve reading and interpreting a range of bar graphs and picture graphs with a scale going up in ones.
Using these sheets will help children to understand how bar graphs work.
- Year 2 Picture/Bar Graphs (First Grade)
Fun Zone: Puzzles, Games and Riddles
Year 2 Maths Games
Here you will find a range of free printable Math games. All children like to play Math games, and you will find a good range of Maths Games at a Year 2 level here for your child to play and enjoy.
- Year 2 Maths Games (First Grade)
Year 2 Maths Puzzles
Here you will find a range of printable Year 2 level math puzzles for your child to enjoy.
The puzzles will help your child practice and apply their addition and subtraction facts as well as developing their thinking and reasoning skills in a fun and engaging way.
Using these puzzles will help your child to:
- develop thinking and reasoning skills;
- develop perseverance.
- Year 2 Maths Puzzles (1st Grade)
- Dot to Dot up to 50
Math Salamanders Year 2 Maths Games Ebook
Our Year 2 Maths Games Ebook contains all of our fun maths games, complete with instructions and resources.
This ebooklet is available in our store - use the link below to find out more!
- Year 2 Maths Games Ebook
Other UK Maths Worksheet pages
See below for our other maths worksheets hub pages designed for children in the UK.
How to Print or Save these sheets 🖶
Need help with printing or saving? Follow these 3 steps to get your worksheets printed perfectly!
- How to Print support
Return to Math Salamanders UK Home Page
Return from Year 2 Maths Worksheets to Math Salamanders Home Page
Math-Salamanders.com
The Math Salamanders hope you enjoy using these free printable Math worksheets and all our other Math games and resources.
We welcome any comments about our site or worksheets on the Facebook comments box at the bottom of every page.
New! Comments
TOP OF PAGE
© 2010-2024 Math Salamanders Limited. All Rights Reserved.
- Privacy Policy
- Copyright Policy
Reasoning/Problem Solving
Year 2 Reasoning
Many schools are using some of the ideas of the ‘mastery programme’ as used in Singapore and other parts of the Far East. The aim of this programme is to give children a deep understanding and fluency in the fundamentals of maths. Because this understanding is deep it will not have to be re-taught at a later time; something which happens all too often at the moment.
This new approach needs new resources, especially geared towards reasoning and problem solving. Thankfully we have always considered reasoning to be a key part of the maths curriculum and many of our resources in all categories are designed for this. But we also have a separate category in each year group called, ‘Reasoning and Problem Solving’ where you will find a rich source of material. In Year 2 we have a large selection of ‘How many ways ….’ type of practical exercises (e.g. How many different ways can you score 12 with 3 dice?) These encourage children to think logically and order their results so that they can be sure that they have all possible answers. A favourite of mine is the ‘Two Coin Challenge’. Progressing from these practical tasks are the more abstract challenges such as making 2-digit numbers from a set of number cards.
Finally, take some time out to play the maths games such as Nim which originated in China. They are great at developing logical thinking and developing a winning strategy. You should never lose if you go first! These pages really are not to be missed and we thoroughly recommend them.
Money and shopping
Solving problems involving money and shopping.

What coins could you receive when given 10p change?

What totals can be made from just two coins?

I've got three coins. They are all different. What possible totals could I have?

Can I use just 7 coins to pay all amounts up to 20p?

Solving problems about shopping: quite tricky.

More solving problems about shopping: quite tricky.

Buy shapes which are priced according to the number of sides.
'How many ways' investigations
Challenges which ask how many possible ways there are to solve a problem.

Three boxes and 20 buttons. How many different ways can the buttons be put in the boxes so that each box has an even number?

19 buttons to sort into odd numbers.

How many presents could each of the three girls have got from a total of 20. They all got an even number of presents!

How many ways can the apples be put in the boxes so that there is an even number of apples in each box?

How many ways can the balloons be coloured? A logical thinking exercise.

How many different addition, subtraction and multiplication questions can be made with the cards shown?

How many different addition sentences can be made using the numbers shown?

Create a number plate for the gorillas new car: but you can only use the digits 1, 2 or 3!

How many different ways can various jars be filled with jam?

How many different ways can various buckets be filled with water?

How many different ways can various containers be filled with shampoo?

How many different ways can various containers be filled with bubble bath?

Investigating combinations of fruit.

Investigating combinations of packs of toy farm animals.

Investigating combinations of groups of children.

Find all the ways of jumping forward.

Three very athletic runners sharing a 19 mile relay. They each run an odd number of miles. How could they do this?

Mini investigations into how many different ways totals can be made from three numbers.

A mini investigation for superbrains. How many ways can you make 100, just using the numbers and signs shown?

Can you find 10 different ways of making 12 with 3 cards? (One card is zero, which makes it trickier!)
Number challenges
A variety of number problems and challenges

Making 2-digit numbers.

Using only the numbers 3 and 2 and the + and - signs, can all the numbers up to 20 be made?

A colourful set of number problems involving beads.

Colourful pages on solving number problems involving buttons.

Roll two dice and add the totals. Record and sort the results. What do you notice?

How many different ways can you score a total with two dice?

Using grids to reason about place value of numbers.

Use three dice to see how many different ways a score of 12 can be made.

Solve number problems with dice (1)

More number problems with dice.

Find as many ways as possible to complete the number sentence.

Make and order 2-digit numbers from a selection of number cards.

Number sentences with missing digits using addition, subtraction, multiplication and division.

Recognising that subtraction is the inverse of addition and the relationship between multiplication and division.

All the signs are missing. Find the correct signs to complete the number sentences.

Put the addition or subtraction signs in to make the number sentences correct. Hard, as there is more than one sign!

Problem solving: finding the right sign.

How many patterned tiles are there altogether?

Find how many tiles there are in the pattern.
Further challenges and investigations
More great investigations and challenges for children in Year 2.

Place the toys on the correct shelves.

Use the balance scales to work out which shelves the items go on.

These pages are all to do with sequencing.

Finding the lengths of pencils in a line.

Finding more than the given numbers.

Monsters and legs problems.

Writing addition statements as multiplication.

Put the numbers in the boxes so that the total of the row across adds up to the same as the total of the column down. Several ways to do this, leading to further investigations.

How long will it take to complete a page of addition, subtraction, multiplication and division questions?

Find a route through the maze from IN to OUT adding the numbers as you go.

Dominoes are a great resource for sorting. Try these ideas to begin with.

Roll two dice and add the totals. Record and sort results.

Sam's got a great aim but how many can he score with four beanbags?

What possible scores could I get with four darts?

Harder four dart totals.
Word problems
Use knowledge of maths to solve problems written in words.

Some tricky word problems to solve.

A great selection of one and two-step word problems.

More tricky one-step and two-step word problems.

Addition and subtraction related to the six digits shown.
A selection of mathematical games for one or more players.

An easy version of the game of Nim. Great for logical thinking and you can always win (if you know what you are doing!)

The very simplest forms of magic squares and some ideas on how to turn them into colour patterns.

How many counters can you place on the grid without getting 3 in a row?

Fill in the puzzle so that every row, column and diagonal contains the numbers 1 to 4.
Subscribe to our newsletter
The latest news, articles, and resources, sent to your inbox weekly.
© Copyright 2011 - 2024 Route One Network Ltd. - URBrainy.com 5.1
- For a new problem, you will need to begin a new live expert session.
- You can contact support with any questions regarding your current subscription.
- You will be able to enter math problems once our session is over.
- I am only able to help with one math problem per session. Which problem would you like to work on?
- Does that make sense?
- I am currently working on this problem.
- Are you still there?
- It appears we may have a connection issue. I will end the session - please reconnect if you still need assistance.
- Let me take a look...
- Can you please send an image of the problem you are seeing in your book or homework?
- If you click on "Tap to view steps..." you will see the steps are now numbered. Which step # do you have a question on?
- Please make sure you are in the correct subject. To change subjects, please exit out of this live expert session and select the appropriate subject from the menu located in the upper left corner of the Mathway screen.
- What are you trying to do with this input?
- While we cover a very wide range of problems, we are currently unable to assist with this specific problem. I spoke with my team and we will make note of this for future training. Is there a different problem you would like further assistance with?
- Mathway currently does not support this subject. We are more than happy to answer any math specific question you may have about this problem.
- Mathway currently does not support Ask an Expert Live in Chemistry. If this is what you were looking for, please contact support.
- Mathway currently only computes linear regressions.
- We are here to assist you with your math questions. You will need to get assistance from your school if you are having problems entering the answers into your online assignment.
- Have a great day!
- Hope that helps!
- You're welcome!
- Per our terms of use, Mathway's live experts will not knowingly provide solutions to students while they are taking a test or quiz.
Please ensure that your password is at least 8 characters and contains each of the following:
- a special character: @$#!%*?&
Home / Year 2 – Problem Solving (2) | Problem Solving
Year 2 – Problem Solving (2) | Problem Solving

A range of mix-topic challenge cards requiring children to use their problem solving and reasoning skills.
- Curriculum Links
Tried this resource? Add a photo Add a photo
What worked / did not work well? Have you spotted an error? Any other comments? Leave Feedback Leave Feedback
Related Products

Number of the day (within 100) | Activity

Number of the day (within 50) | Activity

Number of the day (within 20) | Activity

Subtraction grids (within 100) | Activity

Addition grids (within 100) | Activity

Subtraction grids (within 20) | Activity
Let us know..., login failed, ks1 upgrade....
If you wish to upgrade your subscription to Key Stage 1 please contact [email protected] or head over to our support page .
Please upgrade to a premium account to download this resource.
Please Log In
Please log in or sign up to access this feature.
Please log in or sign up to save this resource.
Invoice Request
This resource is not included in your Year 2 subscription.
Upgrade below to gain access to all premium resources
This resource is not included in your Year 1 subscription.
Upgrade below to gain access to all premium resources!
Teach yourself statistics
Statistics Problems
One of the best ways to learn statistics is to solve practice problems. These problems test your understanding of statistics terminology and your ability to solve common statistics problems. Each problem includes a step-by-step explanation of the solution.
- Use the dropdown boxes to describe the type of problem you want to work on.
- click the Submit button to see problems and solutions.
Main topic:
Problem description:
In one state, 52% of the voters are Republicans, and 48% are Democrats. In a second state, 47% of the voters are Republicans, and 53% are Democrats. Suppose a simple random sample of 100 voters are surveyed from each state.
What is the probability that the survey will show a greater percentage of Republican voters in the second state than in the first state?
The correct answer is C. For this analysis, let P 1 = the proportion of Republican voters in the first state, P 2 = the proportion of Republican voters in the second state, p 1 = the proportion of Republican voters in the sample from the first state, and p 2 = the proportion of Republican voters in the sample from the second state. The number of voters sampled from the first state (n 1 ) = 100, and the number of voters sampled from the second state (n 2 ) = 100.
The solution involves four steps.
- Make sure the sample size is big enough to model differences with a normal population. Because n 1 P 1 = 100 * 0.52 = 52, n 1 (1 - P 1 ) = 100 * 0.48 = 48, n 2 P 2 = 100 * 0.47 = 47, and n 2 (1 - P 2 ) = 100 * 0.53 = 53 are each greater than 10, the sample size is large enough.
- Find the mean of the difference in sample proportions: E(p 1 - p 2 ) = P 1 - P 2 = 0.52 - 0.47 = 0.05.
σ d = sqrt{ [ P1( 1 - P 1 ) / n 1 ] + [ P 2 (1 - P 2 ) / n 2 ] }
σ d = sqrt{ [ (0.52)(0.48) / 100 ] + [ (0.47)(0.53) / 100 ] }
σ d = sqrt (0.002496 + 0.002491) = sqrt(0.004987) = 0.0706
z p 1 - p 2 = (x - μ p 1 - p 2 ) / σ d = (0 - 0.05)/0.0706 = -0.7082
Using Stat Trek's Normal Distribution Calculator , we find that the probability of a z-score being -0.7082 or less is 0.24.
Therefore, the probability that the survey will show a greater percentage of Republican voters in the second state than in the first state is 0.24.
See also: Difference Between Proportions
open I am a
- Future Student
- Current Student
- Newly Admitted Student
- Parent/Guardian
- Faculty / Staff Member
open Colleges
- Arts and Letters
- Fowler College of Business
- Engineering
- Graduate Studies
- Health and Human Services
- SDSU Library
- Professional Studies and Fine Arts
- Weber Honors College
open Other Locations
- SDSU Georgia
- SDSU Global Campus
- SDSU Imperial Valley
- SDSU Mission Valley
- March Madness Bracketology: A statistician’s guide for beating 1-in-147 quintillion odds of the perfect bracket
Fowler College of Business lecturer Chris O’Byrne, a college sports fanatic and former options trader on Wall Street, breaks down some of the math behind bracketology, and offers some tips for winning your bracket pool.
- Share on Facebook
- Share on Twitter
- Share on LinkedIn
- Share via Email

College basketball fans watch their favorite teams all season with the hope that come March, their squad will earn a berth in the NCAA Tournament.
Fans without a qualifying team, and plenty of others who don’t even follow the sport, might still become consumed by March Madness because of bragging rights at stake. Every year the tournament brings friends, families and colleagues together to compete in bracket pools, or challenges to see who can pick the most winners in a slate of 67 games.
Most know that picking a perfect bracket is next to impossible. Companies have long offered millions in sweepstakes cash to anyone who can accomplish the feat, but few know the simple math equation that explains why it’s so difficult.
San Diego State University NewsCenter asked Fowler College of Business lecturer Chris O’Byrne , a college sports fanatic and former options trader on Wall Street, to walk through that equation. O’Byrne offered a few tips that might help you beat the odds, and took a look at a few factors that could help or hurt the Aztecs’ chances of playing in the title game in back-to-back seasons.
Why is it so hard to pick a perfect bracket? The chances of picking a perfect bracket is: 1 in 2 to the 67th power, or 1 in 147,573,952,589,676,412,928, or about 147 quintillion. This assumes that each participant has a 50/50 chance of winning. Since the tournament is seeded, this changes the odds a little bit in the bracket filler’s favor, but the fact remains that is how many different or unique brackets can be created from 68 teams.
How improbable was it to see 16th-ranked Fairleigh Dickinson beat no. 1 Purdue last March?
It was very improbable. In the first 139 match ups between the 1 and 16 seeds, the 1 seed won. So the 16 seed was 0-139. Granted, there have been some very close, nail-biting, almost upsets, but in the end, the 1 seed always prevailed. From a strictly probabilistic standpoint - 0.714% (1 out of 140) - and that may be too high – but strictly using a relative frequency probability model – less than 1%. I do believe there are fatter tails for the 16 seed to knock off the 1 seed than indicated above due to competition and parity between teams closing.
How can success or failure in the final leg of the season impact the Aztecs’ chances of competing for the National Championship for the second year in a row?
A successful final leg of the season, including in the Mountain West conference tournament, can provide the Aztecs with momentum and confidence heading into the NCAA Tournament and helps their case for a better seed in the NCAA Tournament. Higher seeds generally have more favorable matchups in the early rounds, increasing the Aztecs’ chances of advancing deeper into the tournament.
An impressive run up to Selection Sunday could lead to increased national recognition and attention from basketball analysts. This can boost the team’s confidence and potentially influence tournament selection committees, leading to more favorable matchups and considerations.
Conversely, failure down the stretch or even key injuries, can hurt the Aztecs’ confidence and momentum and translate to poor play in the NCAA Tournament. Losses in critical games could result in a lower seed, leading to tough early-round matchup and possibly an early exit from the tournament.
Do you have any tips for winning office bracket pools? Do you recommend picking the lowest seed to win each matchup? Why or why not?
Winning an office bracket pool often requires a balance of safe picks (higher seeds) and calculated risks (lower seeds and upsets). Don’t solely pick the favorites to win each matchup. While upsets are a big part of March Madness, they are still relatively rare, especially in the early rounds. A good strategy is to mix in some lower-seeded teams for upsets, but also pick higher-seeded teams that are strong contenders.
Higher seeds are higher for a reason. They often have better overall records, stronger schedules, and more talent. It’s generally a good idea to pick higher seeds to advance in the early rounds, but also be strategic about where you pick your upsets. One common first-round upset to consider is the 12th seed defeating the 5th seed. This happens more frequently than other upsets and can be a good place to take a risk. It’s often better to take calculated risks as the tournament progresses and the stakes get higher. While upsets are exciting, being too risky too early can lead to a busted bracket quickly.
Teams that performed well in their conference tournaments often carry that momentum into March Madness. Look at how teams performed in their conference tournaments as an indicator of their current form.
What are some of the other key factors?
It could also help to analyze teams beyond their seeding. Consider factors like team styles (fast-paced vs. slow-paced), strengths and weaknesses (strong defense or poor three-point shooting), and recent performances. Some matchups favor certain teams even if they are seeded lower.
Unfortunately, injuries can significantly impact a team’s performance, especially in the tournament. Keep an eye on injury reports leading up to the games and adjust your picks accordingly.
Ultimately, March Madness is unpredictable, and even the most well-researched bracket can be busted by unexpected outcomes. Trust your instincts but also use data, statistics, and analysis to inform your picks.
Lastly, have fun. Remember, part of the enjoyment of March Madness is the unpredictability. Even if your bracket doesn’t win, the excitement of the games and the camaraderie of participating in an office pool can make it a fun experience.

- Men’s Hoops: Aztecs face UAB in NCAA first round
The Aztecs are the 5-seed for the second time in program history after reaching the National Championship game last year on that seed line.
More From Sports
- Track and Field announces 45th Annual Aztec Invitational
- Steve Fisher: Reflections of a 'teacher-slash-coach'
Campus News

- Recap: 16th annual San Diego Festival of Science and Engineering
- SDSU Associated Students wins sustainability leadership award

- Exhibit 'Rising Up: Depictions of Social Protest in Comics' opens March 12
- GreenFest: Celebrating sustainability, diversity and SDSU pride

- SDSU Women’s Fund champions equity in athletics, academics
- SDSU announces $5 million Black Resource Center naming gift
- Home Learning
- Free Resources
- New Resources
- Free resources
- New resources
- Filter resources
- Childrens mental health
- Easter resources
Internet Explorer is out of date!
For greater security and performance, please consider updating to one of the following free browsers
Two Step Problems Lesson
This Year 2 Two-Step Problems lesson covers the prior learning of adding together and subtracting, before moving onto the main skill of solving two-step problems around money.
The lesson starts with a prior learning worksheet to check pupils’ understanding. The interactive lesson slides recap the prior learning before moving on to the main skill. Children can then practise further by completing the activities and can extend their learning by completing an engaging extension task.
National Curriculum Objectives Mathematics Year 2: (2M9) Solve simple problems in a practical context involving addition and subtraction of money of the same unit, including giving change
Get the most from lessons!
Resources for teachers
Interactive activities for children
2 Teaching Support
Subscription

Lesson Slides
These lesson slides guides pupils through the prior learning of adding together and subtracting, before moving onto the main skill of two step problems. There are a number of questions to check pupils' understanding throughout.

Modelling PowerPoint
This powerpoint can be used to model the questions that the children will complete on the Varied Fluency and Reasoning & Problem Solving worksheets as part of this lesson.

These are the same as the lesson slides on Classroom Secrets. You can assign this as an activity for pupils to access individually in school or remotely from home.

Video Tutorial
During this Two-Step Problems Video Tutorial, Katie shows children how to solve two-step problems involving money. Katie explores using subtraction to find change and using addition to find totals.
1 Prior Learning

Interactive Activity
This Year 2 Add 2-Digit Numbers 1 Game includes three questions to check pupils’ understanding of adding 2-digit numbers with no exchange.

This Year 2 Add 2 Digit Numbers Game checks pupils’ understanding of adding two 2-digit numbers, including an exchange.

This Year 2 Subtract with 2-Digits Game aims to support pupils’ subtraction skills using the column method, partitioning and number lines.
2 Varied Fluency

This differentiated worksheet includes varied fluency questions for pupils to practise the main skill of this lesson.

This Year 2 Money Problems Game aims to support pupils’ understanding of money.
2 Reasoning & Problem Solving

This differentiated worksheet includes reasoning and problem solving questions to support the teaching of this step.

Mixed Practice
This worksheet includes varied fluency, reasoning and problem solving questions for pupils to practise the main skill of find change.

This find change extension task includes a challenge activity which can be used to further pupils' understanding of the concepts taught in the find change lesson.

Discussion Problem
This worksheet includes two discussion problems which can be used in pairs or small groups to further pupils' understanding of the concepts taught in this lesson.

Interactive Challenge Activity
This Year 2 Money Problems Maths Challenge aims to extend pupils’ understanding of money.

This differentiated worksheet includes varied fluency and reasoning and problem solving questions to support the teaching of this step.
2 Additional Activities

Learning Video Clip
The summer holiday is nearly over and it’s time to get ready to go back to school. Yasin and Scarlett are going into town with their mums to get their new school uniform and school equipment. They will need to be able to work out how much they are spending and how much their change will be.

Consolidation Pack
This resource is aimed at Year 2 Expected and has been designed to give children the opportunity to consolidate the skills they have learned in Autumn Block 3 – Measurement: Money.

Home Learning Pack
This Autumn week 12 Maths pack contains varied fluency, reasoning and problem solving worksheets
D Download Packs
Stay in touch.
01422 419608
[email protected]
Interested in getting weekly updates from us? Then sign up to our newsletter here!

Information

- Cookie Policy
- Privacy Policy
- Terms and Conditions
Copyright: Classroom Secrets 2024
Company number: 8401067
VAT number: 248 8245 74
- Terms & Conditions
Designed by Classroom Secrets
- Share full article
Advertisement
Supported by
One Thing Most Countries Have in Common: Unsafe Air
New research found that fewer than 10 percent of countries and territories met World Health Organization guidelines for particulate matter pollution last year.

By Delger Erdenesanaa
Only 10 countries and territories out of 134 achieved the World Health Organization’s standards for a pervasive form of air pollution last year, according to air quality data compiled by IQAir , a Swiss company.
The pollution studied is called fine particulate matter, or PM2.5, because it refers to solid particles less than 2.5 micrometers in size: small enough to enter the bloodstream. PM2.5 is the deadliest form of air pollution, leading to millions of premature deaths each year .
“Air pollution and climate change both have the same culprit, which is fossil fuels,” said Glory Dolphin Hammes, the CEO of IQAir’s North American division.
The World Health Organization sets a guideline that people shouldn’t breathe more than 5 micrograms of fine particulate matter per cubic meter of air, on average, throughout a year. The U.S. Environmental Protection Agency recently proposed tightening its standard from 12 to 9 micrograms per cubic meter.
The few oases of clean air that meet World Health Organization guidelines are mostly islands, as well as Australia and the northern European countries of Finland and Estonia. Of the non-achievers, where the vast majority of the human population lives, the countries with the worst air quality were mostly in Asia and Africa.
Where some of the dirtiest air is found
The four most polluted countries in IQAir’s ranking for 2023 — Bangladesh, Pakistan, India and Tajikistan — are in South and Central Asia.
Air quality sensors in almost a third of the region’s cities reported concentrations of fine particulate matter that were more than 10 times the WHO guideline. This was a proportion “vastly exceeding any other region,” the report’s authors wrote.
The researchers pointed to vehicle traffic, coal and industrial emissions, particularly from brick kilns, as major sources of the region’s pollution. Farmers seasonally burning their crop waste contribute to the problem, as do households burning wood and dung for heat and cooking.
China reversed recent gains
One notable change in 2023 was a 6.3 percent increase in China’s air pollution compared with 2022, after at least five years of improvement. Beijing experienced a 14 percent increase in PM2.5 pollution last year.
The national government announced a “war against pollution” in 2014 and had been making progress ever since. But the sharpest decline in China’s PM2.5 pollution happened in 2020, when the coronavirus pandemic forced much of the country’s economic activity to slow or shut down. Ms. Dolphin Hammes attributed last year’s uptick to a reopening economy.
And challenges remain: Eleven cities in China reported air pollution levels last year that exceeded the WHO guidelines by 10 times or more. The worst was Hotan, Xinjiang.
Significant gaps in the data
IQAir researchers analyze data from more than 30,000 air quality monitoring stations and sensors across 134 countries, territories and disputed regions. Some of these monitoring stations are run by government agencies, while others are overseen by nonprofit organizations, schools, private companies and citizen scientists.
There are large gaps in ground-level air quality monitoring in Africa and the Middle East, including in regions where satellite data show some of the highest levels of air pollution on Earth.
As IQAir works to add data from more cities and countries in future years, “the worst might be yet to come in terms of what we’re measuring,” Ms. Dolphin Hammes said.
Wildfire smoke: a growing problem
Although North America is one of the cleaner regions in the world, in 2023 wildfires burned 4 percent of Canada’s forests, an area about half the size of Germany, and significantly impaired air quality.
Usually, North America’s list of most polluted cities is dominated by the United States. But last year, the top 13 spots all went to Canadian cities, many of them in Alberta.
In the United States, cities in the Upper Midwest and the Mid-Atlantic states also got significant amounts of PM2.5 pollution from wildfire smoke that drifted across the border.
Risks of short-term exposure
It’s not just chronic exposure to air pollution that harms people’s health.
For vulnerable people like the very young and old, or those with underlying illnesses, breathing in large amounts of fine particulate pollution for just a few hours or days can sometimes be deadly. About 1 million premature deaths per year can be attributed to short-term PM2.5 exposure, according to a recent global study published in The Lancet Planetary Health.
The problem is worst in East and South Asia, as well as in West Africa.
Without accounting for short-term exposures, “we might be underestimating the mortality burden from air pollution,” said Yuming Guo, a professor at Monash University in Melbourne, Australia, and one of the study’s authors.
U.S. disparities widen
Within individual countries, air pollution and its health effects aren’t evenly distributed.
Air quality in the United States has generally been improving since the Clean Air Act of the 1970s. Last decade, premature deaths from PM2.5 exposure declined to about 49,400 in 2019, down from about 69,000 in 2010.
But progress has happened faster in some communities than in others. Racial and ethnic disparities in air pollution deaths have grown in recent years, according to a national study published this month .
The census tracts in the United States with the fewest white residents have about 32 percent higher rates of PM2.5-related deaths, compared with those with the most white residents. This disparity in deaths per capita has increased by 16 percent between 2010 and 2019.
The study examined race and ethnicity separately, and found the disparity between the census tracts with the most and least Hispanic residents grew even more, by 40 percent.
In IQAir’s rankings, the United States is doing much better than most other countries. But studies that dig deeper show air quality is still an issue, said Gaige Kerr, a research scientist at George Washington University and the lead author of the disparities paper published in the journal Environmental Health Perspectives. “There’s still a lot of work to do,” he said.
Dr. Kerr’s research showed that mortality rates were highest on the Gulf Coast and in the Ohio River Valley, in areas dominated by petrochemical and manufacturing industries. He also noted that researchers have seen a slight uptick in rates of PM2.5-related deaths starting around 2016, particularly in the Western states, likely because of increasing wildfires.
Delger Erdenesanaa is a reporter covering climate and the environment and a member of the 2023-24 Times Fellowship class, a program for journalists early in their careers. More about Delger Erdenesanaa
Learn More About Climate Change
Have questions about climate change? Our F.A.Q. will tackle your climate questions, big and small .
To decarbonize the electrical grid, companies are finding creative ways to store energy during periods of low demand in carbon dioxide storage balloons .
MethaneSAT, a washing-machine-sized satellite , is designed to detect emissions of methane, an invisible yet potent gas that is dangerously heating the world. Here is how it works .
Two friends, both young climate researchers, recently spent hours confronting the choices that will shape their careers, and the world. Their ideas are very different .
New satellite-based research reveals how land along the East Coast is slumping into the ocean, compounding the danger from global sea level rise . A major culprit: overpumping of groundwater.
Did you know the ♻ symbol doesn’t mean something is actually recyclable ? Read on about how we got here, and what can be done.
VIDEO
COMMENTS
Take a look at the National Curriculum expectations for statistics in Year 2 (age 6-7): Draw pictograms, tally charts, block diagrams, and tables ... Problem solving: Handling data. Use the pictogram graph to answer these maths questions.Take a look. Maths activity books for age 6-7. Browse more maths activity books.
Differentiated maths resources for Spring Block 2 (Statistics) in small steps for KS1 children in Year 2. Each small step contains a range of resources including a teaching PowerPoint, varied fluency worksheets, reasoning and problem solving worksheets, homework or extension worksheets, discussion problems for collaborative learning, interactive games and a learning video clip.
KS1 Pictograms PowerPoint. 4.7 (36 reviews) Year 2 Statistics Maths Warm-Up PowerPoint. 4.9 (15 reviews) Year 2 Maths Statistics Home Learning Activity Booklet. 4.6 (5 reviews) Year 2 Maths Statistics DIY Data Homework Worksheet. 4.0 (1 review) Year 2 Statistics Display Posters Tally Chart.
Year 2 (Ages 6-7) Interpreting Data Video Lesson 1- Introducing Interpreting Data. When learning about statistics, children may face some new words that they haven't previously come across. A good recognition and understanding of these keywords will help your topic run smoothly. In the first video lesson in our Year 2 Statistics series, Helen ...
Reasoning and Problem Solving -Statistics -Year 2 1. Yellow is the most popular colour in Henrietta's class. Various responses; must explain why they think that. Example answer: blue would win as even though yellow was the most popular in Henrietta's class, blue was only 2 votes behind. In Jaylan's
Use this year 2 maths statistics lesson pack to teach children how to interpret and construct tables. This lesson introduces children to tables and teaches them to interpret them, starting with simple retrieval questions and building to comparing numbers, adding or finding the difference. It also includes our Diving into Mastery resources which provide reasoning and problem-solving activities ...
Year 2: Statistics. This list consists of visual resources, activities and games designed to support the new curriculum programme of study in Year Two. Containing tips on using the resources and suggestions for further use, it covers: Interpret and construct simple pictograms, tally charts, block diagrams and simple tables, ask and answer ...
Statistics and Mechanics 2 combined SolutionBank. Chapters. 1 Regression, correlation and hypothesis testing. 2 Conditional probability. 3 The normal distribution. Review exercise 1. 4 Moments. 5 Forces and friction. 6 Projectiles. 7 Applications of forces. 8 Further kinematics. Review exercise 2. Practice exam paper
Consider statistics as a problem-solving process and examine its four components: asking questions, collecting appropriate data, analyzing the data, and interpreting the results. This session investigates the nature of data and its potential sources of variation. Variables, bias, and random sampling are introduced. View Transcript.
Welcome to the statistics and probability page at Math-Drills.com where there is a 100% chance of learning something! This page includes Statistics worksheets including collecting and organizing data, measures of central tendency (mean, median, mode and range) and probability. Students spend their lives collecting, organizing, and analyzing ...
University of Leeds - BSc Mathematics. Maths/Physics Examiner Who Has Helped 6 GCSE/IB & 8 A Level Students Acheive A*'s In Last Year Alone. Final exams on the horizon? Kick-start your revision with our 4-day Pure and 1-day Statistics and Mechanics online Easter revision courses suitable for all exam boards. Check them out now!
Block 2 - Statistics. Week 5; Week 6; Block 3 - Geometry: Properties of Shape. Week 7; Week 8; Week 9; Block 4 - Number: Fractions. Week 10; Week 11; Week 12; ... Year: Problem Solving & 2 . Pages: 2 . Answers: Yes . A range of mix-topic challenge cards requiring children to use their problem solving and reasoning skills. Photos ;
By Nick Barwick - 7 Aug 2018. Hamilton provide an extensive suite of problem-solving maths investigations for Year 2 to facilitate mathematical confidence, investigative inquiry and the development of maths meta skills in 'low floor - high ceiling' activities for all. Explore all our in-depth problem solving investigations for Year 2.
Statistics and probability 16 units · 157 skills. Unit 1 Analyzing categorical data. Unit 2 Displaying and comparing quantitative data. Unit 3 Summarizing quantitative data. Unit 4 Modeling data distributions. Unit 5 Exploring bivariate numerical data. Unit 6 Study design. Unit 7 Probability.
Statistics Consolidation Year 2 Spring Block 2 Reasoning and Problem Solving worksheets (includes answers). National Curriculum Objectives. Mathematics Year 2: (2S1) Interpret and construct simple pictograms, tally charts, block diagrams and simple tables. Mathematics Year 2: (2S2a) Ask and answer simple questions by counting the number of ...
Here you will find a range of math word problems aimed at Year 2 level. Each problem sheet is based on an interesting theme such as parties or the seaside. Using these Year 2 maths worksheets will help your child to: Add and subtract with numbers to 12; order numbers to 100; solve a range of math problems.
The Statistics Worksheet Activity is just one option for supporting your child. There are plenty of other great learning materials to choose from. For example: A fundamental maths skill you can help your child with is being able to tell the time. The Telling Time PowerPoint demonstrates how to tell the time in clear steps.
Year 2 Reasoning. Many schools are using some of the ideas of the 'mastery programme' as used in Singapore and other parts of the Far East. The aim of this programme is to give children a deep understanding and fluency in the fundamentals of maths. Because this understanding is deep it will not have to be re-taught at a later time ...
Free math problem solver answers your statistics homework questions with step-by-step explanations. Mathway. Visit Mathway on the web. Start 7-day free trial on the app. Start 7-day free trial on the app. Download free on Amazon. Download free in Windows Store. get Go. Statistics. Basic Math. Pre-Algebra. Algebra. Trigonometry. Precalculus.
Block 2 - Statistics. Week 5; Week 6; Block 3 - Geometry: Properties of Shape. Week 7; Week 8; Week 9; Block 4 - Number: Fractions. Week 10; Week 11; Week 12; ... Year: Problem Solving & 2 . Pages: 2 . Answers: Yes . A range of mix-topic challenge cards requiring children to use their problem solving and reasoning skills. Photos ;
This problem requires us to find the probability that p1 is less than p 2. This is equivalent to finding the probability that p 1 - p 2 is less than zero. To find this probability, we need to transform the random variable (p 1 - p 2) into a z-score. That transformation appears below. z p 1 - p 2 = (x - μ p 1 - p 2) / σ d = (0 - 0.05)/0.0706 ...
When diving into the world of statistics, it's not uncommon to encounter hurdles in problem-solving. Statistics, a branch of mathematics, deals with data collection, analysis, interpretation, and ...
The child decides which operation (adding, subtracting, multiplying or dividing) they need to use and then work out the answer. This Year 2 Problem Solving and Games Guide is full of great problem-solving activity ideas for their ks1 children and help children prepare for year 2 SATS!
March Madness Bracketology: A statistician's guide for beating 1-in-147 quintillion odds of the perfect bracket. Fowler College of Business lecturer Chris O'Byrne, a college sports fanatic and former options trader on Wall Street, breaks down some of the math behind bracketology, and offers some tips for winning your bracket pool.
This Year 2 Two-Step Problems lesson covers the prior learning of adding together and subtracting, before moving onto the main skill of solving two-step problems around money. The lesson starts with a prior learning worksheet to check pupils' understanding. The interactive lesson slides recap the prior learning before moving on to the main skill.
The national government announced a "war against pollution" in 2014 and had been making progress ever since. But the sharpest decline in China's PM2.5 pollution happened in 2020, when the ...