Descriptive Research Design – Overview
Published 16 October, 2023
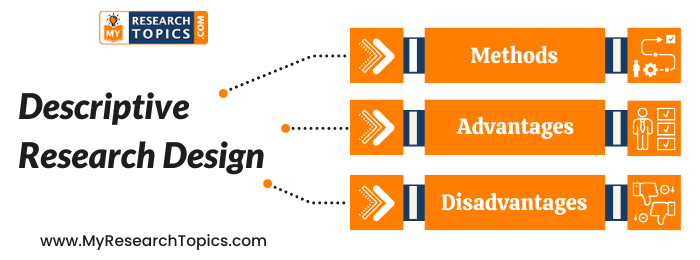
Descriptive research is an observational method that focuses on identifying patterns in data without making inferences about cause and effect relationships between variables. The purpose of this blog post is to provide a brief description of descriptive research design including its advantages and disadvantages and methods of conducting descriptive research.

What is Descriptive Research?
Descriptive research is a process of systematically describing and analyzing something’s features, properties or characteristics. Descriptive research provides numerical descriptions that identify what the thing being studied looks like in terms of its size, location, and frequency.
This type of research will help you in defining the characteristics of the population on which you have performed the study. A descriptive research design enables you to develop an in-depth understanding of the topic or subjects. In such a type of investigation, you can’t have control over variables.
By performing descriptive research, you will be able to study participants in a natural setting. Descriptive research basically includes describing the behavior of people to whom you have select as a participant in the research process .
In addition to this , descriptive research also allows you to describe the other various aspects of your investigation. An important feature is that you can employ different types of variables but you only need a single variable for performing the descriptive investigation. It is a type of study which includes observation as a technique for gathering facts about the study. You can perform descriptive research for analyzing the relationship between two different variables.
For example, A company whose sale of specific products such as home decor products is going down. Management, in order to analyze the reason for the same, needs to conduct descriptive research. Survey Research is the data collection technique that a research team in an organization can use for collecting the view of people about the decline in the sale of home décor products.
When to Use Descriptive Research Design
Descriptive research is suitable when the aim of the study is to identify characteristics, frequencies, trends, categories, and the behavior of people.
In addition to this, the descriptive research design is appropriate to use when you don’t have much knowledge about the research topics or problems.
This type of study can be used before you start researching why something happens so that we have an idea on how it occurs, where are most likely places this will happen at and who might experience these things more often than others.
Advantages of Descriptive Research
- One of the biggest advantages of descriptive research is that it allows you to analyze facts and helps you in developing an in-depth understanding of the research problem .
- Another benefit of descriptive research is that it enables you to determine the behavior of people in a natural setting.
- In such a type of investigation, you can utilize both qualitative and quantitative research methods for gathering facts.
- Descriptive research is cost-effective and quick. It can also be used for many different purposes, which makes it a very versatile method of gathering data.
- You need less time for performing such types of research .
- With descriptive research, you can get rich data that’s great for future studies. Use it to develop hypotheses or your research objective too!
Disadvantages of Descriptive Research
- The biggest disadvantage of descriptive research is that you cannot use statistical tools or techniques for verifying problems.
- Respondents can be affected by the presence of an observer and may engage in pretending. This is called the “observer effect.” In some cases, respondents are less likely to give accurate responses if they feel that a question will assess intimate matters.
- There are high chances of biases in the research findings .
- Due to the observational nature, it is quite difficult to repeat the research process .
- By performing descriptive research you can find the root cause of the problem.
Methods of Descriptive Research Design
You can utilize both Qualitative and Quantitative methods for performing descriptive research. It is very much essential for you to make the choice of a suitable research design for investigation as the reliability and validity of the research outcomes are completely based on it. There are three different methods that you can use in descriptive research are:
It is the method that includes a detailed description of the subject or topic. The survey is the method by utilizing which you can collect a huge volume of facts about the topic or subject.
You can use a survey technique for directly accumulating information about the perception of people about the topic. The methods which can be applied for performing a survey in descriptive research are questionnaires, telephonic and personal interviews . In descriptive studies, generally, open-ended questions are included in a questionnaire.
2. Observation
It is basically a technique that the researcher utilities for observing and recording participants. By utilizing this technique you can easily view the subject in a natural setting.
Observations are a way of gathering data that can be used to understand how people act in real-life situations. These observations give researchers the opportunity to see behaviors and phenomena without having them rely on honesty or accuracy from respondents, which is often useful for psychologists, social scientists, and market research companies. Furthermore, observations play an important role in understanding things such as physical entities before developing models hypotheses, or theories – because they provide systematic descriptions of what’s being investigated
For example, an investigation is performed for gathering information about the buying decision-making procedure by customers. The investigator for collecting the facts about the topic has observed people in shopping malls while they are making the purchase of specific products or services. By using the observation technique you can ensure the accuracy and honesty in the information provided by respondents.
3. Case study
You can use the case study methods in research for gathering an in-depth understanding of specific phenomena. It is the method that would enable you to study the situation which takes place rarely
Case studies are a great way to provide detailed information about an individual (such as yourself), group, event, or organization. Instead of gathering data across time and space in order to identify patterns, case studies gather extensive detailed data to identify the characteristics of a narrowly defined subject.
Stuck During Your Dissertation
Our top dissertation writing experts are waiting 24/7 to assist you with your university project,from critical literature reviews to a complete PhD dissertation.

Other Related Guides
- Research Project Questions
- Types of Validity in Research – Explained With Examples
- Schizophrenia Sample Research Paper
- Quantitative Research Methods – Definitive Guide
- Research Paper On Homelessness For College Students
- How to Study for Biology Final Examination
- Textual Analysis in Research / Methods of Analyzing Text
A Guide to Start Research Process – Introduction, Procedure and Tips
Research findings – objectives , importance and techniques.
- Topic Sentences in Research Paper – Meaning, Parts, Importance, Procedure and Techniques

Recent Research Guides for 2023

Get 15% off your first order with My Research Topics
Connect with a professional writer within minutes by placing your first order. No matter the subject, difficulty, academic level or document type, our writers have the skills to complete it.

My Research Topics is provides assistance since 2004 to Research Students Globally. We help PhD, Psyd, MD, Mphil, Undergrad, High school, College, Masters students to compete their research paper & Dissertations. Our Step by step mentorship helps students to understand the research paper making process.
Research Topics & Ideas
- Sociological Research Paper Topics & Ideas For Students 2023
- Nurses Research Paper Topics & Ideas 2023
- Nursing Capstone Project Research Topics & Ideas 2023
- Unique Research Paper Topics & Ideas For Students 2023
- Teaching Research Paper Topics & Ideas 2023
- Literary Research Paper Topics & Ideas 2023
- Nursing Ethics Research Topics & Ideas 2023
Research Guide
Disclaimer: The Reference papers provided by the Myresearchtopics.com serve as model and sample papers for students and are not to be submitted as it is. These papers are intended to be used for reference and research purposes only.
- Privacy Policy
Home » Descriptive Research Design – Types, Methods and Examples
Descriptive Research Design – Types, Methods and Examples
Table of Contents

Descriptive Research Design
Definition:
Descriptive research design is a type of research methodology that aims to describe or document the characteristics, behaviors, attitudes, opinions, or perceptions of a group or population being studied.
Descriptive research design does not attempt to establish cause-and-effect relationships between variables or make predictions about future outcomes. Instead, it focuses on providing a detailed and accurate representation of the data collected, which can be useful for generating hypotheses, exploring trends, and identifying patterns in the data.
Types of Descriptive Research Design
Types of Descriptive Research Design are as follows:
Cross-sectional Study
This involves collecting data at a single point in time from a sample or population to describe their characteristics or behaviors. For example, a researcher may conduct a cross-sectional study to investigate the prevalence of certain health conditions among a population, or to describe the attitudes and beliefs of a particular group.
Longitudinal Study
This involves collecting data over an extended period of time, often through repeated observations or surveys of the same group or population. Longitudinal studies can be used to track changes in attitudes, behaviors, or outcomes over time, or to investigate the effects of interventions or treatments.
This involves an in-depth examination of a single individual, group, or situation to gain a detailed understanding of its characteristics or dynamics. Case studies are often used in psychology, sociology, and business to explore complex phenomena or to generate hypotheses for further research.
Survey Research
This involves collecting data from a sample or population through standardized questionnaires or interviews. Surveys can be used to describe attitudes, opinions, behaviors, or demographic characteristics of a group, and can be conducted in person, by phone, or online.
Observational Research
This involves observing and documenting the behavior or interactions of individuals or groups in a natural or controlled setting. Observational studies can be used to describe social, cultural, or environmental phenomena, or to investigate the effects of interventions or treatments.
Correlational Research
This involves examining the relationships between two or more variables to describe their patterns or associations. Correlational studies can be used to identify potential causal relationships or to explore the strength and direction of relationships between variables.
Data Analysis Methods
Descriptive research design data analysis methods depend on the type of data collected and the research question being addressed. Here are some common methods of data analysis for descriptive research:
Descriptive Statistics
This method involves analyzing data to summarize and describe the key features of a sample or population. Descriptive statistics can include measures of central tendency (e.g., mean, median, mode) and measures of variability (e.g., range, standard deviation).
Cross-tabulation
This method involves analyzing data by creating a table that shows the frequency of two or more variables together. Cross-tabulation can help identify patterns or relationships between variables.
Content Analysis
This method involves analyzing qualitative data (e.g., text, images, audio) to identify themes, patterns, or trends. Content analysis can be used to describe the characteristics of a sample or population, or to identify factors that influence attitudes or behaviors.
Qualitative Coding
This method involves analyzing qualitative data by assigning codes to segments of data based on their meaning or content. Qualitative coding can be used to identify common themes, patterns, or categories within the data.
Visualization
This method involves creating graphs or charts to represent data visually. Visualization can help identify patterns or relationships between variables and make it easier to communicate findings to others.
Comparative Analysis
This method involves comparing data across different groups or time periods to identify similarities and differences. Comparative analysis can help describe changes in attitudes or behaviors over time or differences between subgroups within a population.
Applications of Descriptive Research Design
Descriptive research design has numerous applications in various fields. Some of the common applications of descriptive research design are:
- Market research: Descriptive research design is widely used in market research to understand consumer preferences, behavior, and attitudes. This helps companies to develop new products and services, improve marketing strategies, and increase customer satisfaction.
- Health research: Descriptive research design is used in health research to describe the prevalence and distribution of a disease or health condition in a population. This helps healthcare providers to develop prevention and treatment strategies.
- Educational research: Descriptive research design is used in educational research to describe the performance of students, schools, or educational programs. This helps educators to improve teaching methods and develop effective educational programs.
- Social science research: Descriptive research design is used in social science research to describe social phenomena such as cultural norms, values, and beliefs. This helps researchers to understand social behavior and develop effective policies.
- Public opinion research: Descriptive research design is used in public opinion research to understand the opinions and attitudes of the general public on various issues. This helps policymakers to develop effective policies that are aligned with public opinion.
- Environmental research: Descriptive research design is used in environmental research to describe the environmental conditions of a particular region or ecosystem. This helps policymakers and environmentalists to develop effective conservation and preservation strategies.
Descriptive Research Design Examples
Here are some real-time examples of descriptive research designs:
- A restaurant chain wants to understand the demographics and attitudes of its customers. They conduct a survey asking customers about their age, gender, income, frequency of visits, favorite menu items, and overall satisfaction. The survey data is analyzed using descriptive statistics and cross-tabulation to describe the characteristics of their customer base.
- A medical researcher wants to describe the prevalence and risk factors of a particular disease in a population. They conduct a cross-sectional study in which they collect data from a sample of individuals using a standardized questionnaire. The data is analyzed using descriptive statistics and cross-tabulation to identify patterns in the prevalence and risk factors of the disease.
- An education researcher wants to describe the learning outcomes of students in a particular school district. They collect test scores from a representative sample of students in the district and use descriptive statistics to calculate the mean, median, and standard deviation of the scores. They also create visualizations such as histograms and box plots to show the distribution of scores.
- A marketing team wants to understand the attitudes and behaviors of consumers towards a new product. They conduct a series of focus groups and use qualitative coding to identify common themes and patterns in the data. They also create visualizations such as word clouds to show the most frequently mentioned topics.
- An environmental scientist wants to describe the biodiversity of a particular ecosystem. They conduct an observational study in which they collect data on the species and abundance of plants and animals in the ecosystem. The data is analyzed using descriptive statistics to describe the diversity and richness of the ecosystem.
How to Conduct Descriptive Research Design
To conduct a descriptive research design, you can follow these general steps:
- Define your research question: Clearly define the research question or problem that you want to address. Your research question should be specific and focused to guide your data collection and analysis.
- Choose your research method: Select the most appropriate research method for your research question. As discussed earlier, common research methods for descriptive research include surveys, case studies, observational studies, cross-sectional studies, and longitudinal studies.
- Design your study: Plan the details of your study, including the sampling strategy, data collection methods, and data analysis plan. Determine the sample size and sampling method, decide on the data collection tools (such as questionnaires, interviews, or observations), and outline your data analysis plan.
- Collect data: Collect data from your sample or population using the data collection tools you have chosen. Ensure that you follow ethical guidelines for research and obtain informed consent from participants.
- Analyze data: Use appropriate statistical or qualitative analysis methods to analyze your data. As discussed earlier, common data analysis methods for descriptive research include descriptive statistics, cross-tabulation, content analysis, qualitative coding, visualization, and comparative analysis.
- I nterpret results: Interpret your findings in light of your research question and objectives. Identify patterns, trends, and relationships in the data, and describe the characteristics of your sample or population.
- Draw conclusions and report results: Draw conclusions based on your analysis and interpretation of the data. Report your results in a clear and concise manner, using appropriate tables, graphs, or figures to present your findings. Ensure that your report follows accepted research standards and guidelines.
When to Use Descriptive Research Design
Descriptive research design is used in situations where the researcher wants to describe a population or phenomenon in detail. It is used to gather information about the current status or condition of a group or phenomenon without making any causal inferences. Descriptive research design is useful in the following situations:
- Exploratory research: Descriptive research design is often used in exploratory research to gain an initial understanding of a phenomenon or population.
- Identifying trends: Descriptive research design can be used to identify trends or patterns in a population, such as changes in consumer behavior or attitudes over time.
- Market research: Descriptive research design is commonly used in market research to understand consumer preferences, behavior, and attitudes.
- Health research: Descriptive research design is useful in health research to describe the prevalence and distribution of a disease or health condition in a population.
- Social science research: Descriptive research design is used in social science research to describe social phenomena such as cultural norms, values, and beliefs.
- Educational research: Descriptive research design is used in educational research to describe the performance of students, schools, or educational programs.
Purpose of Descriptive Research Design
The main purpose of descriptive research design is to describe and measure the characteristics of a population or phenomenon in a systematic and objective manner. It involves collecting data that describe the current status or condition of the population or phenomenon of interest, without manipulating or altering any variables.
The purpose of descriptive research design can be summarized as follows:
- To provide an accurate description of a population or phenomenon: Descriptive research design aims to provide a comprehensive and accurate description of a population or phenomenon of interest. This can help researchers to develop a better understanding of the characteristics of the population or phenomenon.
- To identify trends and patterns: Descriptive research design can help researchers to identify trends and patterns in the data, such as changes in behavior or attitudes over time. This can be useful for making predictions and developing strategies.
- To generate hypotheses: Descriptive research design can be used to generate hypotheses or research questions that can be tested in future studies. For example, if a descriptive study finds a correlation between two variables, this could lead to the development of a hypothesis about the causal relationship between the variables.
- To establish a baseline: Descriptive research design can establish a baseline or starting point for future research. This can be useful for comparing data from different time periods or populations.
Characteristics of Descriptive Research Design
Descriptive research design has several key characteristics that distinguish it from other research designs. Some of the main characteristics of descriptive research design are:
- Objective : Descriptive research design is objective in nature, which means that it focuses on collecting factual and accurate data without any personal bias. The researcher aims to report the data objectively without any personal interpretation.
- Non-experimental: Descriptive research design is non-experimental, which means that the researcher does not manipulate any variables. The researcher simply observes and records the behavior or characteristics of the population or phenomenon of interest.
- Quantitative : Descriptive research design is quantitative in nature, which means that it involves collecting numerical data that can be analyzed using statistical techniques. This helps to provide a more precise and accurate description of the population or phenomenon.
- Cross-sectional: Descriptive research design is often cross-sectional, which means that the data is collected at a single point in time. This can be useful for understanding the current state of the population or phenomenon, but it may not provide information about changes over time.
- Large sample size: Descriptive research design typically involves a large sample size, which helps to ensure that the data is representative of the population of interest. A large sample size also helps to increase the reliability and validity of the data.
- Systematic and structured: Descriptive research design involves a systematic and structured approach to data collection, which helps to ensure that the data is accurate and reliable. This involves using standardized procedures for data collection, such as surveys, questionnaires, or observation checklists.
Advantages of Descriptive Research Design
Descriptive research design has several advantages that make it a popular choice for researchers. Some of the main advantages of descriptive research design are:
- Provides an accurate description: Descriptive research design is focused on accurately describing the characteristics of a population or phenomenon. This can help researchers to develop a better understanding of the subject of interest.
- Easy to conduct: Descriptive research design is relatively easy to conduct and requires minimal resources compared to other research designs. It can be conducted quickly and efficiently, and data can be collected through surveys, questionnaires, or observations.
- Useful for generating hypotheses: Descriptive research design can be used to generate hypotheses or research questions that can be tested in future studies. For example, if a descriptive study finds a correlation between two variables, this could lead to the development of a hypothesis about the causal relationship between the variables.
- Large sample size : Descriptive research design typically involves a large sample size, which helps to ensure that the data is representative of the population of interest. A large sample size also helps to increase the reliability and validity of the data.
- Can be used to monitor changes : Descriptive research design can be used to monitor changes over time in a population or phenomenon. This can be useful for identifying trends and patterns, and for making predictions about future behavior or attitudes.
- Can be used in a variety of fields : Descriptive research design can be used in a variety of fields, including social sciences, healthcare, business, and education.
Limitation of Descriptive Research Design
Descriptive research design also has some limitations that researchers should consider before using this design. Some of the main limitations of descriptive research design are:
- Cannot establish cause and effect: Descriptive research design cannot establish cause and effect relationships between variables. It only provides a description of the characteristics of the population or phenomenon of interest.
- Limited generalizability: The results of a descriptive study may not be generalizable to other populations or situations. This is because descriptive research design often involves a specific sample or situation, which may not be representative of the broader population.
- Potential for bias: Descriptive research design can be subject to bias, particularly if the researcher is not objective in their data collection or interpretation. This can lead to inaccurate or incomplete descriptions of the population or phenomenon of interest.
- Limited depth: Descriptive research design may provide a superficial description of the population or phenomenon of interest. It does not delve into the underlying causes or mechanisms behind the observed behavior or characteristics.
- Limited utility for theory development: Descriptive research design may not be useful for developing theories about the relationship between variables. It only provides a description of the variables themselves.
- Relies on self-report data: Descriptive research design often relies on self-report data, such as surveys or questionnaires. This type of data may be subject to biases, such as social desirability bias or recall bias.
About the author

Muhammad Hassan
Researcher, Academic Writer, Web developer
You may also like

Focus Groups – Steps, Examples and Guide

Qualitative Research Methods

Experimental Design – Types, Methods, Guide

Questionnaire – Definition, Types, and Examples

Explanatory Research – Types, Methods, Guide

Case Study – Methods, Examples and Guide

Bridging the Gap: Overcome these 7 flaws in descriptive research design
Descriptive research design is a powerful tool used by scientists and researchers to gather information about a particular group or phenomenon. This type of research provides a detailed and accurate picture of the characteristics and behaviors of a particular population or subject. By observing and collecting data on a given topic, descriptive research helps researchers gain a deeper understanding of a specific issue and provides valuable insights that can inform future studies.
In this blog, we will explore the definition, characteristics, and common flaws in descriptive research design, and provide tips on how to avoid these pitfalls to produce high-quality results. Whether you are a seasoned researcher or a student just starting, understanding the fundamentals of descriptive research design is essential to conducting successful scientific studies.
Table of Contents
What Is Descriptive Research Design?
The descriptive research design involves observing and collecting data on a given topic without attempting to infer cause-and-effect relationships. The goal of descriptive research is to provide a comprehensive and accurate picture of the population or phenomenon being studied and to describe the relationships, patterns, and trends that exist within the data.
Descriptive research methods can include surveys, observational studies , and case studies, and the data collected can be qualitative or quantitative . The findings from descriptive research provide valuable insights and inform future research, but do not establish cause-and-effect relationships.
Importance of Descriptive Research in Scientific Studies
1. understanding of a population or phenomenon.
Descriptive research provides a comprehensive picture of the characteristics and behaviors of a particular population or phenomenon, allowing researchers to gain a deeper understanding of the topic.
2. Baseline Information
The information gathered through descriptive research can serve as a baseline for future research and provide a foundation for further studies.
3. Informative Data
Descriptive research can provide valuable information and insights into a particular topic, which can inform future research, policy decisions, and programs.
4. Sampling Validation
Descriptive research can be used to validate sampling methods and to help researchers determine the best approach for their study.
5. Cost Effective
Descriptive research is often less expensive and less time-consuming than other research methods , making it a cost-effective way to gather information about a particular population or phenomenon.
6. Easy to Replicate
Descriptive research is straightforward to replicate, making it a reliable way to gather and compare information from multiple sources.
Key Characteristics of Descriptive Research Design
The primary purpose of descriptive research is to describe the characteristics, behaviors, and attributes of a particular population or phenomenon.
2. Participants and Sampling
Descriptive research studies a particular population or sample that is representative of the larger population being studied. Furthermore, sampling methods can include convenience, stratified, or random sampling.
3. Data Collection Techniques
Descriptive research typically involves the collection of both qualitative and quantitative data through methods such as surveys, observational studies, case studies, or focus groups.
4. Data Analysis
Descriptive research data is analyzed to identify patterns, relationships, and trends within the data. Statistical techniques , such as frequency distributions and descriptive statistics, are commonly used to summarize and describe the data.
5. Focus on Description
Descriptive research is focused on describing and summarizing the characteristics of a particular population or phenomenon. It does not make causal inferences.
6. Non-Experimental
Descriptive research is non-experimental, meaning that the researcher does not manipulate variables or control conditions. The researcher simply observes and collects data on the population or phenomenon being studied.
When Can a Researcher Conduct Descriptive Research?
A researcher can conduct descriptive research in the following situations:
- To better understand a particular population or phenomenon
- To describe the relationships between variables
- To describe patterns and trends
- To validate sampling methods and determine the best approach for a study
- To compare data from multiple sources.
Types of Descriptive Research Design
1. survey research.
Surveys are a type of descriptive research that involves collecting data through self-administered or interviewer-administered questionnaires. Additionally, they can be administered in-person, by mail, or online, and can collect both qualitative and quantitative data.
2. Observational Research
Observational research involves observing and collecting data on a particular population or phenomenon without manipulating variables or controlling conditions. It can be conducted in naturalistic settings or controlled laboratory settings.
3. Case Study Research
Case study research is a type of descriptive research that focuses on a single individual, group, or event. It involves collecting detailed information on the subject through a variety of methods, including interviews, observations, and examination of documents.
4. Focus Group Research
Focus group research involves bringing together a small group of people to discuss a particular topic or product. Furthermore, the group is usually moderated by a researcher and the discussion is recorded for later analysis.
5. Ethnographic Research
Ethnographic research involves conducting detailed observations of a particular culture or community. It is often used to gain a deep understanding of the beliefs, behaviors, and practices of a particular group.
Advantages of Descriptive Research Design
1. provides a comprehensive understanding.
Descriptive research provides a comprehensive picture of the characteristics, behaviors, and attributes of a particular population or phenomenon, which can be useful in informing future research and policy decisions.
2. Non-invasive
Descriptive research is non-invasive and does not manipulate variables or control conditions, making it a suitable method for sensitive or ethical concerns.
3. Flexibility
Descriptive research allows for a wide range of data collection methods , including surveys, observational studies, case studies, and focus groups, making it a flexible and versatile research method.
4. Cost-effective
Descriptive research is often less expensive and less time-consuming than other research methods. Moreover, it gives a cost-effective option to many researchers.
5. Easy to Replicate
Descriptive research is easy to replicate, making it a reliable way to gather and compare information from multiple sources.
6. Informs Future Research
The insights gained from a descriptive research can inform future research and inform policy decisions and programs.
Disadvantages of Descriptive Research Design
1. limited scope.
Descriptive research only provides a snapshot of the current situation and cannot establish cause-and-effect relationships.
2. Dependence on Existing Data
Descriptive research relies on existing data, which may not always be comprehensive or accurate.
3. Lack of Control
Researchers have no control over the variables in descriptive research, which can limit the conclusions that can be drawn.
The researcher’s own biases and preconceptions can influence the interpretation of the data.
5. Lack of Generalizability
Descriptive research findings may not be applicable to other populations or situations.
6. Lack of Depth
Descriptive research provides a surface-level understanding of a phenomenon, rather than a deep understanding.
7. Time-consuming
Descriptive research often requires a large amount of data collection and analysis, which can be time-consuming and resource-intensive.
7 Ways to Avoid Common Flaws While Designing Descriptive Research
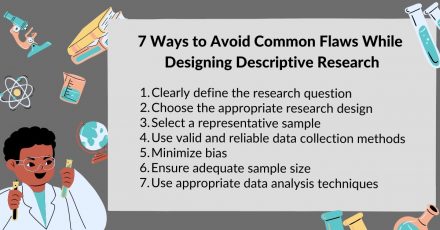
1. Clearly define the research question
A clearly defined research question is the foundation of any research study, and it is important to ensure that the question is both specific and relevant to the topic being studied.
2. Choose the appropriate research design
Choosing the appropriate research design for a study is crucial to the success of the study. Moreover, researchers should choose a design that best fits the research question and the type of data needed to answer it.
3. Select a representative sample
Selecting a representative sample is important to ensure that the findings of the study are generalizable to the population being studied. Researchers should use a sampling method that provides a random and representative sample of the population.
4. Use valid and reliable data collection methods
Using valid and reliable data collection methods is important to ensure that the data collected is accurate and can be used to answer the research question. Researchers should choose methods that are appropriate for the study and that can be administered consistently and systematically.
5. Minimize bias
Bias can significantly impact the validity and reliability of research findings. Furthermore, it is important to minimize bias in all aspects of the study, from the selection of participants to the analysis of data.
6. Ensure adequate sample size
An adequate sample size is important to ensure that the results of the study are statistically significant and can be generalized to the population being studied.
7. Use appropriate data analysis techniques
The appropriate data analysis technique depends on the type of data collected and the research question being asked. Researchers should choose techniques that are appropriate for the data and the question being asked.
Have you worked on descriptive research designs? How was your experience creating a descriptive design? What challenges did you face? Do write to us or leave a comment below and share your insights on descriptive research designs!

extremely very educative
Indeed very educative and useful. Well explained. Thank you
Simple,easy to understand
Excellent and easy to understand queries and questions get answered easily. Its rather clear than any confusion. Thanks a million Shritika Sirisilla.
Rate this article Cancel Reply
Your email address will not be published.

Enago Academy's Most Popular Articles
![What is Academic Integrity and How to Uphold it [FREE CHECKLIST]](https://www.enago.com/academy/wp-content/uploads/2024/05/FeatureImages-59-210x136.png "advantages and disadvantages of descriptive research design")
Ensuring Academic Integrity and Transparency in Academic Research: A comprehensive checklist for researchers
Academic integrity is the foundation upon which the credibility and value of scientific findings are…

- Publishing Research
- Reporting Research
How to Optimize Your Research Process: A step-by-step guide
For researchers across disciplines, the path to uncovering novel findings and insights is often filled…

- Industry News
- Trending Now
Breaking Barriers: Sony and Nature unveil “Women in Technology Award”
Sony Group Corporation and the prestigious scientific journal Nature have collaborated to launch the inaugural…

Achieving Research Excellence: Checklist for good research practices
Academia is built on the foundation of trustworthy and high-quality research, supported by the pillars…

- Promoting Research
Plain Language Summary — Communicating your research to bridge the academic-lay gap
Science can be complex, but does that mean it should not be accessible to the…
Choosing the Right Analytical Approach: Thematic analysis vs. content analysis for…
Comparing Cross Sectional and Longitudinal Studies: 5 steps for choosing the right…
Research Recommendations – Guiding policy-makers for evidence-based decision making

Sign-up to read more
Subscribe for free to get unrestricted access to all our resources on research writing and academic publishing including:
- 2000+ blog articles
- 50+ Webinars
- 10+ Expert podcasts
- 50+ Infographics
- 10+ Checklists
- Research Guides
We hate spam too. We promise to protect your privacy and never spam you.
I am looking for Editing/ Proofreading services for my manuscript Tentative date of next journal submission:

What would be most effective in reducing research misconduct?
Advantages and disadvantages of descriptive research

Descriptive research
Descriptive research is a type of research that is responsible for describing the population situation or phenomenon around which his study focuses. It seeks to provide information about the what, how, when, and where of the research problem, without giving priority to answering the “why” of the problem. As its name says, this way of investigating “describes”, it does not explain. Advantages and disadvantages of descriptive research
In addition, it obtains information on the phenomenon or situation to be studied, using techniques such as observation and survey, among others. For example, research studying the morphology and mechanism of action of SARS-CoV-2 is descriptive. Answer the “what”, not the “why”.
This type of research is very useful when conducting studies, for example, when you want to know which brand of soda is most consumed in a supermarket, where you only want to know which is the most consumed, and not why it is the most consumed. consumed.
Descriptive investigations, unlike other types of investigations, carry out their study without altering or manipulating any of the variables of the phenomenon, limiting themselves only to their measurement and description. Additionally, it is possible to make future forecasts, although they are considered premature or basic.
Descriptive research characteristics
Here are some of the most important characteristics of descriptive research :
Has no control over variables
In descriptive research, the researcher has no control over any of the variables that affect the event or problem under investigation. Advantages and disadvantages of descriptive research
Existence of variables
To carry out a descriptive research , it is necessary to know in advance the variables that will be analyzed, since this type of research is not dedicated to the search for variables, but to their study.
Although, when obtaining data on the variables , it is possible to make forecasts, these are not entirely reliable, since they are considered premature.
Quantitative information
In most cases, descriptive research gets data on quantities, not qualities . It is for this reason that it can be said that a descriptive research is quantitative. Advantages and disadvantages of descriptive research
Even so, there is also the possibility of obtaining qualitative data.
As in all types of research , the data provided by descriptive research must be both accurate and reliable.
Information classification
Descriptive research can be used to classify the data collected in the study that is being carried out, separating them into different categories of description.
Usually, the cross-sectional or transectional design is the most used to carry out this type of research , although it is also possible to use the pre-experimental design. Advantages and disadvantages of descriptive research
Descriptive research design
The research design is used to draw up the work plan to follow in the research. It is where the conceptual phase of the research, such as the statement of the problem , meets the operational phase, such as the method and instruments of the investigation.
For the case of the design of a descriptive investigation, most of the time it is necessary to obtain data that refers to the quantity. To achieve this task, the researcher can choose between two different types of research designs, which have specific characteristics that differentiate them from each other.
The two types of designs used in descriptive research are described below:
Cross-sectional or transectional design
In cross-sectional designs, the variables are not affected by any type of process, which is why they only dedicate themselves to observing the event as it happens, limiting themselves only to analyzing them. Advantages and disadvantages of descriptive research
They basically consist of making a description of the variables to be measured in a phenomenon, and analyzing the incidence at the time that event occurs.
Pre-experimental design
There are occasions where the pre- experimental design is used as a test to get a first contact with the research problem in a real way, being used, on some occasions, as a test of experiments with a greater degree of control.
This type of design does not allow to establish causal relationships, since they do not have the possibility of controlling variables , and their internal validity is not very reliable. Furthermore, it is applied only to a group, over which it has no control whatsoever.
There are two ways to carry out a pre- experimental design, which are as follows:
- Case study with a single measurement : in this type of design, a stimulus is applied to a group and then the data obtained from the variable or variables to be measured are taken. The simplicity of the design makes it unreliable, since there is no reference to the level of the variable (s) before the stimulus is applied, as well as no control over them.
- Test and post-test design with a single group : for this type of design, a test is carried out before and after applying the stimulus to the group, thus allowing the visualization of the differences that may exist between the measurements of the studied variable (s) . Although, using this design it is possible to differentiate the levels of the variables , before and after the stimulus is applied, it does not allow to visualize causality, since there is no comparison group, nor is there the possibility of manipulating the variables. Advantages and disadvantages of descriptive research
Techniques used in descriptive research
In the case of descriptive research , there are three techniques to carry it out:
Observation
Observation is one of the most used information, of the quantitative or qualitative type:
- To obtain quantitative information , statistical and numerical study methodologies are used, where information about values such as weight, scale and years, among others, is obtained. So it can be said that fundamentally numerical values are obtained.
- On the other hand, to obtain qualitative information, the type of data obtained does not have to do with numbers or statistics , but with the dynamics that occur in the group on which the research is being developed. Advantages and disadvantages of descriptive research
Using the case study it is possible to carry out a slightly more detailed analysis of the event, as well as to study in detail groups or subjects separately.
In addition, it is possible to present a hypothesis and to expand the degree of knowledge about the event under investigation. However, due to its low precision in forecasting, it is not possible to specify the causes and effects of the phenomenon studied.
Research survey
The research survey is one of the most widely used instruments when conducting descriptive research, where the number of samples to be taken is large. Advantages and disadvantages of descriptive research
The selection of questions should include both open and closed questions, thus guaranteeing a balance between them and making it possible to collect good quality information.
Like all different types of research , descriptive research has both advantages and disadvantages. Some of the most important are listed below.
- The brevity by which descriptive investigations are carried out means that their costs are not high, compared to other types of investigations.
- It enables both the collection of quantitative data and qualitative data.
- They allow to formulate hypotheses, as well as provide a large amount of valuable data for the development of future investigations. Advantages and disadvantages of descriptive research
- By using descriptive research , the data is collected in the place where it occurs, without any type of alteration, ensuring the quality and integrity of the same.
Disadvantages
- If the questions are not well formulated, the answers obtained may not be entirely reliable, which makes it difficult to carry out a credible investigation.
- The types of variables that allow the study of descriptive investigations make it impossible to visualize the causes and effects of the event.
- The data obtained by conducting a descriptive research , being collected randomly, make it impossible to obtain valid data that represent the entire population.
Descriptive Research Examples
Some examples of descriptive investigations may be the following:
Penguin census
Studying the penguin population that exists in the South Georgia Islands is a descriptive investigation that answers the what and where. Advantages and disadvantages of descriptive research
National census
The research carried out in a national census is descriptive, since it is only interested in data such as the number of population, the salary they receive, or what class the household is, without making any kind of analogy between these. .
Carrying out a descriptive investigation that collects data about the political party that people will choose in the next elections, it is possible to predict, with a margin of error , the result that will be obtained in them.
Supermarket
Using observation, qualitative data can be collected on the habits of supermarket customers regarding the purchases they make in it. Advantages and disadvantages of descriptive research
Kids playtime
Through the resource of the survey , it is possible to carry out a descriptive investigation that yields information about the number of hours per day that children in a particular population play. Being able to make a forecast of the weather that a particular child of that city plays.
Related Articles

Life story research Method characteristics examples How to apply
Case study definition and example/characteristics/objectives, what is river sampling/types/features.

What is Survey research characteristics templates Advantages Disadvantages
Leave a reply cancel reply.
Your email address will not be published. Required fields are marked *
Save my name, email, and website in this browser for the next time I comment.

Please input characters displayed above.
- Types of Chi square tests/hypothesis test/operation August 12, 2023

An official website of the United States government
The .gov means it’s official. Federal government websites often end in .gov or .mil. Before sharing sensitive information, make sure you’re on a federal government site.
The site is secure. The https:// ensures that you are connecting to the official website and that any information you provide is encrypted and transmitted securely.
- Publications
- Account settings
Preview improvements coming to the PMC website in October 2024. Learn More or Try it out now .
- Advanced Search
- Journal List
- Indian J Crit Care Med
- v.23(Suppl 4); 2019 Dec
Understanding Research Study Designs
Priya ranganathan.
Department of Anesthesiology, Critical Care and Pain, Tata Memorial Hospital, Mumbai, Maharashtra, India
In this article, we will look at the important features of various types of research study designs used commonly in biomedical research.
How to cite this article
Ranganathan P. Understanding Research Study Designs. Indian J Crit Care Med 2019;23(Suppl 4):S305–S307.
We use a variety of research study designs in biomedical research. In this article, the main features of each of these designs are summarized.
TERMS USED IN RESEARCH DESIGNS
Exposure vs outcome.
Exposure refers to any factor that may be associated with the outcome of interest. It is also called the predictor variable or independent variable or risk factor. Outcome refers to the variable that is studied to assess the impact of the exposure on the population. It is also known as the predicted variable or the dependent variable. For example, in a study looking at nerve damage after organophosphate (OPC) poisoning, the exposure would be OPC and the outcome would be nerve damage.
Longitudinal vs Transversal Studies
In longitudinal studies, participants are followed over time to determine the association between exposure and outcome (or outcome and exposure). On the other hand, in transversal studies, observations about exposure and outcome are made at a single point in time.
Forward vs Backward Directed Studies
In forward-directed studies, the direction of enquiry moves from exposure to outcome. In backward-directed studies, the line of enquiry starts with outcome and then determines exposure.
Prospective vs Retrospective Studies
In prospective studies, the outcome has not occurred at the time of initiation of the study. The researcher determines exposure and follows participants into the future to assess outcomes. In retrospective studies, the outcome of interest has already occurred when the study commences.
CLASSIFICATION OF STUDY DESIGNS
Broadly, study designs can be classified as descriptive or analytical (inferential) studies.
Descriptive Studies
Descriptive studies describe the characteristics of interest in the study population (also referred to as sample, to differentiate it from the entire population in the universe). These studies do not have a comparison group. The simplest type of descriptive study is the case report. In a case report, the researcher describes his/her experience with symptoms, signs, diagnosis, or treatment of a patient. Sometimes, a group of patients having a similar experience may be grouped to form a case series.
Case reports and case series form the lowest level of evidence in biomedical research and, as such, are considered hypothesis-generating studies. However, they are easy to write and may be a good starting point for the budding researcher. The recognition of some important associations in the field of medicine—such as that of thalidomide with phocomelia and Kaposi's sarcoma with HIV infection—resulted from case reports and case series. The reader can look up several published case reports and case series related to complications after OPC poisoning. 1 , 2
Analytical (Inferential) Studies
Analytical or inferential studies try to prove a hypothesis and establish an association between an exposure and an outcome. These studies usually have a comparator group. Analytical studies are further classified as observational or interventional studies.
In observational studies, there is no intervention by the researcher. The researcher merely observes outcomes in different groups of participants who, for natural reasons, have or have not been exposed to a particular risk factor. Examples of observational studies include cross-sectional, case–control, and cohort studies.
Cross-sectional Studies
These are transversal studies where data are collected from the study population at a single point in time. Exposure and outcome are determined simultaneously. Cross-sectional studies are easy to conduct, involve no follow-up, and need limited resources. They offer useful information on prevalence of health conditions and possible associations between risk factors and outcomes. However, there are two major limitations of cross-sectional studies. First, it may not be possible to establish a clear cause–benefit relationship. For example, in a study of association between colon cancer and dietary fiber intake, it may be difficult to establish whether the low fiber intake preceded the symptoms of colon cancer or whether the symptoms of colon cancer resulted in a change in dietary fiber intake. Another important limitation of cross-sectional studies is survival bias. For example, in a study looking at alcohol intake vs mortality due to chronic liver disease, among the participants with the highest alcohol intake, several may have died of liver disease; this will not be picked up by the study and will give biased results. An example of a cross-sectional study is a survey on nurses’ knowledge and practices of initial management of acute poisoning. 3
Case–control Studies
Case–control studies are backward-directed studies. Here, the direction of enquiry begins with the outcome and then proceeds to exposure. Case–control studies are always retrospective, i.e., the outcome of interest has occurred when the study begins. The researcher identifies participants who have developed the outcome of interest (cases) and chooses matching participants who do not have the outcome (controls). Matching is done based on factors that are likely to influence the exposure or outcome (e.g., age, gender, socioeconomic status). The researcher then proceeds to determine exposure in cases and controls. If cases have a higher incidence of exposure than controls, it suggests an association between exposure and outcome. Case–control studies are relatively quick to conduct, need limited resources, and are useful when the outcome is rare. They also allow the researcher to study multiple exposures for a particular outcome. However, they have several limitations. First, matching of cases with controls may not be easy since many unknown confounders may affect exposure and outcome. Second, there may be biased in the way the history of exposure is determined in cases vs controls; one way to overcome this is to have a blinded assessor determining the exposure using a standard technique (e.g., a standardized questionnaire). However, despite this, it has been shown that cases are far more likely than controls to recall history of exposure—the “recall bias.” For example, mothers of babies born with congenital anomalies may provide a more detailed history of drugs ingested during their pregnancy than those with normal babies. Also, since case-control studies do not begin with a population at risk, it is not possible to determine the true risk of outcome. Instead, one can only calculate the odds of association between exposure and outcome.
Kendrick and colleagues designed a case–control study to look at the association between domestic poison prevention practices and medically attended poisoning in children. They identified children presenting with unintentional poisoning at home (cases with the outcome), matched them with community participants (controls without the outcome), and then elicited data from parents and caregivers on home safety practices (exposure). 4
Cohort Studies
Cohort studies resemble clinical trials except that the exposure is naturally determined instead of being decided by the investigator. Here, the direction of enquiry begins with the exposure and then proceeds to outcome. The researcher begins with a group of individuals who are free of outcome at baseline; of these, some have the exposure (study cohort) while others do not (control group). The groups are followed up over a period of time to determine occurrence of outcome. Cohort studies may be prospective (involving a period of follow-up after the start of the study) or retrospective (e.g., using medical records or registry data). Cohort studies are considered the strongest among the observational study designs. They provide proof of temporal relationship (exposure occurred before outcome), allow determination of risk, and permit multiple outcomes to be studied for a single exposure. However, they are expensive to conduct and time-consuming, there may be several losses to follow-up, and they are not suitable for studying rare outcomes. Also, there may be unknown confounders other than the exposure affecting the occurrence of the outcome.
Jayasinghe conducted a cohort study to look at the effect of acute organophosphorus poisoning on nerve function. They recruited 70 patients with OPC poisoning (exposed group) and 70 matched controls without history of pesticide exposure (unexposed controls). Participants were followed up or 6 weeks for neurophysiological assessments to determine nerve damage (outcome). Hung carried out a retrospective cohort study using a nationwide research database to look at the long-term effects of OPC poisoning on cardiovascular disease. From the database, he identified an OPC-exposed cohort and an unexposed control cohort (matched for gender and age) from several years back and then examined later records to look at the development of cardiovascular diseases in both groups. 5
Interventional Studies
In interventional studies (also known as experimental studies or clinical trials), the researcher deliberately allots participants to receive one of several interventions; of these, some may be experimental while others may be controls (either standard of care or placebo). Allotment of participants to a particular treatment arm is carried out through the process of randomization, which ensures that every participant has a similar chance of being in any of the arms, eliminating bias in selection. There are several other aspects crucial to the validity of the results of a clinical trial such as allocation concealment, blinding, choice of control, and statistical analysis plan. These will be discussed in a separate article.
The randomized controlled clinical trial is considered the gold standard for evaluating the efficacy of a treatment. Randomization leads to equal distribution of known and unknown confounders between treatment arms; therefore, we can be reasonably certain that any difference in outcome is a treatment effect and not due to other factors. The temporal sequence of cause and effect is established. It is possible to determine risk of the outcome in each treatment arm accurately. However, randomized controlled trials have their limitations and may not be possible in every situation. For example, it is unethical to randomize participants to an intervention that is likely to cause harm—e.g., smoking. In such cases, well-designed observational studies are the only option. Also, these trials are expensive to conduct and resource-intensive.
In a randomized controlled trial, Li et al. randomly allocated patients of paraquat poisoning to receive either conventional therapy (control group) or continuous veno-venous hemofiltration (intervention). Patients were followed up to look for mortality or other adverse events (outcome). 6
Researchers need to understand the features of different study designs, with their advantages and limitations so that the most appropriate design can be chosen for a particular research question. The Centre for Evidence Based Medicine offers an useful tool to determine the type of research design used in a particular study. 7
Source of support: Nil
Conflict of interest: None
Want to create or adapt books like this? Learn more about how Pressbooks supports open publishing practices.
2.2 Psychologists Use Descriptive, Correlational, and Experimental Research Designs to Understand Behavior
Learning objectives.
- Differentiate the goals of descriptive, correlational, and experimental research designs and explain the advantages and disadvantages of each.
- Explain the goals of descriptive research and the statistical techniques used to interpret it.
- Summarize the uses of correlational research and describe why correlational research cannot be used to infer causality.
- Review the procedures of experimental research and explain how it can be used to draw causal inferences.
Psychologists agree that if their ideas and theories about human behavior are to be taken seriously, they must be backed up by data. However, the research of different psychologists is designed with different goals in mind, and the different goals require different approaches. These varying approaches, summarized in Table 2.2 “Characteristics of the Three Research Designs” , are known as research designs . A research design is the specific method a researcher uses to collect, analyze, and interpret data . Psychologists use three major types of research designs in their research, and each provides an essential avenue for scientific investigation. Descriptive research is research designed to provide a snapshot of the current state of affairs . Correlational research is research designed to discover relationships among variables and to allow the prediction of future events from present knowledge . Experimental research is research in which initial equivalence among research participants in more than one group is created, followed by a manipulation of a given experience for these groups and a measurement of the influence of the manipulation . Each of the three research designs varies according to its strengths and limitations, and it is important to understand how each differs.
Table 2.2 Characteristics of the Three Research Designs
| Research design | Goal | Advantages | Disadvantages |
|---|---|---|---|
| Descriptive | To create a snapshot of the current state of affairs | Provides a relatively complete picture of what is occurring at a given time. Allows the development of questions for further study. | Does not assess relationships among variables. May be unethical if participants do not know they are being observed. |
| Correlational | To assess the relationships between and among two or more variables | Allows testing of expected relationships between and among variables and the making of predictions. Can assess these relationships in everyday life events. | Cannot be used to draw inferences about the causal relationships between and among the variables. |
| Experimental | To assess the causal impact of one or more experimental manipulations on a dependent variable | Allows drawing of conclusions about the causal relationships among variables. | Cannot experimentally manipulate many important variables. May be expensive and time consuming. |
| There are three major research designs used by psychologists, and each has its own advantages and disadvantages. | |||
Stangor, C. (2011). Research methods for the behavioral sciences (4th ed.). Mountain View, CA: Cengage.
Descriptive Research: Assessing the Current State of Affairs
Descriptive research is designed to create a snapshot of the current thoughts, feelings, or behavior of individuals. This section reviews three types of descriptive research: case studies , surveys , and naturalistic observation .
Sometimes the data in a descriptive research project are based on only a small set of individuals, often only one person or a single small group. These research designs are known as case studies — descriptive records of one or more individual’s experiences and behavior . Sometimes case studies involve ordinary individuals, as when developmental psychologist Jean Piaget used his observation of his own children to develop his stage theory of cognitive development. More frequently, case studies are conducted on individuals who have unusual or abnormal experiences or characteristics or who find themselves in particularly difficult or stressful situations. The assumption is that by carefully studying individuals who are socially marginal, who are experiencing unusual situations, or who are going through a difficult phase in their lives, we can learn something about human nature.
Sigmund Freud was a master of using the psychological difficulties of individuals to draw conclusions about basic psychological processes. Freud wrote case studies of some of his most interesting patients and used these careful examinations to develop his important theories of personality. One classic example is Freud’s description of “Little Hans,” a child whose fear of horses the psychoanalyst interpreted in terms of repressed sexual impulses and the Oedipus complex (Freud (1909/1964).

Political polls reported in newspapers and on the Internet are descriptive research designs that provide snapshots of the likely voting behavior of a population.
Another well-known case study is Phineas Gage, a man whose thoughts and emotions were extensively studied by cognitive psychologists after a railroad spike was blasted through his skull in an accident. Although there is question about the interpretation of this case study (Kotowicz, 2007), it did provide early evidence that the brain’s frontal lobe is involved in emotion and morality (Damasio et al., 2005). An interesting example of a case study in clinical psychology is described by Rokeach (1964), who investigated in detail the beliefs and interactions among three patients with schizophrenia, all of whom were convinced they were Jesus Christ.
In other cases the data from descriptive research projects come in the form of a survey — a measure administered through either an interview or a written questionnaire to get a picture of the beliefs or behaviors of a sample of people of interest . The people chosen to participate in the research (known as the sample ) are selected to be representative of all the people that the researcher wishes to know about (the population ). In election polls, for instance, a sample is taken from the population of all “likely voters” in the upcoming elections.
The results of surveys may sometimes be rather mundane, such as “Nine out of ten doctors prefer Tymenocin,” or “The median income in Montgomery County is $36,712.” Yet other times (particularly in discussions of social behavior), the results can be shocking: “More than 40,000 people are killed by gunfire in the United States every year,” or “More than 60% of women between the ages of 50 and 60 suffer from depression.” Descriptive research is frequently used by psychologists to get an estimate of the prevalence (or incidence ) of psychological disorders.
A final type of descriptive research—known as naturalistic observation —is research based on the observation of everyday events . For instance, a developmental psychologist who watches children on a playground and describes what they say to each other while they play is conducting descriptive research, as is a biopsychologist who observes animals in their natural habitats. One example of observational research involves a systematic procedure known as the strange situation , used to get a picture of how adults and young children interact. The data that are collected in the strange situation are systematically coded in a coding sheet such as that shown in Table 2.3 “Sample Coding Form Used to Assess Child’s and Mother’s Behavior in the Strange Situation” .
Table 2.3 Sample Coding Form Used to Assess Child’s and Mother’s Behavior in the Strange Situation
| Coder name: | ||||
|---|---|---|---|---|
| Mother and baby play alone | ||||
| Mother puts baby down | ||||
| Stranger enters room | ||||
| Mother leaves room; stranger plays with baby | ||||
| Mother reenters, greets and may comfort baby, then leaves again | ||||
| Stranger tries to play with baby | ||||
| Mother reenters and picks up baby | ||||
| The baby moves toward, grasps, or climbs on the adult. | ||||
| The baby resists being put down by the adult by crying or trying to climb back up. | ||||
| The baby pushes, hits, or squirms to be put down from the adult’s arms. | ||||
| The baby turns away or moves away from the adult. | ||||
| This table represents a sample coding sheet from an episode of the “strange situation,” in which an infant (usually about 1 year old) is observed playing in a room with two adults—the child’s mother and a stranger. Each of the four coding categories is scored by the coder from 1 (the baby makes no effort to engage in the behavior) to 7 (the baby makes a significant effort to engage in the behavior). More information about the meaning of the coding can be found in Ainsworth, Blehar, Waters, and Wall (1978). | ||||
The results of descriptive research projects are analyzed using descriptive statistics — numbers that summarize the distribution of scores on a measured variable . Most variables have distributions similar to that shown in Figure 2.5 “Height Distribution” , where most of the scores are located near the center of the distribution, and the distribution is symmetrical and bell-shaped. A data distribution that is shaped like a bell is known as a normal distribution .
Table 2.4 Height and Family Income for 25 Students
| Student name | Height in inches | Family income in dollars |
|---|---|---|
| Lauren | 62 | 48,000 |
| Courtnie | 62 | 57,000 |
| Leslie | 63 | 93,000 |
| Renee | 64 | 107,000 |
| Katherine | 64 | 110,000 |
| Jordan | 65 | 93,000 |
| Rabiah | 66 | 46,000 |
| Alina | 66 | 84,000 |
| Young Su | 67 | 68,000 |
| Martin | 67 | 49,000 |
| Hanzhu | 67 | 73,000 |
| Caitlin | 67 | 3,800,000 |
| Steven | 67 | 107,000 |
| Emily | 67 | 64,000 |
| Amy | 68 | 67,000 |
| Jonathan | 68 | 51,000 |
| Julian | 68 | 48,000 |
| Alissa | 68 | 93,000 |
| Christine | 69 | 93,000 |
| Candace | 69 | 111,000 |
| Xiaohua | 69 | 56,000 |
| Charlie | 70 | 94,000 |
| Timothy | 71 | 73,000 |
| Ariane | 72 | 70,000 |
| Logan | 72 | 44,000 |
Figure 2.5 Height Distribution

The distribution of the heights of the students in a class will form a normal distribution. In this sample the mean ( M ) = 67.12 and the standard deviation ( s ) = 2.74.
A distribution can be described in terms of its central tendency —that is, the point in the distribution around which the data are centered—and its dispersion , or spread. The arithmetic average, or arithmetic mean , is the most commonly used measure of central tendency . It is computed by calculating the sum of all the scores of the variable and dividing this sum by the number of participants in the distribution (denoted by the letter N ). In the data presented in Figure 2.5 “Height Distribution” , the mean height of the students is 67.12 inches. The sample mean is usually indicated by the letter M .
In some cases, however, the data distribution is not symmetrical. This occurs when there are one or more extreme scores (known as outliers ) at one end of the distribution. Consider, for instance, the variable of family income (see Figure 2.6 “Family Income Distribution” ), which includes an outlier (a value of $3,800,000). In this case the mean is not a good measure of central tendency. Although it appears from Figure 2.6 “Family Income Distribution” that the central tendency of the family income variable should be around $70,000, the mean family income is actually $223,960. The single very extreme income has a disproportionate impact on the mean, resulting in a value that does not well represent the central tendency.
The median is used as an alternative measure of central tendency when distributions are not symmetrical. The median is the score in the center of the distribution, meaning that 50% of the scores are greater than the median and 50% of the scores are less than the median . In our case, the median household income ($73,000) is a much better indication of central tendency than is the mean household income ($223,960).
Figure 2.6 Family Income Distribution

The distribution of family incomes is likely to be nonsymmetrical because some incomes can be very large in comparison to most incomes. In this case the median or the mode is a better indicator of central tendency than is the mean.
A final measure of central tendency, known as the mode , represents the value that occurs most frequently in the distribution . You can see from Figure 2.6 “Family Income Distribution” that the mode for the family income variable is $93,000 (it occurs four times).
In addition to summarizing the central tendency of a distribution, descriptive statistics convey information about how the scores of the variable are spread around the central tendency. Dispersion refers to the extent to which the scores are all tightly clustered around the central tendency, like this:

Or they may be more spread out away from it, like this:

One simple measure of dispersion is to find the largest (the maximum ) and the smallest (the minimum ) observed values of the variable and to compute the range of the variable as the maximum observed score minus the minimum observed score. You can check that the range of the height variable in Figure 2.5 “Height Distribution” is 72 – 62 = 10. The standard deviation , symbolized as s , is the most commonly used measure of dispersion . Distributions with a larger standard deviation have more spread. The standard deviation of the height variable is s = 2.74, and the standard deviation of the family income variable is s = $745,337.
An advantage of descriptive research is that it attempts to capture the complexity of everyday behavior. Case studies provide detailed information about a single person or a small group of people, surveys capture the thoughts or reported behaviors of a large population of people, and naturalistic observation objectively records the behavior of people or animals as it occurs naturally. Thus descriptive research is used to provide a relatively complete understanding of what is currently happening.
Despite these advantages, descriptive research has a distinct disadvantage in that, although it allows us to get an idea of what is currently happening, it is usually limited to static pictures. Although descriptions of particular experiences may be interesting, they are not always transferable to other individuals in other situations, nor do they tell us exactly why specific behaviors or events occurred. For instance, descriptions of individuals who have suffered a stressful event, such as a war or an earthquake, can be used to understand the individuals’ reactions to the event but cannot tell us anything about the long-term effects of the stress. And because there is no comparison group that did not experience the stressful situation, we cannot know what these individuals would be like if they hadn’t had the stressful experience.
Correlational Research: Seeking Relationships Among Variables
In contrast to descriptive research, which is designed primarily to provide static pictures, correlational research involves the measurement of two or more relevant variables and an assessment of the relationship between or among those variables. For instance, the variables of height and weight are systematically related (correlated) because taller people generally weigh more than shorter people. In the same way, study time and memory errors are also related, because the more time a person is given to study a list of words, the fewer errors he or she will make. When there are two variables in the research design, one of them is called the predictor variable and the other the outcome variable . The research design can be visualized like this, where the curved arrow represents the expected correlation between the two variables:
Figure 2.2.2

One way of organizing the data from a correlational study with two variables is to graph the values of each of the measured variables using a scatter plot . As you can see in Figure 2.10 “Examples of Scatter Plots” , a scatter plot is a visual image of the relationship between two variables . A point is plotted for each individual at the intersection of his or her scores for the two variables. When the association between the variables on the scatter plot can be easily approximated with a straight line, as in parts (a) and (b) of Figure 2.10 “Examples of Scatter Plots” , the variables are said to have a linear relationship .
When the straight line indicates that individuals who have above-average values for one variable also tend to have above-average values for the other variable, as in part (a), the relationship is said to be positive linear . Examples of positive linear relationships include those between height and weight, between education and income, and between age and mathematical abilities in children. In each case people who score higher on one of the variables also tend to score higher on the other variable. Negative linear relationships , in contrast, as shown in part (b), occur when above-average values for one variable tend to be associated with below-average values for the other variable. Examples of negative linear relationships include those between the age of a child and the number of diapers the child uses, and between practice on and errors made on a learning task. In these cases people who score higher on one of the variables tend to score lower on the other variable.
Relationships between variables that cannot be described with a straight line are known as nonlinear relationships . Part (c) of Figure 2.10 “Examples of Scatter Plots” shows a common pattern in which the distribution of the points is essentially random. In this case there is no relationship at all between the two variables, and they are said to be independent . Parts (d) and (e) of Figure 2.10 “Examples of Scatter Plots” show patterns of association in which, although there is an association, the points are not well described by a single straight line. For instance, part (d) shows the type of relationship that frequently occurs between anxiety and performance. Increases in anxiety from low to moderate levels are associated with performance increases, whereas increases in anxiety from moderate to high levels are associated with decreases in performance. Relationships that change in direction and thus are not described by a single straight line are called curvilinear relationships .
Figure 2.10 Examples of Scatter Plots

Some examples of relationships between two variables as shown in scatter plots. Note that the Pearson correlation coefficient ( r ) between variables that have curvilinear relationships will likely be close to zero.
Adapted from Stangor, C. (2011). Research methods for the behavioral sciences (4th ed.). Mountain View, CA: Cengage.
The most common statistical measure of the strength of linear relationships among variables is the Pearson correlation coefficient , which is symbolized by the letter r . The value of the correlation coefficient ranges from r = –1.00 to r = +1.00. The direction of the linear relationship is indicated by the sign of the correlation coefficient. Positive values of r (such as r = .54 or r = .67) indicate that the relationship is positive linear (i.e., the pattern of the dots on the scatter plot runs from the lower left to the upper right), whereas negative values of r (such as r = –.30 or r = –.72) indicate negative linear relationships (i.e., the dots run from the upper left to the lower right). The strength of the linear relationship is indexed by the distance of the correlation coefficient from zero (its absolute value). For instance, r = –.54 is a stronger relationship than r = .30, and r = .72 is a stronger relationship than r = –.57. Because the Pearson correlation coefficient only measures linear relationships, variables that have curvilinear relationships are not well described by r , and the observed correlation will be close to zero.
It is also possible to study relationships among more than two measures at the same time. A research design in which more than one predictor variable is used to predict a single outcome variable is analyzed through multiple regression (Aiken & West, 1991). Multiple regression is a statistical technique, based on correlation coefficients among variables, that allows predicting a single outcome variable from more than one predictor variable . For instance, Figure 2.11 “Prediction of Job Performance From Three Predictor Variables” shows a multiple regression analysis in which three predictor variables are used to predict a single outcome. The use of multiple regression analysis shows an important advantage of correlational research designs—they can be used to make predictions about a person’s likely score on an outcome variable (e.g., job performance) based on knowledge of other variables.
Figure 2.11 Prediction of Job Performance From Three Predictor Variables

Multiple regression allows scientists to predict the scores on a single outcome variable using more than one predictor variable.
An important limitation of correlational research designs is that they cannot be used to draw conclusions about the causal relationships among the measured variables. Consider, for instance, a researcher who has hypothesized that viewing violent behavior will cause increased aggressive play in children. He has collected, from a sample of fourth-grade children, a measure of how many violent television shows each child views during the week, as well as a measure of how aggressively each child plays on the school playground. From his collected data, the researcher discovers a positive correlation between the two measured variables.
Although this positive correlation appears to support the researcher’s hypothesis, it cannot be taken to indicate that viewing violent television causes aggressive behavior. Although the researcher is tempted to assume that viewing violent television causes aggressive play,

there are other possibilities. One alternate possibility is that the causal direction is exactly opposite from what has been hypothesized. Perhaps children who have behaved aggressively at school develop residual excitement that leads them to want to watch violent television shows at home:

Although this possibility may seem less likely, there is no way to rule out the possibility of such reverse causation on the basis of this observed correlation. It is also possible that both causal directions are operating and that the two variables cause each other:

Still another possible explanation for the observed correlation is that it has been produced by the presence of a common-causal variable (also known as a third variable ). A common-causal variable is a variable that is not part of the research hypothesis but that causes both the predictor and the outcome variable and thus produces the observed correlation between them . In our example a potential common-causal variable is the discipline style of the children’s parents. Parents who use a harsh and punitive discipline style may produce children who both like to watch violent television and who behave aggressively in comparison to children whose parents use less harsh discipline:

In this case, television viewing and aggressive play would be positively correlated (as indicated by the curved arrow between them), even though neither one caused the other but they were both caused by the discipline style of the parents (the straight arrows). When the predictor and outcome variables are both caused by a common-causal variable, the observed relationship between them is said to be spurious . A spurious relationship is a relationship between two variables in which a common-causal variable produces and “explains away” the relationship . If effects of the common-causal variable were taken away, or controlled for, the relationship between the predictor and outcome variables would disappear. In the example the relationship between aggression and television viewing might be spurious because by controlling for the effect of the parents’ disciplining style, the relationship between television viewing and aggressive behavior might go away.
Common-causal variables in correlational research designs can be thought of as “mystery” variables because, as they have not been measured, their presence and identity are usually unknown to the researcher. Since it is not possible to measure every variable that could cause both the predictor and outcome variables, the existence of an unknown common-causal variable is always a possibility. For this reason, we are left with the basic limitation of correlational research: Correlation does not demonstrate causation. It is important that when you read about correlational research projects, you keep in mind the possibility of spurious relationships, and be sure to interpret the findings appropriately. Although correlational research is sometimes reported as demonstrating causality without any mention being made of the possibility of reverse causation or common-causal variables, informed consumers of research, like you, are aware of these interpretational problems.
In sum, correlational research designs have both strengths and limitations. One strength is that they can be used when experimental research is not possible because the predictor variables cannot be manipulated. Correlational designs also have the advantage of allowing the researcher to study behavior as it occurs in everyday life. And we can also use correlational designs to make predictions—for instance, to predict from the scores on their battery of tests the success of job trainees during a training session. But we cannot use such correlational information to determine whether the training caused better job performance. For that, researchers rely on experiments.
Experimental Research: Understanding the Causes of Behavior
The goal of experimental research design is to provide more definitive conclusions about the causal relationships among the variables in the research hypothesis than is available from correlational designs. In an experimental research design, the variables of interest are called the independent variable (or variables ) and the dependent variable . The independent variable in an experiment is the causing variable that is created (manipulated) by the experimenter . The dependent variable in an experiment is a measured variable that is expected to be influenced by the experimental manipulation . The research hypothesis suggests that the manipulated independent variable or variables will cause changes in the measured dependent variables. We can diagram the research hypothesis by using an arrow that points in one direction. This demonstrates the expected direction of causality:
Figure 2.2.3

Research Focus: Video Games and Aggression
Consider an experiment conducted by Anderson and Dill (2000). The study was designed to test the hypothesis that viewing violent video games would increase aggressive behavior. In this research, male and female undergraduates from Iowa State University were given a chance to play with either a violent video game (Wolfenstein 3D) or a nonviolent video game (Myst). During the experimental session, the participants played their assigned video games for 15 minutes. Then, after the play, each participant played a competitive game with an opponent in which the participant could deliver blasts of white noise through the earphones of the opponent. The operational definition of the dependent variable (aggressive behavior) was the level and duration of noise delivered to the opponent. The design of the experiment is shown in Figure 2.17 “An Experimental Research Design” .
Figure 2.17 An Experimental Research Design

Two advantages of the experimental research design are (1) the assurance that the independent variable (also known as the experimental manipulation) occurs prior to the measured dependent variable, and (2) the creation of initial equivalence between the conditions of the experiment (in this case by using random assignment to conditions).
Experimental designs have two very nice features. For one, they guarantee that the independent variable occurs prior to the measurement of the dependent variable. This eliminates the possibility of reverse causation. Second, the influence of common-causal variables is controlled, and thus eliminated, by creating initial equivalence among the participants in each of the experimental conditions before the manipulation occurs.
The most common method of creating equivalence among the experimental conditions is through random assignment to conditions , a procedure in which the condition that each participant is assigned to is determined through a random process, such as drawing numbers out of an envelope or using a random number table . Anderson and Dill first randomly assigned about 100 participants to each of their two groups (Group A and Group B). Because they used random assignment to conditions, they could be confident that, before the experimental manipulation occurred, the students in Group A were, on average, equivalent to the students in Group B on every possible variable, including variables that are likely to be related to aggression, such as parental discipline style, peer relationships, hormone levels, diet—and in fact everything else.
Then, after they had created initial equivalence, Anderson and Dill created the experimental manipulation—they had the participants in Group A play the violent game and the participants in Group B play the nonviolent game. Then they compared the dependent variable (the white noise blasts) between the two groups, finding that the students who had viewed the violent video game gave significantly longer noise blasts than did the students who had played the nonviolent game.
Anderson and Dill had from the outset created initial equivalence between the groups. This initial equivalence allowed them to observe differences in the white noise levels between the two groups after the experimental manipulation, leading to the conclusion that it was the independent variable (and not some other variable) that caused these differences. The idea is that the only thing that was different between the students in the two groups was the video game they had played.
Despite the advantage of determining causation, experiments do have limitations. One is that they are often conducted in laboratory situations rather than in the everyday lives of people. Therefore, we do not know whether results that we find in a laboratory setting will necessarily hold up in everyday life. Second, and more important, is that some of the most interesting and key social variables cannot be experimentally manipulated. If we want to study the influence of the size of a mob on the destructiveness of its behavior, or to compare the personality characteristics of people who join suicide cults with those of people who do not join such cults, these relationships must be assessed using correlational designs, because it is simply not possible to experimentally manipulate these variables.
Key Takeaways
- Descriptive, correlational, and experimental research designs are used to collect and analyze data.
- Descriptive designs include case studies, surveys, and naturalistic observation. The goal of these designs is to get a picture of the current thoughts, feelings, or behaviors in a given group of people. Descriptive research is summarized using descriptive statistics.
- Correlational research designs measure two or more relevant variables and assess a relationship between or among them. The variables may be presented on a scatter plot to visually show the relationships. The Pearson Correlation Coefficient ( r ) is a measure of the strength of linear relationship between two variables.
- Common-causal variables may cause both the predictor and outcome variable in a correlational design, producing a spurious relationship. The possibility of common-causal variables makes it impossible to draw causal conclusions from correlational research designs.
- Experimental research involves the manipulation of an independent variable and the measurement of a dependent variable. Random assignment to conditions is normally used to create initial equivalence between the groups, allowing researchers to draw causal conclusions.
Exercises and Critical Thinking
- There is a negative correlation between the row that a student sits in in a large class (when the rows are numbered from front to back) and his or her final grade in the class. Do you think this represents a causal relationship or a spurious relationship, and why?
- Think of two variables (other than those mentioned in this book) that are likely to be correlated, but in which the correlation is probably spurious. What is the likely common-causal variable that is producing the relationship?
- Imagine a researcher wants to test the hypothesis that participating in psychotherapy will cause a decrease in reported anxiety. Describe the type of research design the investigator might use to draw this conclusion. What would be the independent and dependent variables in the research?
Aiken, L., & West, S. (1991). Multiple regression: Testing and interpreting interactions . Newbury Park, CA: Sage.
Ainsworth, M. S., Blehar, M. C., Waters, E., & Wall, S. (1978). Patterns of attachment: A psychological study of the strange situation . Hillsdale, NJ: Lawrence Erlbaum Associates.
Anderson, C. A., & Dill, K. E. (2000). Video games and aggressive thoughts, feelings, and behavior in the laboratory and in life. Journal of Personality and Social Psychology, 78 (4), 772–790.
Damasio, H., Grabowski, T., Frank, R., Galaburda, A. M., Damasio, A. R., Cacioppo, J. T., & Berntson, G. G. (2005). The return of Phineas Gage: Clues about the brain from the skull of a famous patient. In Social neuroscience: Key readings. (pp. 21–28). New York, NY: Psychology Press.
Freud, S. (1964). Analysis of phobia in a five-year-old boy. In E. A. Southwell & M. Merbaum (Eds.), Personality: Readings in theory and research (pp. 3–32). Belmont, CA: Wadsworth. (Original work published 1909)
Kotowicz, Z. (2007). The strange case of Phineas Gage. History of the Human Sciences, 20 (1), 115–131.
Rokeach, M. (1964). The three Christs of Ypsilanti: A psychological study . New York, NY: Knopf.
Introduction to Psychology Copyright © 2015 by University of Minnesota is licensed under a Creative Commons Attribution-NonCommercial-ShareAlike 4.0 International License , except where otherwise noted.
Educational resources and simple solutions for your research journey

What is Descriptive Research? Definition, Methods, Types and Examples
Descriptive research is a methodological approach that seeks to depict the characteristics of a phenomenon or subject under investigation. In scientific inquiry, it serves as a foundational tool for researchers aiming to observe, record, and analyze the intricate details of a particular topic. This method provides a rich and detailed account that aids in understanding, categorizing, and interpreting the subject matter.
Descriptive research design is widely employed across diverse fields, and its primary objective is to systematically observe and document all variables and conditions influencing the phenomenon.
After this descriptive research definition, let’s look at this example. Consider a researcher working on climate change adaptation, who wants to understand water management trends in an arid village in a specific study area. She must conduct a demographic survey of the region, gather population data, and then conduct descriptive research on this demographic segment. The study will then uncover details on “what are the water management practices and trends in village X.” Note, however, that it will not cover any investigative information about “why” the patterns exist.
Table of Contents
What is descriptive research?
If you’ve been wondering “What is descriptive research,” we’ve got you covered in this post! In a nutshell, descriptive research is an exploratory research method that helps a researcher describe a population, circumstance, or phenomenon. It can help answer what , where , when and how questions, but not why questions. In other words, it does not involve changing the study variables and does not seek to establish cause-and-effect relationships.

Importance of descriptive research
Now, let’s delve into the importance of descriptive research. This research method acts as the cornerstone for various academic and applied disciplines. Its primary significance lies in its ability to provide a comprehensive overview of a phenomenon, enabling researchers to gain a nuanced understanding of the variables at play. This method aids in forming hypotheses, generating insights, and laying the groundwork for further in-depth investigations. The following points further illustrate its importance:
Provides insights into a population or phenomenon: Descriptive research furnishes a comprehensive overview of the characteristics and behaviors of a specific population or phenomenon, thereby guiding and shaping the research project.
Offers baseline data: The data acquired through this type of research acts as a reference for subsequent investigations, laying the groundwork for further studies.
Allows validation of sampling methods: Descriptive research validates sampling methods, aiding in the selection of the most effective approach for the study.
Helps reduce time and costs: It is cost-effective and time-efficient, making this an economical means of gathering information about a specific population or phenomenon.
Ensures replicability: Descriptive research is easily replicable, ensuring a reliable way to collect and compare information from various sources.
When to use descriptive research design?
Determining when to use descriptive research depends on the nature of the research question. Before diving into the reasons behind an occurrence, understanding the how, when, and where aspects is essential. Descriptive research design is a suitable option when the research objective is to discern characteristics, frequencies, trends, and categories without manipulating variables. It is therefore often employed in the initial stages of a study before progressing to more complex research designs. To put it in another way, descriptive research precedes the hypotheses of explanatory research. It is particularly valuable when there is limited existing knowledge about the subject.
Some examples are as follows, highlighting that these questions would arise before a clear outline of the research plan is established:
- In the last two decades, what changes have occurred in patterns of urban gardening in Mumbai?
- What are the differences in climate change perceptions of farmers in coastal versus inland villages in the Philippines?
Characteristics of descriptive research
Coming to the characteristics of descriptive research, this approach is characterized by its focus on observing and documenting the features of a subject. Specific characteristics are as below.
- Quantitative nature: Some descriptive research types involve quantitative research methods to gather quantifiable information for statistical analysis of the population sample.
- Qualitative nature: Some descriptive research examples include those using the qualitative research method to describe or explain the research problem.
- Observational nature: This approach is non-invasive and observational because the study variables remain untouched. Researchers merely observe and report, without introducing interventions that could impact the subject(s).
- Cross-sectional nature: In descriptive research, different sections belonging to the same group are studied, providing a “snapshot” of sorts.
- Springboard for further research: The data collected are further studied and analyzed using different research techniques. This approach helps guide the suitable research methods to be employed.
Types of descriptive research
There are various descriptive research types, each suited to different research objectives. Take a look at the different types below.
- Surveys: This involves collecting data through questionnaires or interviews to gather qualitative and quantitative data.
- Observational studies: This involves observing and collecting data on a particular population or phenomenon without influencing the study variables or manipulating the conditions. These may be further divided into cohort studies, case studies, and cross-sectional studies:
- Cohort studies: Also known as longitudinal studies, these studies involve the collection of data over an extended period, allowing researchers to track changes and trends.
- Case studies: These deal with a single individual, group, or event, which might be rare or unusual.
- Cross-sectional studies : A researcher collects data at a single point in time, in order to obtain a snapshot of a specific moment.
- Focus groups: In this approach, a small group of people are brought together to discuss a topic. The researcher moderates and records the group discussion. This can also be considered a “participatory” observational method.
- Descriptive classification: Relevant to the biological sciences, this type of approach may be used to classify living organisms.
Descriptive research methods
Several descriptive research methods can be employed, and these are more or less similar to the types of approaches mentioned above.
- Surveys: This method involves the collection of data through questionnaires or interviews. Surveys may be done online or offline, and the target subjects might be hyper-local, regional, or global.
- Observational studies: These entail the direct observation of subjects in their natural environment. These include case studies, dealing with a single case or individual, as well as cross-sectional and longitudinal studies, for a glimpse into a population or changes in trends over time, respectively. Participatory observational studies such as focus group discussions may also fall under this method.
Researchers must carefully consider descriptive research methods, types, and examples to harness their full potential in contributing to scientific knowledge.
Examples of descriptive research
Now, let’s consider some descriptive research examples.
- In social sciences, an example could be a study analyzing the demographics of a specific community to understand its socio-economic characteristics.
- In business, a market research survey aiming to describe consumer preferences would be a descriptive study.
- In ecology, a researcher might undertake a survey of all the types of monocots naturally occurring in a region and classify them up to species level.
These examples showcase the versatility of descriptive research across diverse fields.
Advantages of descriptive research
There are several advantages to this approach, which every researcher must be aware of. These are as follows:
- Owing to the numerous descriptive research methods and types, primary data can be obtained in diverse ways and be used for developing a research hypothesis .
- It is a versatile research method and allows flexibility.
- Detailed and comprehensive information can be obtained because the data collected can be qualitative or quantitative.
- It is carried out in the natural environment, which greatly minimizes certain types of bias and ethical concerns.
- It is an inexpensive and efficient approach, even with large sample sizes
Disadvantages of descriptive research
On the other hand, this design has some drawbacks as well:
- It is limited in its scope as it does not determine cause-and-effect relationships.
- The approach does not generate new information and simply depends on existing data.
- Study variables are not manipulated or controlled, and this limits the conclusions to be drawn.
- Descriptive research findings may not be generalizable to other populations.
- Finally, it offers a preliminary understanding rather than an in-depth understanding.
To reiterate, the advantages of descriptive research lie in its ability to provide a comprehensive overview, aid hypothesis generation, and serve as a preliminary step in the research process. However, its limitations include a potential lack of depth, inability to establish cause-and-effect relationships, and susceptibility to bias.
Frequently asked questions
When should researchers conduct descriptive research.
Descriptive research is most appropriate when researchers aim to portray and understand the characteristics of a phenomenon without manipulating variables. It is particularly valuable in the early stages of a study.
What is the difference between descriptive and exploratory research?
Descriptive research focuses on providing a detailed depiction of a phenomenon, while exploratory research aims to explore and generate insights into an issue where little is known.
What is the difference between descriptive and experimental research?
Descriptive research observes and documents without manipulating variables, whereas experimental research involves intentional interventions to establish cause-and-effect relationships.
Is descriptive research only for social sciences?
No, various descriptive research types may be applicable to all fields of study, including social science, humanities, physical science, and biological science.
How important is descriptive research?
The importance of descriptive research lies in its ability to provide a glimpse of the current state of a phenomenon, offering valuable insights and establishing a basic understanding. Further, the advantages of descriptive research include its capacity to offer a straightforward depiction of a situation or phenomenon, facilitate the identification of patterns or trends, and serve as a useful starting point for more in-depth investigations. Additionally, descriptive research can contribute to the development of hypotheses and guide the formulation of research questions for subsequent studies.
Researcher.Life is a subscription-based platform that unifies top AI tools and services designed to speed up, simplify, and streamline a researcher’s journey, from reading to writing, submission, promotion and more. Based on over 20 years of experience in academia, Researcher.Life empowers researchers to put their best research forward and move closer to success.
Try for free or sign up for the Researcher.Life All Access Pack , a one-of-a-kind subscription that unlocks full access to an AI academic writing assistant, literature reading app, journal finder, scientific illustration tool, and exclusive discounts on professional services from Editage. Find the best AI tools a researcher needs, all in one place – Get All Access now for prices starting at just $17 a month !
Related Posts

What is a Case Study in Research? Definition, Methods, and Examples

How to Write an Academic Biography
Root out friction in every digital experience, super-charge conversion rates, and optimize digital self-service
Uncover insights from any interaction, deliver AI-powered agent coaching, and reduce cost to serve
Increase revenue and loyalty with real-time insights and recommendations delivered to teams on the ground
Know how your people feel and empower managers to improve employee engagement, productivity, and retention
Take action in the moments that matter most along the employee journey and drive bottom line growth
Whatever they’re are saying, wherever they’re saying it, know exactly what’s going on with your people
Get faster, richer insights with qual and quant tools that make powerful market research available to everyone
Run concept tests, pricing studies, prototyping + more with fast, powerful studies designed by UX research experts
Track your brand performance 24/7 and act quickly to respond to opportunities and challenges in your market
Explore the platform powering Experience Management
- Free Account
- Product Demos
- For Digital
- For Customer Care
- For Human Resources
- For Researchers
- Financial Services
- All Industries
Popular Use Cases
- Customer Experience
- Employee Experience
- Net Promoter Score
- Voice of Customer
- Customer Success Hub
- Product Documentation
- Training & Certification
- XM Institute
- Popular Resources
- Customer Stories
- Artificial Intelligence
Market Research
- Partnerships
- Marketplace
The annual gathering of the experience leaders at the world’s iconic brands building breakthrough business results, live in Salt Lake City.
- English/AU & NZ
- Español/Europa
- Español/América Latina
- Português Brasileiro
- REQUEST DEMO
- Experience Management
- Descriptive Research
Try Qualtrics for free
Descriptive research: what it is and how to use it.
8 min read Understanding the who, what and where of a situation or target group is an essential part of effective research and making informed business decisions.
For example you might want to understand what percentage of CEOs have a bachelor’s degree or higher. Or you might want to understand what percentage of low income families receive government support – or what kind of support they receive.
Descriptive research is what will be used in these types of studies.
In this guide we’ll look through the main issues relating to descriptive research to give you a better understanding of what it is, and how and why you can use it.
Free eBook: 2024 global market research trends report
What is descriptive research?
Descriptive research is a research method used to try and determine the characteristics of a population or particular phenomenon.
Using descriptive research you can identify patterns in the characteristics of a group to essentially establish everything you need to understand apart from why something has happened.
Market researchers use descriptive research for a range of commercial purposes to guide key decisions.
For example you could use descriptive research to understand fashion trends in a given city when planning your clothing collection for the year. Using descriptive research you can conduct in depth analysis on the demographic makeup of your target area and use the data analysis to establish buying patterns.
Conducting descriptive research wouldn’t, however, tell you why shoppers are buying a particular type of fashion item.
Descriptive research design
Descriptive research design uses a range of both qualitative research and quantitative data (although quantitative research is the primary research method) to gather information to make accurate predictions about a particular problem or hypothesis.
As a survey method, descriptive research designs will help researchers identify characteristics in their target market or particular population.
These characteristics in the population sample can be identified, observed and measured to guide decisions.
Descriptive research characteristics
While there are a number of descriptive research methods you can deploy for data collection, descriptive research does have a number of predictable characteristics.
Here are a few of the things to consider:
Measure data trends with statistical outcomes
Descriptive research is often popular for survey research because it generates answers in a statistical form, which makes it easy for researchers to carry out a simple statistical analysis to interpret what the data is saying.
Descriptive research design is ideal for further research
Because the data collection for descriptive research produces statistical outcomes, it can also be used as secondary data for another research study.
Plus, the data collected from descriptive research can be subjected to other types of data analysis .
Uncontrolled variables
A key component of the descriptive research method is that it uses random variables that are not controlled by the researchers. This is because descriptive research aims to understand the natural behavior of the research subject.
It’s carried out in a natural environment
Descriptive research is often carried out in a natural environment. This is because researchers aim to gather data in a natural setting to avoid swaying respondents.
Data can be gathered using survey questions or online surveys.
For example, if you want to understand the fashion trends we mentioned earlier, you would set up a study in which a researcher observes people in the respondent’s natural environment to understand their habits and preferences.
Descriptive research allows for cross sectional study
Because of the nature of descriptive research design and the randomness of the sample group being observed, descriptive research is ideal for cross sectional studies – essentially the demographics of the group can vary widely and your aim is to gain insights from within the group.
This can be highly beneficial when you’re looking to understand the behaviors or preferences of a wider population.
Descriptive research advantages
There are many advantages to using descriptive research, some of them include:
Cost effectiveness
Because the elements needed for descriptive research design are not specific or highly targeted (and occur within the respondent’s natural environment) this type of study is relatively cheap to carry out.
Multiple types of data can be collected
A big advantage of this research type, is that you can use it to collect both quantitative and qualitative data. This means you can use the stats gathered to easily identify underlying patterns in your respondents’ behavior.
Descriptive research disadvantages
Potential reliability issues.
When conducting descriptive research it’s important that the initial survey questions are properly formulated.
If not, it could make the answers unreliable and risk the credibility of your study.
Potential limitations
As we’ve mentioned, descriptive research design is ideal for understanding the what, who or where of a situation or phenomenon.
However, it can’t help you understand the cause or effect of the behavior. This means you’ll need to conduct further research to get a more complete picture of a situation.
Descriptive research methods
Because descriptive research methods include a range of quantitative and qualitative research, there are several research methods you can use.
Use case studies
Case studies in descriptive research involve conducting in-depth and detailed studies in which researchers get a specific person or case to answer questions.
Case studies shouldn’t be used to generate results, rather it should be used to build or establish hypothesis that you can expand into further market research .
For example you could gather detailed data about a specific business phenomenon, and then use this deeper understanding of that specific case.
Use observational methods
This type of study uses qualitative observations to understand human behavior within a particular group.
By understanding how the different demographics respond within your sample you can identify patterns and trends.
As an observational method, descriptive research will not tell you the cause of any particular behaviors, but that could be established with further research.
Use survey research
Surveys are one of the most cost effective ways to gather descriptive data.
An online survey or questionnaire can be used in descriptive studies to gather quantitative information about a particular problem.
Survey research is ideal if you’re using descriptive research as your primary research.
Descriptive research examples
Descriptive research is used for a number of commercial purposes or when organizations need to understand the behaviors or opinions of a population.
One of the biggest examples of descriptive research that is used in every democratic country, is during elections.
Using descriptive research, researchers will use surveys to understand who voters are more likely to choose out of the parties or candidates available.
Using the data provided, researchers can analyze the data to understand what the election result will be.
In a commercial setting, retailers often use descriptive research to figure out trends in shopping and buying decisions.
By gathering information on the habits of shoppers, retailers can get a better understanding of the purchases being made.
Another example that is widely used around the world, is the national census that takes place to understand the population.
The research will provide a more accurate picture of a population’s demographic makeup and help to understand changes over time in areas like population age, health and education level.
Where Qualtrics helps with descriptive research
Whatever type of research you want to carry out, there’s a survey type that will work.
Qualtrics can help you determine the appropriate method and ensure you design a study that will deliver the insights you need.
Our experts can help you with your market research needs , ensuring you get the most out of Qualtrics market research software to design, launch and analyze your data to guide better, more accurate decisions for your organization.
Related resources
Market intelligence 10 min read, marketing insights 11 min read, ethnographic research 11 min read, qualitative vs quantitative research 13 min read, qualitative research questions 11 min read, qualitative research design 12 min read, primary vs secondary research 14 min read, request demo.
Ready to learn more about Qualtrics?
Have a language expert improve your writing
Run a free plagiarism check in 10 minutes, automatically generate references for free.
- Knowledge Base
- Methodology
- Descriptive Research Design | Definition, Methods & Examples
Descriptive Research Design | Definition, Methods & Examples
Published on 5 May 2022 by Shona McCombes . Revised on 10 October 2022.
Descriptive research aims to accurately and systematically describe a population, situation or phenomenon. It can answer what , where , when , and how questions , but not why questions.
A descriptive research design can use a wide variety of research methods to investigate one or more variables . Unlike in experimental research , the researcher does not control or manipulate any of the variables, but only observes and measures them.
Table of contents
When to use a descriptive research design, descriptive research methods.
Descriptive research is an appropriate choice when the research aim is to identify characteristics, frequencies, trends, and categories.
It is useful when not much is known yet about the topic or problem. Before you can research why something happens, you need to understand how, when, and where it happens.
- How has the London housing market changed over the past 20 years?
- Do customers of company X prefer product Y or product Z?
- What are the main genetic, behavioural, and morphological differences between European wildcats and domestic cats?
- What are the most popular online news sources among under-18s?
- How prevalent is disease A in population B?
Prevent plagiarism, run a free check.
Descriptive research is usually defined as a type of quantitative research , though qualitative research can also be used for descriptive purposes. The research design should be carefully developed to ensure that the results are valid and reliable .
Survey research allows you to gather large volumes of data that can be analysed for frequencies, averages, and patterns. Common uses of surveys include:
- Describing the demographics of a country or region
- Gauging public opinion on political and social topics
- Evaluating satisfaction with a company’s products or an organisation’s services
Observations
Observations allow you to gather data on behaviours and phenomena without having to rely on the honesty and accuracy of respondents. This method is often used by psychological, social, and market researchers to understand how people act in real-life situations.
Observation of physical entities and phenomena is also an important part of research in the natural sciences. Before you can develop testable hypotheses , models, or theories, it’s necessary to observe and systematically describe the subject under investigation.
Case studies
A case study can be used to describe the characteristics of a specific subject (such as a person, group, event, or organisation). Instead of gathering a large volume of data to identify patterns across time or location, case studies gather detailed data to identify the characteristics of a narrowly defined subject.
Rather than aiming to describe generalisable facts, case studies often focus on unusual or interesting cases that challenge assumptions, add complexity, or reveal something new about a research problem .
Cite this Scribbr article
If you want to cite this source, you can copy and paste the citation or click the ‘Cite this Scribbr article’ button to automatically add the citation to our free Reference Generator.
McCombes, S. (2022, October 10). Descriptive Research Design | Definition, Methods & Examples. Scribbr. Retrieved 2 July 2024, from https://www.scribbr.co.uk/research-methods/descriptive-research-design/
Is this article helpful?

Shona McCombes
Other students also liked, a quick guide to experimental design | 5 steps & examples, correlational research | guide, design & examples, qualitative vs quantitative research | examples & methods.
Descriptive research
Published November 26, 2021. Updated December 14, 2021.
Descriptive research is a research method popular in the social sciences that focuses on answering questions based on the “what” rather than the “why” of a subject. The primary aim of descriptive research is to explain the characteristics of demographic(s) under observational study.
Descriptive research is referred to as observational research because no variables are altered during the study. Descriptive research is also useful in cases where it is impossible to test or record quantitative data for a large sample population.
Descriptive research can involve market research studies based on quantitative variables.
Examples of descriptive research:
Example 1 : A brand based in country “X” wants to establish itself in country “Y”. It first needs to understand the demographics of the buyers from country “Y,” such as who generally buys similar products from similar brands. The company performs a market research study to better understand the population demographics and retail patterns of citizens within country “Y”. The study does not explain why certain retail patterns exists, but instead focuses on identifying these patterns of the target population.
Example 2: A school district wants to analyze the approach of teachers towards technology in the classroom. A survey is conducted to observe the comfort and behavior of teachers in using technology within a subset of classrooms. The information gathered from the survey is then used to understand whether the implementation of technology across all classrooms is feasible. This descriptive research approach can also help understand any impact these changes may have on the students of the school.
Characteristics of descriptive research
Descriptive research has several characteristics. These include:
- Nature of variables: The variables are not manipulated or affected in any way in the case of descriptive research. Thus, a researcher cannot change or control the behavior of the variables that are under observation.
- Directs future research: Descriptive research identifies patterns between variables, allowing researchers to further study why such patterns exist and the relationship between them.
- Quantitative and qualitative research: The nature of descriptive research can be quantitative (collecting data and performing statistical analyses to gain conclusions) or qualitative (observing subjects).
Methods of descriptive research
There are three methods by which descriptive research can be conducted:

- The survey method includes documentation of answers through surveys or polls. It is the most common form of collecting market research data, which in this case is the feedback from the participants in the survey. Good descriptive research should include questionnaires that are both closed- and open-ended. The advantage of the survey method is that participants can access it either offline or online, allowing the collection of data at a larger scale in a limited time span.
- The observational method can be quantitative or qualitative. In quantitative observation, the collected data is in numerical form; in qualitative observation, the collected data is based on observations of participants’ reactions in different situations and asking clarifying questions. Quantitative observations involve the statistical analysis of survey data, while qualitative observations monitor behaviors in a situation.
- The case study method includes an in-depth study of the research subject and leads to hypothesis development. There are two limitations to this method:
- It does not allow the researcher to make accurate predictions or create a cause-effect conclusion.
- An atypical respondent can be included in the research study. This is defined as someone who differs from the average participants within a study. If any decision is made based on that candidate for the entire sample size, it may affect the study’s validity.
Advantages and disadvantages of descriptive research
Descriptive research has many advantages such as:
- Data collection: Descriptive research involves multiple data collection research methods where data can be qualitative or quantitative. The obtained data is therefore diverse, flexible, and thorough.
- Primary data: The primary data collection methods for descriptive research are surveys, observational research, and case studies. These methods result in information that can be used to develop hypotheses for future research.
- Natural environment: The research subject is observed in a natural environment. This ensures the collection of honest, accurate, and high-quality data.
- Cost-effective: It is a cost-effective method, and the data can be collected online or offline at a larger scale with less time.
Descriptive research has a few disadvantages such as:
- Biases in studies: The opinions of the researcher can be biased and affect the study (referred to as an “experimenter effect”).
- Limited scope: Descriptive research focuses on the “what” of the subject and does not seek to explain the “why”.
- Representative issues: Descriptive research can be applied to a larger population, but it may not represent the whole population when a smaller sample size is targeted.
- Misleading information: Study participants can provide incorrect or misleading responses, especially during questions of intimate matters. Participants can also be untruthful while providing responses or can be affected due to the presence of the observer (referred to as an “observer effect”) while completing a survey.
Key takeaways
- Descriptive research is a research method that includes describing and observing the nature of a subject without affecting it in any way.
- Characteristics of descriptive research include the nature of variables, quantitative/qualitative research, and future research prospective.
- The three methods of descriptive research are survey, observational, and case study.
- The advantages of descriptive research are that it can be qualitative or quantitative, provide rich information, observation of subject in natural environment, and it is cost-effective.
- The disadvantages of descriptive research are that it can be biased, provide misleading information, and/or have representative issues and limited scope.
Research Design
For more details, visit these additional research guides .
Research Variables
- Research design
- Research bias
- Type of variables
- Independent variable in research
- Dependent variables in research
- Confounding variables
- Control variables
- Extraneous variables
Experimental and Other Research Design
- Experimental research
- True experimental design
- Quasi-experimental design
- Double-blind experiment
- Between subject design
- Within subject design
- Case study research design
- Descriptive research design
- Longitudinal study
- Cross-sectional design
- Survey design
- Naturalistic observation
- Survey response scales
- Control group in science
- Null hypothesis

What’s included with a Chegg Writing subscription
- Unlimited number of paper scans
- Plagiarism detection: Check against billions of sources
- Expert proofreading for papers on any subject
- Grammar scans for 200+ types of common errors
- Automatically create & save citations in 7,000+ styles
- Cancel subscription anytime, no obligation
Want to create or adapt books like this? Learn more about how Pressbooks supports open publishing practices.
Chapter 5: Qualitative descriptive research
Darshini Ayton
Learning outcomes
Upon completion of this chapter, you should be able to:
- Identify the key terms and concepts used in qualitative descriptive research.
- Discuss the advantages and disadvantages of qualitative descriptive research.
What is a qualitative descriptive study?
The key concept of the qualitative descriptive study is description.
Qualitative descriptive studies (also known as ‘exploratory studies’ and ‘qualitative description approaches’) are relatively new in the qualitative research landscape. They emerged predominantly in the field of nursing and midwifery over the past two decades. 1 The design of qualitative descriptive studies evolved as a means to define aspects of qualitative research that did not resemble qualitative research designs to date, despite including elements of those other study designs. 2
Qualitative descriptive studies describe phenomena rather than explain them. Phenomenological studies, ethnographic studies and those using grounded theory seek to explain a phenomenon. Qualitative descriptive studies aim to provide a comprehensive summary of events. The approach to this study design is journalistic, with the aim being to answer the questions who, what, where and how. 3
A qualitative descriptive study is an important and appropriate design for research questions that are focused on gaining insights about a poorly understood research area, rather than on a specific phenomenon. Since qualitative descriptive study design seeks to describe rather than explain, explanatory frameworks and theories are not required to explain or ‘ground’ a study and its results. 4 The researcher may decide that a framework or theory adds value to their interpretations, and in that case, it is perfectly acceptable to use them. However, the hallmark of genuine curiosity (naturalistic enquiry) is that the researcher does not know in advance what they will be observing or describing. 4 Because a phenomenon is being described, the qualitative descriptive analysis is more categorical and less conceptual than other methods. Qualitative content analysis is usually the main approach to data analysis in qualitative descriptive studies. 4 This has led to criticism of descriptive research being less sophisticated because less interpretation is required than with other qualitative study designs in which interpretation and explanation are key characteristics (e.g. phenomenology, grounded theory, case studies).
Diverse approaches to data collection can be utilised in qualitative description studies. However, most qualitative descriptive studies use semi-structured interviews (see Chapter 13) because they provide a reliable way to collect data. 3 The technique applied to data analysis is generally categorical and less conceptual when compared to other qualitative research designs (see Section 4). 2,3 Hence, this study design is well suited to research by practitioners, student researchers and policymakers. Its straightforward approach enables these studies to be conducted in shorter timeframes than other study designs. 3 Descriptive studies are common as the qualitative component in mixed-methods research ( see Chapter 11 ) and evaluations ( see Chapter 12 ), 1 because qualitative descriptive studies can provide information to help develop and refine questionnaires or interventions.
For example, in our research to develop a patient-reported outcome measure for people who had undergone a percutaneous coronary intervention (PCI), which is a common cardiac procedure to treat heart disease, we started by conducting a qualitative descriptive study. 5 This project was a large, mixed-methods study funded by a private health insurer. The entire research process needed to be straightforward and achievable within a year, as we had engaged an undergraduate student to undertake the research tasks. The aim of the qualitative component of the mixed-methods study was to identify and explore patients’ perceptions following PCI. We used inductive approaches to collect and analyse the data. The study was guided by the following domains for the development of patient-reported outcomes, according to US Food and Drug Administration (FDA) guidelines, which included:
- Feeling: How the patient feels physically and psychologically after medical intervention
- Function: The patient’s mobility and ability to maintain their regular routine
- Evaluation: The patient’s overall perception of the success or failure of their procedure and their perception of what contributed to it. 5(p458)
We conducted focus groups and interviews, and asked participants three questions related to the FDA outcome domains:
- From your perspective, what would be considered a successful outcome of the procedure?
Probing questions: Did the procedure meet your expectations? How do you define whether the procedure was successful?
- How did you feel after the procedure?
Probing question: How did you feel one week after and how does that compare with how you feel now?
- After your procedure, tell me about your ability to do your daily activities?
Prompt for activities including gardening, housework, personal care, work-related and family-related tasks.
Probing questions: Did you attend cardiac rehabilitation? Can you tell us about your experience of cardiac rehabilitation? What impact has medication had on your recovery?
- What, if any, lifestyle changes have you made since your procedure? 5(p459)
Data collection was conducted with 32 participants. The themes were mapped to the FDA patient-reported outcome domains, with the results confirming previous research and also highlighting new areas for exploration in the development of a new patient-reported outcome measure. For example, participants reported a lack of confidence following PCI and the importance of patient and doctor communication. Women, in particular, reported that they wanted doctors to recognise how their experiences of cardiac symptoms were different to those of men.
The study described phenomena and resulted in the development of a patient-reported outcome measure that was tested and refined using a discrete-choice experiment survey, 6 a pilot of the measure in the Victorian Cardiac Outcomes Registry and a Rasch analysis to validate the measurement’s properties. 7
Advantages and disadvantages of qualitative descriptive studies
A qualitative descriptive study is an effective design for research by practitioners, policymakers and students, due to their relatively short timeframes and low costs. The researchers can remain close to the data and the events described, and this can enable the process of analysis to be relatively simple. Qualitative descriptive studies are also useful in mixed-methods research studies. Some of the advantages of qualitative descriptive studies have led to criticism of the design approach, due to a lack of engagement with theory and the lack of interpretation and explanation of the data. 2
Table 5.1. Examples of qualitative descriptive studies
| Hiller, 2021 | Backman, 2019 | |
| 'To explore the experiences of these young people within the care system, particularly in relation to support-seeking and coping with emotional needs, to better understand feasible and acceptable ways to improve outcomes for these young people.' [abstract] | 'To describe patients’ and informal caregivers’ perspectives on how to improve and monitor care during transitions from hospital to home in Ottawa Canada' [abstract] | |
| '1) where do young people in care seek support for emotional difficulties, both in terms of social support and professional services?(2) what do they view as barriers to seeking help? and(3) what coping strategies do they use when experiencing emotional difficulties?' | Not stated | |
| Young people in out-of-home care represent an under-researched group. A qualitative descriptive approach enabled exploration of their views, coping and wellbeing to inform approaches to improve formal and informal support. | Part of a larger study that aimed to prioritise components that most influence the development of successful interventions in care transition. | |
| Two local authorities in England | Canada | |
| Opportunity sampling was used used to invite participants from a large quantitative study to participate in an interview.Semi-structured interviews with 25 young people. | Semi-structured telephone interviews with 8 participants (2 patients; 6 family members) recruited by convenience sampling. Interviews ranged from 45–60 minutes were audio recorded. | |
| Reflexive thematic analysis | Thematic analysis | |
| Broader experience of being in careCentrality of social support to wellbeing, and mixed views on professional helpUse of both adaptive and maladaptive day-to-day coping strategies | Need for effective communication between providers and patients or informal caregiversNeed for improving key aspects of the discharge processIncreasing patient and family involvementSuggestions on how to best monitor care transitions |
Qualitative descriptive studies are gaining popularity in health and social care due to their utility, from a resource and time perspective, for research by practitioners, policymakers and researchers. Descriptive studies can be conducted as stand-alone studies or as part of larger, mixed-methods studies.
- Bradshaw C, Atkinson S, Doody O. Employing a qualitative description approach in health care research. Glob Qual Nurs Res. 2017;4. doi:10.1177/2333393617742282
- Lambert VA, Lambert CE. Qualitative descriptive research: an acceptable design. Pac Rim Int J Nurs Res Thail. 2012;16(4):255-256. Accessed June 6, 2023. https://he02.tci-thaijo.org/index.php/PRIJNR/article/download/5805/5064
- Doyle L et al. An overview of the qualitative descriptive design within nursing research. J Res Nurs. 2020;25(5):443-455. doi:10.1177/174498711988023
- Kim H, Sefcik JS, Bradway C. Characteristics of qualitative descriptive studies: a systematic review. Res Nurs Health. 2017;40(1):23-42. doi:10.1002/nur.21768
- Ayton DR et al. Exploring patient-reported outcomes following percutaneous coronary intervention: a qualitative study. Health Expect. 2018;21(2):457-465. doi:10.1111/hex.1263
- Barker AL et al. Symptoms and feelings valued by patients after a percutaneous coronary intervention: a discrete-choice experiment to inform development of a new patient-reported outcome. BMJ Open. 2018;8:e023141. doi:10.1136/bmjopen-2018-023141
- Soh SE et al. What matters most to patients following percutaneous coronary interventions? a new patient-reported outcome measure developed using Rasch analysis. PLoS One. 2019;14(9):e0222185. doi:10.1371/journal.pone.0222185
- Hiller RM et al. Coping and support-seeking in out-of-home care: a qualitative study of the views of young people in care in England. BMJ Open. 2021;11:e038461. doi:10.1136/bmjopen-2020-038461
- Backman C, Cho-Young D. Engaging patients and informal caregivers to improve safety and facilitate person- and family-centered care during transitions from hospital to home – a qualitative descriptive study. Patient Prefer Adherence. 2019;13:617-626. doi:10.2147/PPA.S201054
Qualitative Research – a practical guide for health and social care researchers and practitioners Copyright © 2023 by Darshini Ayton is licensed under a Creative Commons Attribution-NonCommercial 4.0 International License , except where otherwise noted.
Share This Book
An official website of the United States government
The .gov means it’s official. Federal government websites often end in .gov or .mil. Before sharing sensitive information, make sure you’re on a federal government site.
The site is secure. The https:// ensures that you are connecting to the official website and that any information you provide is encrypted and transmitted securely.
- Publications
- Account settings
- My Bibliography
- Collections
- Citation manager
Save citation to file
Email citation, add to collections.
- Create a new collection
- Add to an existing collection
Add to My Bibliography
Your saved search, create a file for external citation management software, your rss feed.
- Search in PubMed
- Search in NLM Catalog
- Add to Search
Study designs: Part 2 - Descriptive studies
Affiliations.
- 1 Department of Gastroenterology, Sanjay Gandhi Postgraduate Institute of Medical Sciences, Lucknow, Uttar Pradesh, India.
- 2 Department of Anaesthesiology, Tata Memorial Centre, Mumbai, Maharashtra, India.
- PMID: 30834206
- PMCID: PMC6371702
- DOI: 10.4103/picr.PICR_154_18
One of the first steps in planning a research study is the choice of study design. The available study designs are divided broadly into two types - observational and interventional. Of the various observational study designs, the descriptive design is the simplest. It allows the researcher to study and describe the distribution of one or more variables, without regard to any causal or other hypotheses. This article discusses the subtypes of descriptive study design, and their strengths and limitations.
Keywords: Epidemiologic methods; observational studies; research design.
PubMed Disclaimer
Conflict of interest statement
There are no conflicts of interest.
Similar articles
- Observational and interventional study design types; an overview. Thiese MS. Thiese MS. Biochem Med (Zagreb). 2014;24(2):199-210. doi: 10.11613/BM.2014.022. Epub 2014 Jun 15. Biochem Med (Zagreb). 2014. PMID: 24969913 Free PMC article. Review.
- Research designs and making causal inferences from health care studies. Flannelly KJ, Jankowski KR. Flannelly KJ, et al. J Health Care Chaplain. 2014;20(1):25-38. doi: 10.1080/08854726.2014.871909. J Health Care Chaplain. 2014. PMID: 24579956
- Methods in epidemiology: observational study designs. DiPietro NA. DiPietro NA. Pharmacotherapy. 2010 Oct;30(10):973-84. doi: 10.1592/phco.30.10.973. Pharmacotherapy. 2010. PMID: 20874034 Review.
- Tools of the epidemiologist. Mortimer JA, Borenstein AR. Mortimer JA, et al. Alzheimer Dis Assoc Disord. 2006 Jul-Sep;20(3 Suppl 2):S35-41. doi: 10.1097/00002093-200607001-00004. Alzheimer Dis Assoc Disord. 2006. PMID: 16917193 Review.
- [Analytical epidemiology--case-control and cohort studies]. Jacobsen G. Jacobsen G. Tidsskr Nor Laegeforen. 2002 Nov 10;122(27):2636-40. Tidsskr Nor Laegeforen. 2002. PMID: 12523196 Norwegian.
- Parental experiences of caring for preterm infants in the neonatal intensive care unit, Limpopo Province: a descriptive qualitative study exploring the cultural determinants. Nyaloko MJ, Lubbe W, Moloko-Phiri SS, Shopo KD. Nyaloko MJ, et al. BMC Health Serv Res. 2024 May 28;24(1):669. doi: 10.1186/s12913-024-11117-6. BMC Health Serv Res. 2024. PMID: 38807150 Free PMC article.
- Exploring the Impact of In Basket Metrics on the Adoption of a New Electronic Health Record System Among Specialists in a Tertiary Hospital in Alberta: Descriptive Study. Avdagovska M, Kuziemsky C, Koosha H, Hadizadeh M, Pauly RP, Graham T, Stafinski T, Bigam D, Kassam N, Menon D. Avdagovska M, et al. J Med Internet Res. 2024 Apr 29;26:e53122. doi: 10.2196/53122. J Med Internet Res. 2024. PMID: 38684079 Free PMC article.
- Impact of floral and geographical origins on honey quality parameters in Saudi Arabian regions. Alaerjani WMA, Mohammed MEA. Alaerjani WMA, et al. Sci Rep. 2024 Apr 15;14(1):8720. doi: 10.1038/s41598-024-59359-y. Sci Rep. 2024. PMID: 38622258 Free PMC article.
- Influence of sociodemographic and obstetric factors on maternal mortality in Brazil from 2011 to 2021. Lima Figueiredo ER, do Socorro Carvalho Miranda C, Viana Campos AC, de Campos Gomes F, Câmara Rodrigues CN, de Melo-Neto JS. Lima Figueiredo ER, et al. BMC Womens Health. 2024 Feb 1;24(1):84. doi: 10.1186/s12905-024-02925-3. BMC Womens Health. 2024. PMID: 38302949 Free PMC article.
- Prevalence and factors associated with mental illness symptoms among school students post lockdown of the COVID-19 pandemic in the United Arab Emirates: A cross-sectional national study. Ghader N, AlMheiri N, Fikri A, AbdulRazzak H, Saleheen H, Saddik B, Aljawarneh Y, Dalky H, Al Banna A, Al Memari S, Al Shehhi B, Al Mazrouei S, Al Hajeri O. Ghader N, et al. PLoS One. 2024 Feb 1;19(2):e0296479. doi: 10.1371/journal.pone.0296479. eCollection 2024. PLoS One. 2024. PMID: 38300941 Free PMC article.
- Ranganathan P, Aggarwal R. Study designs: Part 1 – An overview and classification. Perspect Clin Res. 2018;9:184–6. - PMC - PubMed
- Gottlieb GJ, Ragaz A, Vogel JV, Friedman-Kien A, Rywlin AM, Weiner EA, et al. A preliminary communication on extensively disseminated Kaposi's sarcoma in young homosexual men. Am J Dermatopathol. 1981;3:111–4. - PubMed
- Centers for Disease Control (CDC). Pneumocystis pneumonia – Los Angeles. MMWR Morb Mortal Wkly Rep. 30:250–2. - PubMed
- Cheent K, Nolan J, Shariq S, Kiho L, Pal A, Arnold J, et al. Case report: Fatal case of disseminated BCG infection in an infant born to a mother taking infliximab for Crohn's disease. J Crohns Colitis. 2010;4:603–5. - PubMed
- Van Assche G, Van Ranst M, Sciot R, Dubois B, Vermeire S, Noman M, et al. Progressive multifocal leukoencephalopathy after natalizumab therapy for Crohn's disease. N Engl J Med. 2005;353:362–8. - PubMed
LinkOut - more resources
Full text sources.
- Europe PubMed Central
- Medknow Publications and Media Pvt Ltd
- Ovid Technologies, Inc.
- PubMed Central
- Citation Manager
NCBI Literature Resources
MeSH PMC Bookshelf Disclaimer
The PubMed wordmark and PubMed logo are registered trademarks of the U.S. Department of Health and Human Services (HHS). Unauthorized use of these marks is strictly prohibited.

Descriptive Research
Descriptive research can be explained as a statement of affairs as they are at present with the researcher having no control over variable. Moreover, “descriptive studies may be characterised as simply the attempt to determine, describe or identify what is, while analytical research attempts to establish why it is that way or how it came to be” [1] . Three main purposes of descriptive studies can be explained as describing, explaining and validating research findings. This type of research is popular with non-quantified topic.
Descriptive research is “aimed at casting light on current issues or problems through a process of data collection that enables them to describe the situation more completely than was possible without employing this method.” [2] To put it simply, descriptive studies are used to describe various aspects of the phenomenon. In its popular format, descriptive research is used to describe characteristics and/or behaviour of sample population. It is an effective method to get information that can be used to develop hypotheses and propose associations.
Importantly, these types of studies do not focus on reasons for the occurrence of the phenomenon. In other words, descriptive research focuses on the question “What?”, but it is not concerned with the question “Why?”
Descriptive studies have the following characteristics:
1. While descriptive research can employ a number of variables, only one variable is required to conduct a descriptive study.
2. Descriptive studies are closely associated with observational studies, but they are not limited with observation data collection method. Case studies and surveys can also be specified as popular data collection methods used with descriptive studies.
3. Findings of descriptive researches create a scope for further research. When a descriptive study answers to the question “What?”, a further research can be conducted to find an answer to “Why?” question.
Examples of Descriptive Research
Research questions in descriptive studies typically start with ‘What is…”. Examples of research questions in descriptive studies may include the following:
- What are the most effective intangible employee motivation tools in hospitality industry in the 21 st century?
- What is the impact of viral marketing on consumer behaviour in consumer amongst university students in Canada?
- Do corporate leaders of multinational companies in the 21 st century possess moral rights to receive multi-million bonuses?
- What are the main distinctive traits of organisational culture of McDonald’s USA?
- What is the impact of the global financial crisis of 2007 – 2009 on fitness industry in the UK?
Advantages of Descriptive Research
- Effective to analyse non-quantified topics and issues
- The possibility to observe the phenomenon in a completely natural and unchanged natural environment
- The opportunity to integrate the qualitative and quantitative methods of data collection. Accordingly, research findings can be comprehensive.
- Less time-consuming than quantitative experiments
- Practical use of research findings for decision-making
Disadvantages of Descriptive Research
- Descriptive studies cannot test or verify the research problem statistically
- Research results may reflect certain level of bias due to the absence of statistical tests
- The majority of descriptive studies are not ‘repeatable’ due to their observational nature
- Descriptive studies are not helpful in identifying cause behind described phenomenon
My e-book, The Ultimate Guide to Writing a Dissertation in Business Studies: a step by step assistance contains discussions of theory and application of research designs. The e-book also explains all stages of the research process starting from the selection of the research area to writing personal reflection. Important elements of dissertations such as research philosophy , research approach , methods of data collection , data analysis and sampling are explained in this e-book in simple words.
John Dudovskiy

[1] Ethridge, D.E. (2004) “Research Methodology in Applied Economics” John Wiley & Sons, p.24
[2] Fox, W. & Bayat, M.S. (2007) “A Guide to Managing Research” Juta Publications, p.45
- Voxco Online
- Voxco Panel Management
- Voxco Panel Portal
- Voxco Audience
- Voxco Mobile Offline
- Voxco Dialer Cloud
- Voxco Dialer On-premise
- Voxco TCPA Connect
- Voxco Analytics
- Voxco Text & Sentiment Analysis

- 40+ question types
- Drag-and-drop interface
- Skip logic and branching
- Multi-lingual survey
- Text piping
- Question library
- CSS customization
- White-label surveys
- Customizable ‘Thank You’ page
- Customizable survey theme
- Reminder send-outs
- Survey rewards
- Social media
- Website surveys
- Correlation analysis
- Cross-tabulation analysis
- Trend analysis
- Real-time dashboard
- Customizable report
- Email address validation
- Recaptcha validation
- SSL security
Take a peek at our powerful survey features to design surveys that scale discoveries.
Download feature sheet.
- Hospitality
- Financial Services
- Academic Research
- Customer Experience
- Employee Experience
- Product Experience
- Market Research
- Social Research
- Data Analysis
Explore Voxco
Need to map Voxco’s features & offerings? We can help!
Watch a Demo
Download Brochures
Get a Quote
- NPS Calculator
- CES Calculator
- A/B Testing Calculator
- Margin of Error Calculator
- Sample Size Calculator
- CX Strategy & Management Hub
- Market Research Hub
- Patient Experience Hub
- Employee Experience Hub
- NPS Knowledge Hub
- Market Research Guide
- Customer Experience Guide
- The Voxco Guide to Customer Experience
- Survey Research Guides
- Survey Template Library
- Webinars and Events
- Feature Sheets
- Try a sample survey
- Professional services
Find the best customer experience platform
Uncover customer pain points, analyze feedback and run successful CX programs with the best CX platform for your team.
Get the Guide Now

We’ve been avid users of the Voxco platform now for over 20 years. It gives us the flexibility to routinely enhance our survey toolkit and provides our clients with a more robust dataset and story to tell their clients.
VP Innovation & Strategic Partnerships, The Logit Group
- Client Stories
- Voxco Reviews
- Why Voxco Research?
- Careers at Voxco
- Vulnerabilities and Ethical Hacking
Explore Regional Offices
- Survey Software The world’s leading omnichannel survey software
- Online Survey Tools Create sophisticated surveys with ease.
- Mobile Offline Conduct efficient field surveys.
- Text Analysis
- Close The Loop
- Automated Translations
- NPS Dashboard
- CATI Manage high volume phone surveys efficiently
- Cloud/On-premise Dialer TCPA compliant Cloud on-premise dialer
- IVR Survey Software Boost productivity with automated call workflows.
- Analytics Analyze survey data with visual dashboards
- Panel Manager Nurture a loyal community of respondents.
- Survey Portal Best-in-class user friendly survey portal.
- Voxco Audience Conduct targeted sample research in hours.
- Predictive Analytics
- Customer 360
- Customer Loyalty
- Fraud & Risk Management
- AI/ML Enablement Services
- Credit Underwriting

Find the best survey software for you! (Along with a checklist to compare platforms)
Get Buyer’s Guide
- 100+ question types
- SMS surveys
- Banking & Financial Services
- Retail Solution
- Risk Management
- Customer Lifecycle Solutions
- Net Promoter Score
- Customer Behaviour Analytics
- Customer Segmentation
- Data Unification
Explore Voxco
Watch a Demo
Download Brochures
- CX Strategy & Management Hub
- Blogs & White papers
- Case Studies

VP Innovation & Strategic Partnerships, The Logit Group
- Why Voxco Intelligence?
- Our clients
- Client stories
- Featuresheets

Descriptive Research Design
- September 29, 2021
Voxco’s Descriptive Research guide helps uncover the how, when, what, and where questions in a research problem
SHARE THE ARTICLE ON
When conducting a study, researchers generally try to find an explanation for the existence of a phenomenon. They want to understand “why” the phenomenon occurred.
However, before identifying why a phenomenon occurred, it is integral to answer other questions first. You need to have answers to the “what,” “when,” “how,” and “where” before you can understand the “why.” This is where descriptive research comes in.
The descriptive research design involves using a range of qualitative and quantitative research methods to collect data that aids in accurately describing a research problem.
What is Descriptive Research Design?
Descriptive research design is a type of research design that aims to systematically obtain information to describe a phenomenon, situation, or population. More specifically, it helps answer the what, when, where, and how questions regarding the research problem rather than the why.
A researcher can conduct this research using various methodologies. It predominantly employs quantitative data, although qualitative data is sometimes used for descriptive purposes.
It is important to note that in the descriptive research method, the researcher does not control or manipulate any variables, unlike in experimental research. Instead, the variables are only identified, observed, and measured.
Surveys and observation are the most used method to conduct this research design. You can leverage online survey tools or offline survey tools to gather data as per your research objective.
“Relying on Voxco as our survey software provider has proved to be an excellent choice for our business.”
Valeria Tsamis, Managing Director FocusBari
Read how Voxco helped FocusBari gather data in one centralized database.
What are the Characteristics of Descriptive Research Design?
Let’s take a look at the defining characteristics of the descriptive research design:
1. Quantitative in nature
Descriptive research involves the collection of quantifiable and systematic data that can be used for the statistical analysis of the research problem.
2. Uncontrolled variables
One of the most prominent characteristics of descriptive research is that, unlike in experimental research, the variables are not controlled or manipulated. Instead, they are simply identified, observed, and measured.
3. A basis for further research
The data collected in descriptive research provides a base for further research as it helps obtain a comprehensive understanding of the research question so that it can be answered appropriately.
4. Cross-sectional studies
The descriptive research method is generally carried out through cross-sectional studies. A cross-sectional study is a type of observational study that involves gathering information on various variables at the individual level at a given point in time.
Example of Descriptive Research Design
To gain a deeper understanding of the descriptive method of research, let’s consider the following descriptive design research example:
Company XYZ is a girls’ shoe brand catering to girls, specifically between the ages of 4 to 14.
They want to start selling shoes for boys of the same age group as well and therefore want to gather information on the kind of shoes boys want to wear. They decide to conduct market research & choose the observational method to learn about different shoes boys wear nowadays.
Naturalistic observation can be conducted by observing boys’ shoes in schools, malls, playgrounds, and other public spaces.
This will help company XYZ identify the kind of shoe boys wear nowadays so that they can create the kind of products that will appeal to this audience.
Voxco offers a complete suite of tools for market research .
5 MR templates + 3 Insightful guides
Why use Descriptive Research Design?
A descriptive approach to research allows researchers to thoroughly investigate the background of a research problem before further research can be carried out. It can be used in social science research to explore and document the nature and scope of a problem, to identify trends and patterns, and to provide a basis for subsequent research.
The findings of descriptive research can help inform decision-making, policy development, and program planning.
There are many different contexts in which the use of a descriptive research design is beneficial. Here are some important uses of descriptive research design:
1. To measure data trends
The descriptive method of research can be used to measure changes in variables over a period of time, allowing trends to be identified and analyzed.
2. To compare variables
Descriptive research can be used to compare different variables and how different demographics respond to different variables.
3. To define the characteristics of subjects
It can also be used to determine the different characteristics of the subjects. This can include characteristics such as opinions, traits, behavior, etc.
4. To verify or validate existing conditions
Descriptive research can prove to be a useful tool when trying to test the validity of an existing condition as it involves conducting an in-depth analysis of every variable before drawing conclusions.
What Are Some Examples of Descriptive Research Questions?
Here are some examples of descriptive research questions that can be addressed using a descriptive research design include:
- What are the demographic characteristics of a particular population?
- What is the prevalence of a particular health condition or risk factor?
- What are the attitudes and beliefs of a particular group towards a particular issue?
- What are the behaviors and experiences of individuals who have been exposed to a particular intervention or treatment?
What Are the Advantages of Descriptive Research Design?
The following are a few advantages of using a descriptive research design:
1. Multiple methods of data collection
Research can use a wide range of methods for data collection, such as case studies, observational, and survey methods. They can also decide how they want to collect the data, online, offline, or via phone.
2. Fast and cost-effective
As the descriptive research design often employs the use of surveys, data can be collected from a very large sample size quickly and cost-effectively.
Researchers aiming to conduct market research using this research design should leverage integrated market research software . It will enable them to conduct product, customer, brand, and market research using suitable channels.
3. Comprehensive
Descriptive research often uses quantitative and qualitative research in amalgamation, providing a more holistic understanding of the research topic.
4. External validity
Results obtained through the descriptive method of research often have high external validity as research is conducted in the respondent’s natural environment and no variables are manipulated.
Voxco offers easy-to-use online survey tools with robust features to create interactive and engaging surveys.
40+ Question Types, skip-logic, multi-lingual capability, white-label, and more.
What Are the Disadvantages of Descriptive Research Design?
The following are a few disadvantages of using a descriptive research design:
1. Cannot test or verify the research question
The descriptive method of research cannot be used to test or verify the research problem as the data collected does not help explain the cause of the phenomena being studied.
2. Lack of reliability
If the research problem isn’t formulated well, then the data collected may not be entirely reliable. This also makes it more tedious to carry out a credible investigation.
3. Risk of untrue responses
Descriptive research relies on the responses of people, especially when conducted using surveys. There may be instances when people provide false responses, compromising the validity of the data collected and the research results.
4. Risk of sampling error
The descriptive research method generally employs random sampling while selecting a sample group. The randomness may lead to sampling error if the sample group isn’t representative of the larger population. Sampling error would lead to unreliable and inaccurate results.
What Are the Different Methods of Descriptive Research Design?
There are three most important descriptive research design methods:
In survey research, questionnaires or polls are used to collect information on a specific topic from respondents. Surveys should involve a mix of closed-ended and open-ended questions, as both have their own advantages.
Online survey tools allow multiple data collection channels such as email, website, and SMS surveys.
They are also popularly used in market research to collect customer feedback to optimize products and strategies and improve customer experience (CX). Some popular market research surveys are Net Promoter Score® (NPS®) surveys , brand tracking surveys , and conjoint analysis surveys .
2. Case Studies
The case study method involves the in-depth research of individuals or groups of individuals. Case studies involve gathering detailed data on a narrowly defined subject rather than gathering a large volume of data to identify correlations and patterns.
Therefore, this method is often used to describe a specific subject’s different characteristics rather than generalizable facts.
Case studies allow researchers to create hypotheses that can widen the scope of evaluation while studying the phenomenon. However, it is important to note that case studies cannot be used to outline the cause-and-effect relationship between variables as they cannot make accurate predictions due to the risk of researcher bias.
3. Observations method
In this method, researchers observe respondents in their natural environment, from a distance, and therefore do not influence the variables being studied. This allows them to gather information on the behaviors and characteristics being studied without having to rely on respondents for honest and accurate responses.
The observational method is considered the most effective method for carrying out descriptive research. It involves the collection of both qualitative and quantitative data. You can leverage offline survey tools to gather data digitally, even without the Internet.
Quantitative observation should be related to or understood in terms of quantity and can be analyzed with the use of statistical data analysis methods. A few examples of quantitative observations include age, weight, height, etc.
Qualitative observations, on the other hand, involve monitoring variables whose values do not need to be related to numerical measurements.
When employing this research method, the researcher can choose to be a complete observer, an observer as a participant, a participant as an observer, or a full participant.
The observational method is generally used in psychological, social, and market research to obtain data that explains how people behave in real-life settings.
Surveys built with Voxco are intuitive, and customizable, and generate actionable insights
Build surveys with Voxco
What Are the Types of Descriptive Research Design Surveys?
The following are the different types of descriptive survey studies:
1. Census survey
A census survey is a kind of survey where information is gathered from all units of a population. Data collected through a census study is highly generalizable to the population as all or most units of the population are sampled.
2. Sample survey
A sample survey involves gathering information from a small subgroup of the entire population. When selecting a sample, the aim is to select a group of individuals representing the target population so that the data collected can be generalized to the larger population. Sample groups allow research to be conducted in a fast and cost-effective way.
3. Cross-sectional survey
In this type of survey, standardized data is collected from a cross-section of the pre-determined population at a given point in time. There are two main types of cross-sectional surveys ; those with a single variable and those with two or more variables.
4. Longitudinal survey
Longitudinal surveys are used in longitudinal studies where the same variables are observed over a long period of time. This allows researchers to investigate the status of variables at different points in time. There are three main types of longitudinal studies ; trend, panel, and cohort.
5. Comparative survey
Comparative surveys are used to compare the status of two or more variables. The variables are compared using specific criteria that must be delineated as criterion variables.
6. Evaluative survey
An evaluative survey is generally used to evaluate a program, policy, or curriculum. It involves gathering information that can be used to rate the effectiveness and worthwhileness of a program or policy, or institution.
7. Documentary survey
A documentary survey involves gathering and analyzing information using pre-existing data that is already available. This data can be research papers, review articles, books, official records, etc. In documentary studies, the researcher evaluates the available literature on the research topic.
Voxco powers 1B surveys annually and helps 500+ global brands gather data, measure sentiment, uncover insights, and act on them.
Get a personalized demo to see how Voxco can help enhance your research efficiency.
How to Conduct a Descriptive Research Design
Use the following steps to conduct a study using the descriptive method of research:
Step-1: Outline the research objective
The first step is to identify and outline the objectives of your research and then translate these objectives into criteria of investigation. You must clearly identify the different issues and questions in the context of which the knowledge of the situation must be surveyed.
This must be framed in the form of objectives. Once you’ve clearly stated your criteria and objectives, you must also specify the nature of the data that must be gathered.
Step-2: Determine the tools and techniques to be used for data collection
In this step, you must determine the tools you will employ for the data collection process. Some examples of different tools that can be used are interviews, questionnaires, observation schedules, reaction scales, etc.
In this stage, you will have to identify which tools and techniques are relevant and valid to your study. Leverage robust survey software that offers you multiple channels, thus enabling you to utilize various channels to gather insights.
Step-3: Define the target population and sample group
In the fourth step, you will have to outline your target population. The target population is the group of individuals that you are examining in your research study. Additionally, unless you are conducting a census study and collecting data from the entire population, you must select a sample group.
You can also use an audience panel to accelerate your research. A survey panel gives you access to diverse respondents so you can create your ideal panel.
Additional read: Types of sampling methods .
Step-4: Select a method for data collection
In the data collection stage, you must have a clear plan of how your data will be collected. This involves clearly outlining the type of data you require, the tools that will be used to gather it, the level of training required by researchers to collect the data, the time required for data collection and fieldwork, and so on.
As you collect data, keep your research question and objectives in mind and aim to gather authentic and objective data without personal bias.
Step-5: Analyse the data collected
Once you’ve collected your data, you reach the sixth stage of descriptive research: data analysis. In this stage, you will have to evaluate all the data collected from all your different sources, quantify and qualify them, and then categorize them component-wise.
If you are working with quantitative and qualitative data, you must employ a range of different quantitative and qualitative analysis techniques to analyze the data collected.
Leverage survey analytics software that allows you to run statistical analysis and observe data on a live dashboard.
Step-6: Write the report
The final step of survey research involves writing the report. As survey research involves working with extensive data, it is important to keep the focus of the investigation in mind. The report must be precise and objective-oriented.
Why Use Voxco for Descriptive Research Design?
Voxco being an omnichannel survey software , can be a valuable tool in descriptive research design. It can provide its users with a convenient and efficient means of collecting data from a large number of respondents.
It allows researchers to design and distribute surveys to a targeted sample of participants, collect data in a standardized format, and analyze the results.
Here are some ways in which Voxco helps with descriptive research design:
- Customizable surveys: Voxco lets its users design surveys with a range of question types and themes.
- Ease of distribution: With a range of distribution integration, Voxco makes it easy for users to distribute surveys easily via email, SMS, social media, etc. It helps the surveys reach a larger number of respondents.
- Data analysis: Voxco not only helps researchers gather survey data but also analyzes the survey feedback, which allows researchers to get actionable insights on a visual dashboard.
Overall, Voxco survey software is an effective tool for conducting descriptive research design, as it provides a streamlined and efficient way to gather, measure, and analyze survey data.
Wondering what will be the cost of conducting a survey using Voxco?
This sums up our article on descriptive research design. This research method helps uncover the hidden element of a customer’s behavior. It helps you create a foundation for your research by helping you create an outline of your research subject.
Begin your descriptive research with a free step-by-step guide to descriptive research
What is descriptive research?
Descriptive research design is a type of research methodology that researchers mostly use to analyze and document the behaviors and characteristics of a particular group of people. It gives a detailed analysis of a situation to explore the relation between two variables.
What is descriptive research study used for?
A descriptive research study is a type of observational research and is used for exploring and documenting the nature and scope of a problem, identifying its trends and patterns, and providing a basis for subsequent research. The outcome of a descriptive study is helpful in making decisions, developing policies, and planning social programs.
It is primarily concerned with describing the current state of a given phenomenon rather than explaining why it exists or how it came to be.
Why is descriptive research design used?
Descriptive research design can be used for a variety of reasons, including
- To describe and document a phenomenon of a particular population
- To identify patterns and trends
- To generate hypotheses for further research
- To inform decision-making and policy development
What is an example of a descriptive method?
A case study that examines the experiences of a small business run by women can be an example of a descriptive method of research. Let’s
For instance, a researcher may conduct a case study of a small business solely run by women that have successfully implemented sustainable business practices in their food cloth manufacturing business.
The case study could involve interviews with the owners of the business, observation of their business practices, and analysis of their financial data to document the costs and benefits of sustainability initiatives.
The researchers can then use the findings of the case study to provide a detailed account of the business’s approach to sustainability and to identify best practices that could be applied to other businesses.
Net Promoter ® , NPS ® , NPS Prism ® , and the NPS-related emoticons are registered trademarks of Bain & Company, Inc., Satmetrix Systems, Inc., and Fred Reichheld. Net Promoter Score℠ and Net Promoter System℠ are service marks of Bain & Company, Inc., Satmetrix Systems, Inc., and Fred Reichheld.
Explore Voxco Survey Software

+ Omnichannel Survey Software
+ Online Survey Software
+ CATI Survey Software
+ IVR Survey Software
+ Market Research Tool
+ Customer Experience Tool
+ Product Experience Software
+ Enterprise Survey Software

All you need to know about Consumer Research
Consumer Research: Unlocking Customer Insights See what question types are possible with a sample survey! Try a Sample Survey Table of Contents 01 What is
Why Customer Experience Survey Software is crucial for your business?
Why Customer Experience Survey Software is crucial for your business? Try a free Voxco Online sample survey! Unlock your Sample Survey SHARE THE ARTICLE ON

Omnichannel: Concept, methods and tips
Omnichannel: Concept, methods and tips Transform your insight generation process Use our in-depth online survey guide to create an actionable feedback collection survey process. Download
Data Privacy: The Ultimate Guide
Data Privacy: The Ultimate Guide SHARE THE ARTICLE ON Share on facebook Share on twitter Share on linkedin Table of Contents Introduction You’ve probably heard

Is NPS really the best tool for judging customer experience?
Is NPS® really the best tool for judging customer experience? SHARE THE ARTICLE ON Table of Contents Net Promoter Score® or NPS® is a major

Want to reduce Sampling Error? Here’s what you need to know!
Want to reduce Sampling Error? Here’s what you need to know! Try a free Voxco Online sample survey! Unlock your Sample Survey SHARE THE ARTICLE
We use cookies in our website to give you the best browsing experience and to tailor advertising. By continuing to use our website, you give us consent to the use of cookies. Read More
| Name | Domain | Purpose | Expiry | Type |
|---|---|---|---|---|
| hubspotutk | www.voxco.com | HubSpot functional cookie. | 1 year | HTTP |
| lhc_dir_locale | amplifyreach.com | --- | 52 years | --- |
| lhc_dirclass | amplifyreach.com | --- | 52 years | --- |
| Name | Domain | Purpose | Expiry | Type |
|---|---|---|---|---|
| _fbp | www.voxco.com | Facebook Pixel advertising first-party cookie | 3 months | HTTP |
| __hstc | www.voxco.com | Hubspot marketing platform cookie. | 1 year | HTTP |
| __hssrc | www.voxco.com | Hubspot marketing platform cookie. | 52 years | HTTP |
| __hssc | www.voxco.com | Hubspot marketing platform cookie. | Session | HTTP |
| Name | Domain | Purpose | Expiry | Type |
|---|---|---|---|---|
| _gid | www.voxco.com | Google Universal Analytics short-time unique user tracking identifier. | 1 days | HTTP |
| MUID | bing.com | Microsoft User Identifier tracking cookie used by Bing Ads. | 1 year | HTTP |
| MR | bat.bing.com | Microsoft User Identifier tracking cookie used by Bing Ads. | 7 days | HTTP |
| IDE | doubleclick.net | Google advertising cookie used for user tracking and ad targeting purposes. | 2 years | HTTP |
| _vwo_uuid_v2 | www.voxco.com | Generic Visual Website Optimizer (VWO) user tracking cookie. | 1 year | HTTP |
| _vis_opt_s | www.voxco.com | Generic Visual Website Optimizer (VWO) user tracking cookie that detects if the user is new or returning to a particular campaign. | 3 months | HTTP |
| _vis_opt_test_cookie | www.voxco.com | A session (temporary) cookie used by Generic Visual Website Optimizer (VWO) to detect if the cookies are enabled on the browser of the user or not. | 52 years | HTTP |
| _ga | www.voxco.com | Google Universal Analytics long-time unique user tracking identifier. | 2 years | HTTP |
| _uetsid | www.voxco.com | Microsoft Bing Ads Universal Event Tracking (UET) tracking cookie. | 1 days | HTTP |
| vuid | vimeo.com | Vimeo tracking cookie | 2 years | HTTP |
| Name | Domain | Purpose | Expiry | Type |
|---|---|---|---|---|
| __cf_bm | hubspot.com | Generic CloudFlare functional cookie. | Session | HTTP |
| Name | Domain | Purpose | Expiry | Type |
|---|---|---|---|---|
| _gcl_au | www.voxco.com | --- | 3 months | --- |
| _gat_gtag_UA_3262734_1 | www.voxco.com | --- | Session | --- |
| _clck | www.voxco.com | --- | 1 year | --- |
| _ga_HNFQQ528PZ | www.voxco.com | --- | 2 years | --- |
| _clsk | www.voxco.com | --- | 1 days | --- |
| visitor_id18452 | pardot.com | --- | 10 years | --- |
| visitor_id18452-hash | pardot.com | --- | 10 years | --- |
| lpv18452 | pi.pardot.com | --- | Session | --- |
| lhc_per | www.voxco.com | --- | 6 months | --- |
| _uetvid | www.voxco.com | --- | 1 year | --- |
Looking for the best research tools?
Voxco offers the best online & offline survey research tools!
Want to create or adapt books like this? Learn more about how Pressbooks supports open publishing practices.
2.2 Research Designs in Psychology
Learning objectives.
- Differentiate the goals of descriptive, correlational, and experimental research designs, and explain the advantages and disadvantages of each.
Psychologists agree that if their ideas and theories about human behaviour are to be taken seriously, they must be backed up by data. Researchers have a variety of research designs available to them in testing their predictions. A research design is the specific method a researcher uses to collect, analyze, and interpret data. Psychologists use three major types of research designs in their research, and each provides an essential avenue for scientific investigation. Descriptive research is designed to provide a snapshot of the current state of affairs. Correlational research is designed to discover relationships among variables. Experimental research is designed to assess cause and effect. Each of the three research designs has specific strengths and limitations, and it is important to understand how each differs. See the table below for a summary.
| Research Design | Goal | Advantages | Disadvantages |
|---|---|---|---|
| Descriptive | To create a snapshot of the current state of affairs. | Provides a relatively complete picture of what is occurring at a given time. Allows the development of questions for further study. | Does not assess relationships among variables. Cannot be used to draw inferences about cause and effect. |
| Correlational | To assess the relationships between and among two or more variables. | Allows testing of expected relationships between and among variables and the making of predictions. Can assess these relationships in everyday life events. | Cannot be used to draw inferences about cause and effect. |
| Experimental | To assess the causal impact of one or more experimental manipulations on a dependent variable. | Allows conclusions to be drawn about the causal relationships among variables. | Cannot experimentally manipulate many important variables. May be expensive and time-consuming. |
| Data source: Stangor, 2011. | |||
Descriptive research: Assessing the current state of affairs
Descriptive research is designed to create a snapshot of the current thoughts, feelings, or behaviour of individuals. This section reviews four types of descriptive research: case studies, surveys and tests, naturalistic observation, and laboratory observation.
Sometimes the data in a descriptive research project are collected from only a small set of individuals, often only one person or a single small group. These research designs are known as case studies , which are descriptive records of one or more individual’s experiences and behaviour. Sometimes case studies involve ordinary individuals, as when developmental psychologist Jean Piaget used his observation of his own children to develop his stage theory of cognitive development. More frequently, case studies are conducted on individuals who have unusual or abnormal experiences or characteristics, this may include those who find themselves in particularly difficult or stressful situations. The assumption is that carefully studying individuals can give us results that tell us something about human nature. Of course, one individual cannot necessarily represent a larger group of people who were in the same circumstances.
Sigmund Freud was a master of using the psychological difficulties of individuals to draw conclusions about basic psychological processes. Freud wrote case studies of some of his most interesting patients and used these careful examinations to develop his important theories of personality. One classic example is Freud’s description of “Little Hans,” a child whose fear of horses was interpreted in terms of repressed sexual impulses and the Oedipus complex (Freud, 1909/1964).
Another well-known case study is of Phineas Gage, a man whose thoughts and emotions were extensively studied by cognitive psychologists after a railroad spike was blasted through his skull in an accident. Although there are questions about the interpretation of this case study (Kotowicz, 2007), it did provide early evidence that the brain’s frontal lobe is involved in emotion and morality (Damasio et al., 2005). An interesting example of a case study in clinical psychology is described by Milton Rokeach (1964), who investigated in detail the beliefs of and interactions among three patients with schizophrenia, all of whom were convinced they were Jesus Christ.
Research using case studies has some unique challenges when it comes to interpreting the data. By definition, case studies are based on one or a very small number of individuals. While their situations may be unique, we cannot know how well they represent what would be found in other cases. Furthermore, the information obtained in a case study may be inaccurate or incomplete. While researchers do their best to objectively understand one case, making any generalizations to other people is problematic. Researchers can usually only speculate about cause and effect, and even then, they must do so with great caution. Case studies are particularly useful when researchers are starting out to study something about which there is not much research or as a source for generating hypotheses that can be tested using other research designs.
In other cases, the data from descriptive research projects come in the form of a survey , which is a measure administered through either an interview or a written questionnaire to get a picture of the beliefs or behaviours of a sample of people of interest. The people chosen to participate in the research, known as the sample , are selected to be representative of all the people that the researcher wishes to know about, known as the population . The representativeness of samples is enormously important. For example, a representative sample of Canadians must reflect Canada’s demographic make-up in terms of age, sex, gender orientation, socioeconomic status, ethnicity, and so on. Research based on unrepresentative samples is limited in generalizability , meaning it will not apply well to anyone who was not represented in the sample. Psychologists use surveys to measure a wide variety of behaviours, attitudes, opinions, and facts. Surveys could be used to measure the amount of exercise people get every week, eating or drinking habits, attitudes towards climate change, and so on. These days, many surveys are available online, and they tend to be aimed at a wide audience. Statistics Canada is a rich source of surveys of Canadians on a diverse array of topics. Their databases are searchable and downloadable, and many deal with topics of interest to psychologists, such as mental health, wellness, and so on. Their raw data may be used by psychologists who are able to take advantage of the fact that the data have already been collected. This is called archival research .
Related to surveys are psychological tests . These are measures developed by psychologists to assess one’s score on a psychological construct, such as extroversion, self-esteem, or aptitude for a particular career. The difference between surveys and tests is really down to what is being measured, with surveys more likely to be fact-gathering and tests more likely to provide a score on a psychological construct.
As you might imagine, respondents to surveys and psychological tests are not always accurate or truthful in their replies. Respondents may also skew their answers in the direction they think is more socially desirable or in line with what the researcher expects. Sometimes people do not have good insight into their own behaviour and are not accurate in judging themselves. Sometimes tests have built-in social desirability or lie scales that attempt to help researchers understand when someone’s scores might need to be discarded from the research because they are not accurate.
Tests and surveys are only useful if they are valid and reliable . Validity exists when an instrument actually measures what you think it measures (e.g., a test of intelligence that actually measures how many years of education you have lacks validity). Demonstrating the validity of a test or survey is the responsibility of any researcher who uses the instrument. Reliability is a related but different construct; it exists when a test or survey gives the same responses from time to time or in different situations. For example, if you took an intelligence test three times and every time it gave you a different score, that would not be a reliable test. Demonstrating the reliability of tests and surveys is another responsibility of researchers. There are different types of validity and reliability, and there is a branch of psychology devoted to understanding not only how to demonstrate that tests and surveys are valid and reliable, but also how to improve them.
An important criticism of psychological research is its reliance on so-called WEIRD samples (Henrich, Heine, & Norenzayan, 2010). WEIRD stands for Western, educated, industrialized, rich, and democratic. People fitting the WEIRD description have been over-represented in psychological research, while people from poorer, less-educated backgrounds, for example, have participated far less often. This criticism is important because in psychology we may be trying to understand something about people in general. For example, if we want to understand whether early enrichment programs can boost IQ scores later, we need to conduct this research using people from a variety of backgrounds and situations. Most of the world’s population is not WEIRD, so psychologists trying to conduct research that has broad generalizability need to expand their participant pool to include a more representative sample.
Another type of descriptive research is naturalistic observation , which refers to research based on the observation of everyday events. For instance, a developmental psychologist who watches children on a playground and describes what they say to each other while they play is conducting naturalistic observation, as is a biopsychologist who observes animals in their natural habitats. Naturalistic observation is challenging because, in order for it to be accurate, the observer must be effectively invisible. Imagine walking onto a playground, armed with a clipboard and pencil to watch children a few feet away. The presence of an adult may change the way the children behave; if the children know they are being watched, they may not behave in the same ways as they would when no adult is present. Researchers conducting naturalistic observation studies have to find ways to recede into the background so that their presence does not cause the behaviour they are watching to change. They also must find ways to record their observations systematically and completely — not an easy task if you are watching children, for example. As such, it is common to have multiple observers working independently; their combined observations can provide a more accurate record of what occurred.
Sometimes, researchers conducting observational research move out of the natural world and into a laboratory. Laboratory observation allows much more control over the situation and setting in which the participants will be observed. The downside to moving into a laboratory is the potential artificiality of the setting; the participants may not behave the same way in the lab as they would in the natural world, so the behaviour that is observed may not be completely authentic. Consider the researcher who is interested in aggression in children. They might go to a school playground and record what occurs; however, this could be quite time-consuming if the frequency is low or if the children are playing some distance away and their behaviour is difficult to interpret. Instead, the researcher could construct a play setting in a laboratory and attempt to observe aggressive behaviours in this smaller and more controlled context; for instance, they could only provide one highly desirable toy instead of one for each child. What they gain in control, they lose in artificiality. In this example, the possibility for children to act differently in the lab than they would in the real world would create a challenge in interpreting results.
Correlational research: Seeking relationships among variables
In contrast to descriptive research — which is designed primarily to provide a snapshot of behaviour, attitudes, and so on — correlational research involves measuring the relationship between two variables. Variables can be behaviours, attitudes, and so on. Anything that can be measured is a potential variable. The key aspect of correlational research is that the researchers are not asking some of their participants to do one thing and others to do something else; all of the participants are providing scores on the same two variables. Correlational research is not about how an individual scores; rather, it seeks to understand the association between two things in a larger sample of people. The previous comments about the representativeness of the sample all apply in correlational research. Researchers try to find a sample that represents the population of interest.
An example of correlation research would be to measure the association between height and weight. We should expect that there is a relationship because taller people have more mass and therefore should weigh more than short people. We know from observation, however, that there are many tall, thin people just as there are many short, overweight people. In other words, we would expect that in a group of people, height and weight should be systematically related (i.e., correlated), but the degree of relatedness is not expected to be perfect. Imagine we repeated this study with samples representing different populations: elite athletes, women over 50, children under 5, and so on. We might make different predictions about the relationship between height and weight based on the characteristics of the sample. This highlights the importance of obtaining a representative sample.
Psychologists make frequent use of correlational research designs. Examples might be the association between shyness and number of Facebook friends, between age and conservatism, between time spent on social media and grades in school, and so on. Correlational research designs tend to be relatively less expensive because they are time-limited and can often be conducted without much equipment. Online survey platforms have made data collection easier than ever. Some correlational research does not even necessitate collecting data; researchers using archival data sets as described above simply download the raw data from another source. For example, suppose you were interested in whether or not height is related to the number of points scored in hockey players. You could extract data for both variables from nhl.com , the official National Hockey League website, and conduct archival research using the data that have already been collected.
Correlational research designs look for associations between variables. A statistic that measures that association is the correlation coefficient. Correlation coefficients can be either positive or negative, and they range in value from -1.0 through 0 to 1.0. The most common statistical measure is the Pearson correlation coefficient , which is symbolized by the letter r . Positive values of r (e.g., r = .54 or r = .67) indicate that the relationship is positive, whereas negative values of r (e.g., r = –.30 or r = –.72) indicate negative relationships. The closer the coefficient is to -1 or +1, and the further away from zero, the greater the size of the association between the two variables. For instance, r = –.54 is a stronger relationship than r = .30, and r = .72 is a stronger relationship than r = –.57. Correlations of 0 indicate no relationship between the two variables.
Examples of positive correlation coefficients would include those between height and weight, between education and income, and between age and mathematical abilities in children. In each case, people who score higher, or lower, on one of the variables also tend to score higher, or lower, on the other variable. Negative correlations occur when people score high on one variable and low on the other. Examples of negative linear relationships include those between the age of a child and the number of diapers the child uses and between time practising and errors made on a learning task. In these cases, people who score higher on one of the variables tend to score lower on the other variable. Note that the correlation coefficient does not tell you anything about one specific person’s score.
One way of organizing the data from a correlational study with two variables is to graph the values of each of the measured variables using a scatterplot. A scatterplot is a visual image of the relationship between two variables (see Figure 2.3 ). A point is plotted for each individual at the intersection of his or her scores for the two variables. In this example, data extracted from the official National Hockey League (NHL) website of 30 randomly picked hockey players for the 2017/18 season. For each of these players, there is a dot representing player height and number of points (i.e., goals plus assists). The slope or angle of the dotted line through the middle of the scatter tells us something about the strength and direction of the correlation. In this case, the line slopes up slightly to the right, indicating a positive but small correlation. In these NHL players, there is not much of relationship between height and points. The Pearson correlation calculated for this sample is r = 0.14. It is possible that the correlation would be totally different in a different sample of players, such as a greater number, only those who played a full season, only rookies, only forwards, and so on.
For practise constructing and interpreting scatterplots, see the following:
- Interactive Quiz: Positive and Negative Associations in Scatterplots (Khan Academy, 2018)
When the association between the variables on the scatterplot can be easily approximated with a straight line, the variables are said to have a linear relationship . We are only going to consider linear relationships here. Just be aware that some pairs of variables have non-linear relationships, such as the relationship between physiological arousal and performance. Both high and low arousal are associated with sub-optimal performance, shown by a U-shaped scatterplot curve.
The most important limitation of correlational research designs is that they cannot be used to draw conclusions about the causal relationships among the measured variables; in other words, we cannot know what causes what in correlational research. Consider, for instance, a researcher who has hypothesized that viewing violent behaviour will cause increased aggressive play in children. The researcher has collected, from a sample of Grade 4 children, a measure of how many violent television shows each child views during the week as well as a measure of how aggressively each child plays on the school playground. From the data collected, the researcher discovers a positive correlation between the two measured variables.
Although this positive correlation appears to support the researcher’s hypothesis, it cannot be taken to indicate that viewing violent television causes aggressive behaviour. Although the researcher is tempted to assume that viewing violent television causes aggressive play, there are other possibilities. One alternative possibility is that the causal direction is exactly opposite of what has been hypothesized; perhaps children who have behaved aggressively at school are more likely to prefer violent television shows at home.
Still another possible explanation for the observed correlation is that it has been produced by a so-called third variable , one that is not part of the research hypothesis but that causes both of the observed variables and, thus, the correlation between them. In our example, a potential third variable is the discipline style of the children’s parents. Parents who use a harsh and punitive discipline style may allow children to watch violent television and to behave aggressively in comparison to children whose parents use less different types of discipline.
To review, whenever we have a correlation that is not zero, there are three potential pathways of cause and effect that must be acknowledged. The easiest way to practise understanding this challenge is to automatically designate the two variables X and Y. It does not matter which is which. Then, think through any ways in which X might cause Y. Then, flip the direction of cause and effect, and consider how Y might cause X. Finally, and possibly the most challenging, try to think of other variables — let’s call these C — that were not part of the original correlation, which cause both X and Y. Understanding these potential explanations for correlational research is an important aspect of scientific literacy. In the above example, we have shown how X (i.e., viewing violent TV) could cause Y (i.e., aggressive behaviour), how Y could cause X, and how C (i.e., parenting) could cause both X and Y.
Test your understanding with each example below. Find three different interpretations of cause and effect using the procedure outlined above. In each case, identify variables X, Y, and C:
- A positive correlation between dark chocolate consumption and health
- A negative correlation between sleep and smartphone use
- A positive correlation between children’s aggressiveness and time spent playing video games
- A negative association between time spent exercising and consumption of junk food
In sum, correlational research designs have both strengths and limitations. One strength is that they can be used when experimental research is not possible or when fewer resources are available. Correlational designs also have the advantage of allowing the researcher to study behaviour as it occurs in everyday life. We can also use correlational designs to make predictions, such as predicting the success of job trainees based on their test scores during training. They are also excellent sources of suggested avenues for further research, but we cannot use such correlational information to understand cause and effect. For that, researchers rely on experiments.
Experimental research: Understanding the causes of behaviour
The goal of experimental research design is to provide definitive conclusions about the causal relationships among the variables in the research hypothesis. In an experimental research design, there are independent variables and dependent variables. The independent variable is the one manipulated by the researchers so that there is more than one condition. The dependent variable is the outcome or score on the measure of interest that is dependent on the actions of the independent variable. Let’s consider a classic drug study to illustrate the relationship between independent and dependent variables. To begin, a sample of people with a medical condition are randomly assigned to one of two conditions. In one condition, they are given a drug over a period of time. In the other condition, a placebo is given for the same period of time. To be clear, a placebo is a type of medication that looks like the real thing but is actually chemically inert, sometimes referred to as a”sugar pill.” After the testing period, the groups are compared to see if the drug condition shows better improvement in health than the placebo condition.
While the basic design of experiments is quite simple, the success of experimental research rests on meeting a number of criteria. Some important criteria are:
- Participants must be randomly assigned to the conditions so that there are no differences between the groups. In the drug study example, you could not assign the males to the drug condition and the females to the placebo condition. The groups must be demographically equivalent.
- There must be a control condition. Having a condition that does not receive treatment allows experimenters to compare the results of the drug to the results of placebo.
- The only thing that can change between the conditions is the independent variable. For example, the participants in the drug study should receive the medication at the same place, from the same person, at the same time, and so on, for both conditions. Experiments often employ double-blind procedures in which neither the experimenter nor the participants know which condition any participant is in during the experiment. In a single-blind procedure, the participants do not know which condition they are in.
- The sample size has to be large and diverse enough to represent the population of interest. For example, a pharmaceutical company should not use only men in their drug study if the drug will eventually be prescribed to women as well.
- Experimenter effects should be minimized. This means that if there is a difference in scores on the dependent variable, they should not be attributable to something the experimenter did or did not do. For example, if an experiment involved comparing a yoga condition with an exercise condition, experimenters would need to make sure that they treated the participants exactly the same in each condition. They would need to control the amount of time they spent with the participants, how much they interacted verbally, smiled at the participants, and so on. Experimenters often employ research assistants who are blind to the participants’ condition to interact with the participants.
As you can probably see, much of experimental design is about control. The experimenters have a high degree of control over who does what. All of this tight control is to try to ensure that if there is a difference between the different levels of the independent variable, it is detectable. In other words, if there is even a small difference between a drug and placebo, it is detected. Furthermore, this level of control is aimed at ensuring that the only difference between conditions is the one the experimenters are testing while making correct and accurate determinations about cause and effect.
Research Focus
Video games and aggression
Consider an experiment conducted by Craig Anderson and Karen Dill (2000). The study was designed to test the hypothesis that viewing violent video games would increase aggressive behaviour. In this research, male and female undergraduates from Iowa State University were given a chance to play with either a violent video game (e.g., Wolfenstein 3D) or a nonviolent video game (e.g., Myst). During the experimental session, the participants played their assigned video games for 15 minutes. Then, after the play, each participant played a competitive game with an opponent in which the participant could deliver blasts of white noise through the earphones of the opponent. The operational definition of the dependent variable (i.e., aggressive behaviour) was the level and duration of noise delivered to the opponent. The design of the experiment is shown below (see Figure 2.4 ).
There are two strong advantages of the experimental research design. First, there is assurance that the independent variable, also known as the experimental manipulation , occurs prior to the measured dependent variable; second, there is creation of initial equivalence between the conditions of the experiment, which is made possible by using random assignment to conditions.
Experimental designs have two very nice features. For one, they guarantee that the independent variable occurs prior to the measurement of the dependent variable. This eliminates the possibility of reverse causation. Second, the influence of common-causal variables is controlled, and thus eliminated, by creating initial equivalence among the participants in each of the experimental conditions before the manipulation occurs.
The most common method of creating equivalence among the experimental conditions is through random assignment to conditions, a procedure in which the condition that each participant is assigned to is determined through a random process, such as drawing numbers out of an envelope or using a random number table. Anderson and Dill first randomly assigned about 100 participants to each of their two groups: Group A and Group B. Since they used random assignment to conditions, they could be confident that, before the experimental manipulation occurred, the students in Group A were, on average, equivalent to the students in Group B on every possible variable, including variables that are likely to be related to aggression, such as parental discipline style, peer relationships, hormone levels, diet — and in fact everything else.
Then, after they had created initial equivalence, Anderson and Dill created the experimental manipulation; they had the participants in Group A play the violent game and the participants in Group B play the nonviolent game. Then, they compared the dependent variable (i.e., the white noise blasts) between the two groups, finding that the students who had viewed the violent video game gave significantly longer noise blasts than did the students who had played the nonviolent game.
Anderson and Dill had from the outset created initial equivalence between the groups. This initial equivalence allowed them to observe differences in the white noise levels between the two groups after the experimental manipulation, leading to the conclusion that it was the independent variable, and not some other variable, that caused these differences. The idea is that the only thing that was different between the students in the two groups was the video game they had played.
Sometimes, experimental research has a confound. A confound is a variable that has slipped unwanted into the research and potentially caused the results because it has created a systematic difference between the levels of the independent variable. In other words, the confound caused the results, not the independent variable. For example, suppose you were a researcher who wanted to know if eating sugar just before an exam was beneficial. You obtain a large sample of students, divide them randomly into two groups, give everyone the same material to study, and then give half of the sample a chocolate bar containing high levels of sugar and the other half a glass of water before they write their test. Lo and behold, you find the chocolate bar group does better. However, the chocolate bar also contains caffeine, fat and other ingredients. These other substances besides sugar are potential confounds; for example, perhaps caffeine rather than sugar caused the group to perform better. Confounds introduce a systematic difference between levels of the independent variable such that it is impossible to distinguish between effects due to the independent variable and effects due to the confound.
Despite the advantage of determining causation, experiments do have limitations. One is that they are often conducted in laboratory situations rather than in the everyday lives of people. Therefore, we do not know whether results that we find in a laboratory setting will necessarily hold up in everyday life. Do people act the same in a laboratory as they do in real life? Often researchers are forced to balance the need for experimental control with the use of laboratory conditions that can only approximate real life.
Additionally, it is very important to understand that many of the variables that psychologists are interested in are not things that can be manipulated experimentally. For example, psychologists interested in sex differences cannot randomly assign participants to be men or women. If a researcher wants to know if early attachments to parents are important for the development of empathy, or in the formation of adult romantic relationships, the participants cannot be randomly assigned to childhood attachments. Thus, a large number of human characteristics cannot be manipulated or assigned. This means that research may look experimental because it has different conditions (e.g., men or women, rich or poor, highly intelligent or not so intelligent, etc.); however, it is quasi-experimental . The challenge in interpreting quasi-experimental research is that the inability to randomly assign the participants to condition results in uncertainty about cause and effect. For example, if you find that men and women differ in some ability, it could be biology that is the cause, but it is equally likely it could be the societal experience of being male or female that is responsible.
Of particular note, while experiments are the gold standard for understanding cause and effect, a large proportion of psychology research is not experimental for a variety of practical and ethical reasons.
Key Takeaways
- Descriptive, correlational, and experimental research designs are used to collect and analyze data.
- Descriptive designs include case studies, surveys, psychological tests, naturalistic observation, and laboratory observation. The goal of these designs is to get a picture of the participants’ current thoughts, feelings, or behaviours.
- Correlational research designs measure the relationship between two or more variables. The variables may be presented on a scatterplot to visually show the relationships. The Pearson correlation coefficient is a measure of the strength of linear relationship between two variables. Correlations have three potential pathways for interpreting cause and effect.
- Experimental research involves the manipulation of an independent variable and the measurement of a dependent variable. Done correctly, experiments allow researchers to make conclusions about cause and effect. There are a number of criteria that must be met in experimental design. Not everything can be studied experimentally, and laboratory experiments may not replicate real-life conditions well.
Exercises and Critical Thinking
- There is a negative correlation between how close students sit to the front of the classroom and their final grade in the class. Explain some possible reasons for this.
- Imagine you are tasked with creating a survey of online habits of Canadian teenagers. What questions would you ask and why? How valid and reliable would your test be?
- Imagine a researcher wants to test the hypothesis that participating in psychotherapy will cause a decrease in reported anxiety. Describe the type of research design the investigator might use to draw this conclusion. What would be the independent and dependent variables in the research?
Image Attributions
Figure 2.2. This Might Be Me in a Few Years by Frank Kovalchek is used under a CC BY 2.0 license.
Figure 2.3. Used under a CC BY-NC-SA 4.0 license.
Figure 2.4. Used under a CC BY-NC-SA 4.0 license.
Anderson, C. A., & Dill, K. E. (2000). Video games and aggressive thoughts, feelings, and behavior in the laboratory and in life. Journal of Personality and Social Psychology, 78 (4), 772–790.
Damasio, H., Grabowski, T., Frank, R., Galaburda, A. M., Damasio, A. R., Cacioppo, J. T., & Berntson, G. G. (2005). The return of Phineas Gage: Clues about the brain from the skull of a famous patient. In Social neuroscience: Key readings (pp. 21–28). New York, NY: Psychology Press.
Freud, S. (1909/1964). Analysis of phobia in a five-year-old boy. In E. A. Southwell & M. Merbaum (Eds.), Personality: Readings in theory and research (pp. 3–32). Belmont, CA: Wadsworth. (Original work published 1909)
Henrich, J., Heine, S. J., & Norenzaya, A. (2010). The weirdest people in the world? Behavioral and Brain Sciences, 33 , 61–83.
Kotowicz, Z. (2007). The strange case of Phineas Gage. History of the Human Sciences, 20 (1), 115–131.
Rokeach, M. (1964). The three Christs of Ypsilanti: A psychological study . New York, NY: Knopf.
Stangor, C. (2011). Research methods for the behavioral sciences (4th ed.) . Mountain View, CA: Cengage.
Psychology - 1st Canadian Edition Copyright © 2020 by Sally Walters is licensed under a Creative Commons Attribution-NonCommercial-ShareAlike 4.0 International License , except where otherwise noted.
Share This Book

The UK Faculty of Public Health has recently taken ownership of the Health Knowledge resource. This new, advert-free website is still under development and there may be some issues accessing content. Additionally, the content has not been audited or verified by the Faculty of Public Health as part of an ongoing quality assurance process and as such certain material included maybe out of date. If you have any concerns regarding content you should seek to independently verify this.
The design, applications, strengths and weaknesses of descriptive studies and ecological studies
PLEASE NOTE:
We are currently in the process of updating this chapter and we appreciate your patience whilst this is being completed.
Descriptive studies are frequently the first step into a new line of enquiry, and as such have an important role in medical research, where their findings can prompt further study. Their function is to describe the “who, what, why, when, where” without regard to hypothesis, highlighting patterns of disease and associated factors.
Descriptive studies that examine individuals can take the form of case reports (a report of a single case of an unusual disease or association), case series (a description of several similar cases) and cross-sectional studies (see “ Cross-sectional, analytical and intervention studies ”).
Descriptive studies that examine populations, or groups, as the unit of observation are known as ecological studies. Ecological studies are particularly useful to conduct when individual-level data would either be difficult or impossible to collect, such as the effect of air pollution or of legislation. Examples of the use of ecological studies include:
- Correlating population disease rates with factors of interest, such as healthcare use
- Demonstrating changes in mortality over time (time series)
- Comparing the prevalence of a disease between different regions at a single point in time (geographical studies)
Ecological studies often make use of routinely collected health information, such as hospital episode statistics in the UK or infectious disease notifications, so their principal advantage is that they are cheap and quick to complete. However, where appropriate information is not readily available it is necessary to carry out special surveys to collect the raw data necessary for the study.
Application
All forms of descriptive study can be used to generate hypotheses of possible causes or determinants of disease. These hypotheses can then be tested using further observational or interventional studies. Case reports can identify novel associations, such as the development of a rare benign liver cancer in a woman taking oral contraceptives 1 . Case series are useful in identifying epidemics. For example, the presence of AIDS in North America was identified by the report of a cluster of homosexual men in Los Angeles with a similar clinical syndrome 2 .
Ecological studies are a useful means of performing international comparisons and studying group-level effects (for example, the correlation between deaths rates from cardiovascular disease and cigarette sales per capita ).
Strengths and Weaknesses
Descriptive (including ecological) studies are generally relatively quick, easy and cheap to conduct. Particular strengths of ecological studies include:
- Exposure data often only available at area level.
- Differences in exposure between areas may be bigger than at the individual level, and so are more easily examined.
- Utilisation of geographical information systems to examine spatial framework of disease and exposure.
Weaknesses of case reports and case series are that they have no comparison (control) group, they cannot be tested for statistical associations, and they are especially prone to publication bias (especially where case reports/series describe the effectiveness of an intervention).
Limitations of ecological studies include:
- Measures of exposure are only a proxy based on the average in the population. Caution is needed when applying grouped results to the individual level (ecological fallacy, below ).
- Potential for systematic differences between areas in recording disease frequency. For example there may be differences in disease coding and classification, diagnosis and completeness of reporting between different countries.
- Potential for systematic differences between areas in the measurement of exposures.
- Lack of available data on confounding factors.
Ecological fallacy
The ecological fallacy is an error in the interpretation of the results of an ecological study, where conclusions are inappropriately inferred about individuals from the results of aggregate data. The fallacy assumes that individual members of a group all have the average characteristics of the group as whole, when in fact any association observed between variables at the group level does not necessarily mean that the same association exists for any given individual selected from the group. For example, it has been observed that the number of televisions per capita is negatively associated with the rate of deaths from heart disease. However, it would be an ecological fallacy to infer that people who don’t own televisions die from heart disease 3 . Indeed, in this scenario there are other potentially causative factors that could be common to both, such as reduced physical activity or a poorer diet associated with less affluent societies.
Reasons for the ecological fallacy include the following:
- It is not possible to link exposure with disease in individuals - those with disease may not be the same people in the population who are exposed.
- The data used may have originally been collected for other purposes.
- Use of average exposure levels may mask more complicated relationships with the disease, such as the J-shaped relationship between alcohol consumption and heart disease.
- Inability to control for confounding.
- Schenken JR. Hepatocellular adenoma: relationship to oral contraceptives? JAMA 1976; 236: 559.
- Anon. Pneumocystis pneumonia: Los Angeles. MMWR Morb Mortal Wkly Rep 1981; 30: 250–52.
- Grimes DA, Schulz KF. Descriptive studies: what they can and cannot do. Lancet 2002;359:145-9.
© Helen Barratt, Maria Kirwan 2009, Saran Shantikumar 2018
Strengths & Weaknesses of Descriptive Research
Janine murphy, 25 jun 2018.
Descriptive research is an innovative tool for researchers as it presents an opportunity to fuse both quantitative and qualitative data as a means to reconstruct the “what is” of a topic. However, descriptive research also has specific advantages and disadvantages. A skilled researcher can implement descriptive research designed to account for positive and negative variables while taking into account how those results may affect the research project’s objective. Some aspects of descriptive research which can be examined for advantages and disadvantages include data collection, life experiences, confidentiality, objectivity and error.
Explore this article
- Data Collection
- Life Experiences
- Confidentiality
- Objectivity and Error
1 Data Collection
Using a descriptive research design requires the use of specific forms of data collection related the process. These data collection forms can include case studies, observation or surveys. These techniques present several advantages as they provide a multifaceted approach for data collection that gives a broader view of the information. For example, a survey can provide statistics about an event while also illustrating how people experienced that event. A disadvantage of data collection can relate to human error in the collection of that data.
2 Life Experiences
Descriptive research designs also offer a unique means of data collection in the form of examining life experiences. Case studies can be based on various sources such as newspaper reports or personal accounts. These accounts provide insight into life experiences. An observational technique for data collection can be an organic means to study life experiences. It can also often remove the barriers of strict academic approaches as the researcher witnesses how others experience an event.
3 Confidentiality
Confidentiality is the primary weakness of descriptive research. Often subjects are not truthful as they feel the need to tell the researcher what they think the researcher might want to hear. This can be particularly difficult during in-person interviews. Participants may also refuse to provide answers to questions they view to be too personal. Further, the idea that someone is watching can turn an observation into an event where people are acting how they perceive they should act or speak.
4 Objectivity and Error
Descriptive research also presents the possibility for error and subjectivity. For example, when a researcher designs a questionnaire, questions are predetermined and prescriptive. Additionally, the study may contain errors as the researcher may record only what she wants to hear ignoring data that does not conform to the research project’s hypothesis. Overcoming a research bias is an extreme difficulty for descriptive research practitioners. Therefore, those who choose to use a descriptive research approach must be aware of their own influence on the outcome of the research.
- 1 The Learning Scientists: Different Research Methods Strengths and Weaknesses
About the Author
Janine Murphy has worked since 2006 as a researcher, and editor for academic theses. She completed her Masters of Arts in cultural history in 2006 at Memorial University of Newfoundland and is one year away from completing her Ph.D. in 19th-Century German history at the University of Frankfurt, Germany.
Related Articles
Descriptive Research Techniques
Qualitative Research Pros & Cons
The Advantages of Qualitative Observational Methods
The Five Approaches to Qualitative Research
Advantages & Disadvantages of Positivism
Qualitative Research Methods in Sociology
What Is the Meaning of the Descriptive Method in Research?
Advantages and Disadvantages of Journal Research Methods
Methods of Research Design
What Are the Advantages & Disadvantages of Non-Experimental...
Types of Descriptive Research Methods
Tools Used in Sociology
What Are Two Types of Research Methods in Sociology?
Pros & Cons of Existential Counseling
The Advantages of Exploratory Research Design
Data Collection Ideas for School Projects
Different Types of Methodologies
Major Types of Research Design
Define Primary & Secondary Data
What Is a Quasi Experimental Study?
Regardless of how old we are, we never stop learning. Classroom is the educational resource for people of all ages. Whether you’re studying times tables or applying to college, Classroom has the answers.
- Accessibility
- Terms of Use
- Privacy Policy
- Copyright Policy
- Manage Preferences
© 2020 Leaf Group Ltd. / Leaf Group Media, All Rights Reserved. Based on the Word Net lexical database for the English Language. See disclaimer .
Academia.edu no longer supports Internet Explorer.
To browse Academia.edu and the wider internet faster and more securely, please take a few seconds to upgrade your browser .
Enter the email address you signed up with and we'll email you a reset link.
- We're Hiring!
- Help Center

Title : An Introduction on Descriptive Analysis; Its advantages and disadvantages

Research is a crucial tool for leading man towards achieving progress, findings new facts, new concepts and discovering truths which leads to better ways of doing things. In the other words, “research is a diligent search, studious inquiry, investigation, experiment or collection of information, interpretation of facts, revision of existing theories and laws aimed at discovery of new facts and findings” (Adams al.,2007,P.20). Research Begins when researchers discover real world problems and try to answer those problems with the required mechanisms, tools and methods. Therefore, research methods have gained acceptance in all branches of science and disciplines which seek to find the answer for research questions in scientific manner (Ibid). It is believed, if a research does not follow any methodology, it may produce false results. There are different types of research for different disciplines and each discipline is associated with the particular scientific tools. Social sciences are one of those branches of sciences that follow its own research methods, methodologies and tools. Research method in social sciences is a vast topic. This is due to the fact that Social sciences include a great number of disciplines namely; Political Science, International Relations, Sociology, Economics, Anthropology, Social Capital, Education, Management, History, Psychology and so forth. Within each discipline researchers apply different methods and methodologies. The most frequently used methods are laboratory experiments, comparative politics, inferential analysis, descriptive analysis, exploratory research, Analytical Research and Predictive Research. Despite differences in disciplines and methods used in research, most disciplines in social sciences share same features and use same language for interpretation and reporting of their results (Walliman, 2011). It also happens that researchers use different methodologies for the similar type of problem of a discipline, it is as a result of limiting factors such as; cost, time, availability of tools, literature, access to publications and a country’s own peculiarities and circumstances (Adams et al.,2007). Descriptive research is one of the most commonly used type of researches in social sciences. A descriptive research aims to describe a phenomena the ways it is, for example, describing social systems or relationships between events (Adams et al., 2007). This paper attempts to introduce descriptive analysis; its advantages, disadvantages an example of Descriptive Analysis and conclusion. The next section introduces Descriptive Analysis.
Related Papers
Jacob Otachi ORINA
The study sought to establish the influence of governance on corruption levels from the perspective of the Public Service in Kenya. One of the study objectives was to: assess the influence of institutional leadership on corruption levels in the Public Service. A review of literature was done anchored on Principal-Agent Theory. The study adopted both the correlational and descriptive research designs. A study population of 265 institutions (as on 2015) provided a target sample size of 157 institutions. The target respondents in the sampled institutions were public officers who had undergone training on the following disciplines: leadership, integrity, values and principles of the public service and management during the study period (2010-2015). These purposely selected respondents were subjected to questionnaire. To augment data from the questionnaires, 23 key informant interviews were conducted targeting senior officers in the public service, non-state actors and experts. Data collected was analyzed by descriptive and inferential statistics. The overall correlation analysis results showed that there was a significant but negative relationship between institutional leadership and corruption levels as supported by correlation coefficient of-.525. The regression analysis results showed the coefficient of determination R square is .291 and R is .540 at 0.05 level of significance. The coefficient of determination indicates that 29.1% of the variation on corruption level is influenced by institutional leadership. The findings
The study sought to establish the influence of governance on corruption levels in the Public Service in Kenya. One of the study objectives was to: assess the influence of stakeholder participation on corruption levels in the Public Service. A review of literature was done anchored on Stakeholder Theory. Further, the empirical review, critique of reviewed literature, a summary and the research gaps were presented. The study adopted both the correlational and descriptive research designs. A study population of 265 institutions (as at 2015) provided a target sample size of 157 institutions where 133 were positive. The target respondents (unit of observation) in the sampled institutions were public officers who had undergone training on the following disciplines: leadership, integrity, values and principles of the public service and management during the study period (2010-2015). These purposely selected respondents were subjected to questionnaire as a primary tool of data collection. To augment data from the questionnaires, 23 key informant interviews were conducted targeting senior officers in the public service, non-state actors and experts. Data collected was analyzed by descriptive and inferential statistics. Data was presented in form of pie charts, graphs, tables and equations. The overall correlation analysis results showed that there was a significant but negative relationship between stakeholder participation and corruption levels as supported by correlation coefficient of -.741. The regression analysis results showed the coefficient of determination R square is 0.548 and R is 0.720 at 0.05 significance level. The coefficient of determination indicates that 54.8% of the variation on corruption level is influenced by stakeholder participation. The findings from the study are to benefit the policy makers, public service, citizens of Kenya and other stakeholders. It also fills the knowledge gap owed to previous little research on the influence of stakeholder participation on corruption levels. The study recommended that the public service should be keen to design policies and implement programs targeted on addressing the specific stakeholder sub constructs (stakeholder voice, openness, and partnership) so as to address the run-away corruption in the public service.
Oirc Journals
Risk is a fact of life in procurement but in spite of this, majority of manufacturing companies give this topic much less attention than it deserves. However, little or no research has been published that specifically addresses the procurement risk and mitigation strategies within the manufacturing sector in Africa land more so in the I Kenyan I manufacturing I firms that is central to delivery of goods and services to its customers. The main purpose of the study was to assess the influence of risk reduction on procurement performance. The study was guided by risk compensation theory. Explanatory research design was adopted. The target population was employees from four manufacturing firms and a sample of 127 respondents were selected using Yamane’s formula from an accessible population of 187. Data was collected through structured questionnaires and was summarized, edited, coded, entered and analyzed using statistical package for social scientists (SPSS). Inferential statistics involved regression analysis. The result was as follows: Based on risk reduction strategy, the correlation result was 0.583 and β = 0.051 at P<0.05. The study concluded that risk reduction was statistically significant and had a positive influence on procurement performance. The study findings rejected the null hypothesis that there is no statistically significant influence of risk reduction strategy on procurement performance. The study recommended policy makers to embrace other risk reduction strategies tools like diversification, underwriting and hedges. The study suggests that a further study be done on specific risk reduction strategies suitable for the manufacturing sector and a further study be done that focuses on specific procurement risks affecting the manufacturing sector and their effect on procurement performance.
International Journal of Strategic Management and Procurement
Performance of microfinance institutions is indicated by contributions to social welfare, job creation, general economic empowerment and improvement of lives of the poor. Despite the interest in the sector and the subsidies that have flowed into some of the mission-oriented MFIs, it seems that most MFIs struggle with the challenge of remaining viable over the long-term. Sensing capabilities could offer a solution to this dilemma through providing a customer management system which incorporates all functional areas of the organization. Thus, the main purpose of the study was to determine effect of sensing capability on performance of micro finance institutions in Eldoret town. This study was guided by resource-based view theory. Explanatory research design was used in this study. The target population for this study comprised of 584 employees drawn from 14 MFIs within Eldoret town. Stratified and simple random sampling technique was used in this study to select a sample of 162 employees. Primary data was obtained from the respondents using questionnaire. This study used questionnaires and interview schedules to collect data from respondents. Quantitative data collected from questionnaires were analysed using descriptive statistical techniques which were the frequencies, mean, standard deviation. Qualitative data collected from interview schedules of senior managers were analysed thematically. The researcher also used inferential statistics of Pearson Product Moment Correlation to show the relationships that exist between the variables and multiple regressions and correlation analysis, the significance of each independent variable was tested at a confidence level of 95%. Analysed data was presented in form of tables, figures and percentages. From the study finding, sensing capability has a significant effect on performance of micro finance institutions in Eldoret town with a beta coefficient of 0.127 and significance of (p<0.05). The study concluded that sensing capabilities about environment is a coping capability mechanism that enables the organization to be competitive.
Danial Zemchal Media Development in Tigray
Danial Zemchal
This paper comprises an ongoing MA Thesis research project titled “Assessment of Media Development in Tigray”. The main focus of this investigation concentrates on measuring the media development based on the UNESCO’s Media Development Measures. The pillars of the assessment are the system of regulation and practice in relation to freedom of expression, transparency of media ownership and concentration, diversity and plurality of the media, media as a platform of public discourse, professional capacity building as well as capacity of media infrastructure including its inclusive access to the marginalized society. It also examines the relationship among the media development measures through statistical Measure, SPSS. The research project which spotlight in examining the media development context in Tigray began in October 2018 and lasts in July 2019. A combination of quantitative questionnaire survey, qualitative; in-depth personal interview and focus group discussion are employed. Professionals in media firms in Tigray, higher education journalism and communication schools, democratic institutions; human right office, ombudsman office, civic and civil societies, Tigray, Kunama and Irob ethnicity communities are subjects of the research. The research project is currently progressed the quantitative and qualitative data collection process and analysis and presentation will be followed.
Assessment of Media Development in Tigray
International Journal of Scientific and Technological Research
Loading Preview
Sorry, preview is currently unavailable. You can download the paper by clicking the button above.
RELATED PAPERS
Cabdi Ciise
Begna Olira
Qeyliye Jama
Elisha Chimusoro
A Simple Guide to Research writing
Dr. David Annan
Effects of Terrorism on the Political Economy: Case Study of Garissa County, Kenya
George Nyongesa
European Journal of Business and Management
N. Marangu , ROBERT EGESSA
IOSR Journals
Janet Manyasi , Mathew Egessa
Mathew Egessa
Diane Mortel
Basheer Salaytah
Fernando Almeida
Nagalaxmi Lucky
Relationship between Corporate Governance and Information Security Governance Effectiveness in United States Corporations
Dr. Robert E Davis
Abdulwasiu K Ayoku
Lillian Otieno-Omutoko
lillian omutoko
Miguel Centellas
Faie Faiezah
kavita vadrale
American Based Research Journal
American Journal
JASH MATHEW
Othniel Kighir
Jacintho Del Vecchio Junior
Parvez Alam
Jara Mi Serino
International Journal of Social Science and Humanities Research
Conrad O Mogaka
Masters Degree Thesis
Stephen Baguma
Wossen Mesele
Open Access Publishing Group
oirc journals
Mnaka Godfrey
AFRICA NAZARENE UNIVERSITY
Edwin Onyango
International Journal of Academics & Research, IJARKE Journals
RELATED TOPICS
- We're Hiring!
- Help Center
- Find new research papers in:
- Health Sciences
- Earth Sciences
- Cognitive Science
- Mathematics
- Computer Science
- Academia ©2024
What are some advantages and disadvantages of using the structural functionalist perspective? Please provide a lengthy explanation
The structural functionalist perspective offers several advantages in understanding society and its systems. It focuses on the interdependence and stability of social structures, highlighting their functions and contributions to the overall functioning of society.
However, this perspective also has its limitations. It tends to overlook power dynamics, inequalities , and conflicts within social systems, and it may not adequately address social change and individual agency. The structural functionalist perspective provides a comprehensive understanding of society by examining how social structures, institutions, and systems work together to maintain social order and stability. It emphasizes the functions and contributions of various social elements in maintaining equilibrium. This perspective allows for the identification of key societal functions and how they contribute to social cohesion , cooperation, and overall well-being. By analyzing social systems such as education, family, or religion, it helps explain how they serve specific purposes and contribute to the smooth functioning of society.
One advantage of the structural functionalist perspective is its focus on the interconnectedness of social institutions. It recognizes that different social structures are interdependent, and changes in one structure can have ripple effects on others. This perspective also highlights the positive functions that social structures provide, such as education facilitating socialization and the economy providing livelihoods. By examining these functions, the structural functionalist perspective helps identify the stability and order within society.
In conclusion, while the structural functionalist perspective offers insights into the functioning and stability of social systems, it may overlook power dynamics, inequalities, and conflicts within society. It is important to consider alternative perspectives that highlight social change, power struggles, and individual agency to gain a more comprehensive understanding of complex social phenomena.
Learn more about interdependence here;
brainly.com/question/31720202
Related Questions
______________ covers all requirements that are derived from factors that are external to the system and it's development process.
External requirements covers all requirements that are derived from factors that are external to the system and it's development process
Hence, the correct answer is option c.
External requirements refer to the set of specifications and demands that are derived from factors outside the system being developed and its associated development process. These requirements are influenced by various external stakeholders such as clients, users, regulatory bodies, market conditions, or industry standards .
External requirements can include legal and regulatory compliance, industry-specific guidelines, market expectations, customer needs, and any other external factors that impact the system's design, functionality, and performance. They are essential in ensuring that the developed system meets the expectations and standards set by the external environment.
Learn more about stakeholders here
https://brainly.com/question/30241824
The given question is incomplete. Hence, the complete question is:
" ____ covers all requirements that are derived from factors that are external to the system and it's development process.
a. product requirements
b. functional requirements
c. external requirements
d. organizational requirements"
Typically in instrumentation and control cable only one end is grounded and the ________at the other end is isolated by folding it back and taping over it.
Typically in instrumentatio n and control cable, only one end is grounded, and the conductor at the other end is isolated by folding it back and taping over it.
In instrumentation and control cable installations, it is common practice to ground only one end of the cable. This means that one end of the cable is connected to an electrical ground or earth, while the other end is left unconnected to ground.
The purpose of grounding one end of the cable is to provide a reference point for electrical signals and to help minimize the risk of electrical noise or interference.
Read more on cable here https://brainly.com/question/28227640
While assessing a patient who is receiving intravenous digitalis, the nurse recognizes that the drug has a negative chronotropic effect. how would this drug effect be evident in the patient?
The negative chronotropic effect of intravenous digitalis would be evident in the patient through these possible effects: Decreased heart rate; Prolonged PR interval; Improved ventricular filling; and Decreased symptoms of heart failure.
Digitalis, also known as digoxin , acts as a cardiac depressant and can slow down the heart rate. It can affect the conduction system of the heart, specifically prolonging the PR interval on an electrocardiogram (ECG).
Digitalis enhances the contractility of the heart, leading to improved pumping efficiency. It is often prescribed for patients with heart failure to improve their symptoms.
Learn more about digitalis here:
https://brainly.com/question/33255065
Write and locate the member's country on a world map.
To effectively locate a member's country on a world map, you have to use online mapping tools or reference materials.
Locating a member's country on a world map can be done by utilizing various online mapping tools or reference materials. These resources provide detailed and accurate representations of the world, allowing you to pinpoint the specific location of a country.
By identifying its geographical coordinates or using visual indicators, such as borders and labels, one will easily find the member's country and gain a better understanding of its position in relation to other nations around the globe.
Read more about world map
brainly.com/question/28416579
Do you think pao acted on her values effectively? why or why not? does the fact that she lost the lawsuit impact your reasoning? explain.
While Ellen Pao's lawsuit against Kleiner Perkins sparked critical discussions on gender discrimination within the tech enterprise, the outcome of the case has raised varying critiques regarding the effectiveness of her movements. Regardless of the verdict, Pao's case has had a lasting effect by dropping mild troubles of gender inequality and inspiring others to address the place of work discrimination.
Determining whether Ellen Pao acted effectively on her values is subjective and relies upon man or woman views. Some may additionally argue that she correctly stood up against gender discrimination and raised awareness of the issue in the tech enterprise.
Pao's lawsuit precipitated a broader discussion and highlighted the want for the same opportunities for girls in project capital. Her willingness to take a stand and percentage her story may be visible as a brave and impactful action.
However, the truth that Pao lost the lawsuit may additionally affect a few humans' reasoning . The jury did now not discover sufficient evidence to assist her claims of gender discrimination and retaliation.
This outcome may lead some to impeach the effectiveness of her actions and whether or not her case had a good-sized impact on accomplishing her dreams.
To know more about gender discrimination,
https://brainly.com/question/30524888
The correct question is:
"In May 2012, Ellen Pao, a govt at Kleiner Perkins, filed a gender discrimination lawsuit against the Silicon Valley task capital organization. Pao alleged that she was ignored for promotions and ultimately terminated, whilst guys with comparable qualifications had been superior. Pao had previously raised concerns about enhancing the treatment of ladies in the organization but felt her efforts had been met with indifference. She documented times of harassment and exclusion from conferences in a proper memorandum.
The trial happened in February 2015, where Pao's prison team argued that women faced unequal remedy and that Pao skilled retaliation after ending an beside-the-point courting with a business enterprise partner. The defense focused on Pao's overall performance evaluations, portraying her as missing in teamwork and professionalism. The jury introduced a verdict in favor of Kleiner Perkins on three of the claims, highlighting steady poor performance reviews. However, one juror believed Pao had experienced discrimination.
Despite dropping the lawsuit, Pao's case drew attention to gender disparities in the undertaking capital industry. Law professor Deborah Rhode remarked that it sparked a vital dialogue and signaled a message to Silicon Valley. Pao expressed a desire that her case could make a contribution to a fairer environment for girls and minorities in challenge capital. Her movements inspired others to cope with administrative center discrimination, resulting in similar proceedings against outstanding organizations.
In precis, Ellen Pao's lawsuit against Kleiner Perkins shed mild on gender discrimination in the tech industry. While the trial's final results preferred the defense, the case sparked conversations and precipitated motion to cope with workplace inequality, highlighting the want for continued development in attaining identical possibilities.
Do you think Pao acted on her values effectively? why or why not? does the fact that she lost the lawsuit impact your reasoning? explain."
As you read this section, pay very close attention to the material on Kurt Lewin's three-stage model of planned change. This will be an important base of knowledge for you to have in this unit. After reading this section, critically evaluate the reasons why concepts like "unfreezing" and inclusion can help to bring about change in an organization. Write your response in your journal in the form of an essay of 350-500 words.
The concepts of " unfreezing " and inclusion can play crucial roles in bringing about change in an organization.
Unfreezing refers to the process of creating awareness and breaking through existing beliefs and behaviors that hinder change. By challenging the status quo and promoting a sense of urgency, unfreezing allows individuals to embrace new ideas and perspectives .
Inclusion, on the other hand, fosters a collaborative and diverse environment where all voices are heard and valued.
This encourages participation, engagement , and a sense of ownership among employees, ultimately facilitating smoother change implementation. Learn more about Perspectives.
https://brainly.com/question/11012390
Roger comes home to find that someone has illegally entered his apartment and stolen a large quantity of cash, electronics, and two handguns. Roger calls 911 states "I've been robbed!" Roger is legally correct in his assessment of the crime. True/False
Roger is legally correct in his assessment of the crime. The unlawful entry into his apartment, theft of cash, electronics , and firearms align with the definition of a robbery. Roger's immediate response to call 911 and report the incident as a robbery is appropriate and accurately describes the situation. Hence, the given statement is true.
Roger is legally correct in his assessment of the crime. Given the scenario described, where someone has illegally entered his apartment and stolen cash, electronics, and firearms, it can be classified as a robbery.
A robbery is a crime in which property is taken from a person or their immediate presence by force or threat of force. In this case, the perpetrator unlawfully entered Roger's apartment and took the cash, electronics, and handguns. The act of breaking into his home and taking these items constitutes a robbery.
Roger's immediate response to call 911 and report the incident as a robbery is appropriate. By stating "I've been robbed," he accurately conveys that he has been a victim of a crime involving the theft of his property through forceful entry.
It is important to note that the severity of the crime may vary depending on the jurisdiction and the specific laws in place. However, based on the information provided, Roger's statement of being robbed aligns with the general understanding of a robbery and is legally correct in describing the situation.
In conclusion, Roger is legally correct in his assessment of the crime . The unlawful entry into his apartment, theft of cash, electronics, and firearms align with the definition of a robbery. Roger's immediate response to call 911 and report the incident as a robbery is appropriate and accurately describes the situation.
Hence, the given statement is true.
Learn more about electronics from the given link:
https://brainly.com/question/31416819
Per the Harvard Business Case: Jean Claude Biver " The Reemergence of the Swiss Watch Industry: What factors account for Biver’s success at Blancpain and Omega? What professional and personal challenges did he face?
Jean Claude Biver's success at Blancpain and Omega can be attributed to his strong leadership, innovation , and passion for the Swiss watch industry. Despite facing professional and personal challenges, he revitalized the brands and left a lasting impact on the industry.
Jean Claude Biver's success at Blancpain and Omega can be attributed to several factors.
Firstly, Biver demonstrated strong leadership skills and a clear vision for both brands. He had a deep understanding of the heritage and craftsmanship associated with Swiss watchmaking and was able to leverage these elements to revive the brands.
Biver's passion for the industry and his ability to communicate that passion effectively to his teams and customers played a crucial role in his success.
Additionally, Biver was not afraid to take risks and innovate. He introduced new marketing strategies and product designs that breathed new life into the brands.
For example, at Blancpain, he focused on the concept of traditional watchmaking, producing limited edition and high-end timepieces that appealed to collectors.
At Omega, he successfully repositioned the brand as a luxury and innovative watchmaker, introducing the iconic Omega Speedmaster Moonwatch and leveraging partnerships with high-profile events like the Olympic Games .
However, Biver faced several professional and personal challenges along the way. Professionally, he had to navigate the turbulent period of the quartz crisis when the Swiss watch industry faced significant competition from Japanese quartz watches.
He also had to overcome resistance and skepticism from within the industry regarding his unorthodox marketing strategies and product launches.
On a personal level, Biver experienced health issues that required him to take a step back from his responsibilities at Blancpain.
He later faced personal loss when his wife passed away. Despite these challenges, Biver persevered and continued to drive success for Blancpain and Omega through his resilience, creativity , and unwavering commitment to the Swiss watch industry.
In conclusion, Jean Claude Biver's success at Blancpain and Omega can be attributed to his strong leadership, innovation , and passion for the Swiss watch industry. Despite facing professional and personal challenges, he revitalized the brands and left a lasting impact on the industry.
Learn more about innovation from the given link:
https://brainly.com/question/19969274
In girls, changes in the adrenal glands occur from about ______ to ______ years of age.
In girls, changes in the adrenal glands occur from about 6 to 9 years of age.
The adrenal glands are responsible for producing hormones such as cortisol and adrenaline . During this time, the adrenal glands undergo development and maturation, leading to changes in hormone production. These changes are part of the normal process of puberty and contribute to the physical and psychological changes that occur during this stage of development. During puberty, the adrenal glands become more active and produce increased amounts of hormones . This is necessary for the development of secondary s-exual characteristics, such as the growth of pubic and underarm hair, the development of breasts, and the onset of menstruation. These changes typically begin around 8 to 9 years of age in girls, but can start as early as 6 years of age in some cases. The exact timing and progression of adrenal gland changes may vary between individuals, but it generally falls within this age range. Learn more about the adrenal glands : https://brainly.com/question/33494789
a man is walking through the woods with his dog. suddenly, a tree limb falls in his path and he leaps out of the way to avoid it. then the man's dog gets loose, and he ends up chasing it through the woods for a minute or two before he manages to catch it.
The man chases after his dog for a minute or two before he finally catches it.
In this scenario, a man is walking through the woods with his dog .
As they are walking, a tree limb falls in his path, and he quickly jumps out of the way to avoid it.
Unfortunately, the man's dog gets loose and starts running through the woods .
Know more about chases here:
https://brainly.com/question/29141324
Anthropologists work with both quantitative and qualitative data. what defines qualitative data?
Qualitative data is the descriptive and conceptual findings collected through questionnaires, interviews, or observation.
The descriptive as well as conceptual information gathered through surveys, interviews, or observation is referred to as qualitative data . We can investigate concepts and further explain quantitative outcomes by analyzing qualitative data . Qualitative information describes traits or attributes. It is gathered by observation, interviews, or questionnaires and frequently takes the shape of stories.
Data that is felt or described is referred to as qualitative data . Binary, nominal, and ordinal data are the three main categories of qualitative information. Qualitative data can take many different forms, including those seen in studies, work, and statistics.
Learn more about the Qualitative data here:
https://brainly.com/question/1417786
Describe the effects of suggestive questioning. Break down several issues surrounding the debate regarding children as witnesses. Describe the ways in which you feel children should or should not be considered credible witnesses. Support your response with examples. Describe questioning techniques that are deemed effective when speaking to children as witnesses. Compare the term "system variable" with "estimator variable." Identify the factors that differentiate these two terms. Provide an example each of an estimator variable and a system variable, and describe how the respective variables relate to the legal process. Explain some of the cues for deceptions that psychologists look for and describe how they assess these cues. Analyze and explain whether stereotypes or stereotype beliefs influence perception in assessment. List and describe some major concerns regarding the validity of a polygraph and also explain some of the benefits of using a polygraph as part of a legal investigation. Describe several ways the polygraph has been advanced as a technique throughout the past decade. Use your textbook, lectures, and external resources (including the South University Online Library or the Internet) to support your response. Explain the two ways in which the polygraph record results are used in court.
The questions cover various topics related to forensic psychology and investigative techniques. They include the effects of suggestive questioning, the debate surrounding children as witnesses, effective questioning techniques for children, the distinction between system variables and estimator variables , cues for deception, the influence of stereotypes on perception, concerns and benefits of using a polygraph, advancements in polygraph techniques, and the use of polygraph records in court.
Suggestive questioning can distort memory and affect testimony accuracy. The debate on children as witnesses considers their reliability and credibility, with arguments for and against their inclusion. Effective questioning techniques for child witnesses focus on age-appropriate, non-leading approaches such as the cognitive interview or the NICHD Investigative Interview Protocol. System variables are within the control of the justice system, while estimator variables are external factors. Cues for deception include inconsistencies and physiological responses , assessed through content analysis and microexpression analysis.
Stereotypes influence perception in assessments by introducing biases. Polygraphs raise validity concerns but can aid investigations and influence plea negotiations. Recent advancements in polygraph techniques include computerized scoring algorithms and additional physiological measurements. Polygraph records are used as evidence and investigative tools in court, with varying admissibility and weight depending on jurisdiction.
Learn more about stereotypes here:
https://brainly.com/question/33531290
Determine which scale of measurement (nominal, ordinal, interval, or ratio) is most appropriate.
To decide measurement scale is most appropriate, one should consider the type of data being measured and the level of measurement required for analysis or interpretation.
This scale is used to categorize data into different groups or categories with no inherent order or number. Examples include gender (male/female), ethnicity (white/African American/Asian), and eye color (blue/brown/green). Data can only be divided into different categories, no mathematical operations or comparisons can be performed.
This scale ranks or ranks data based on some criterion or attribute, but the spacing between values may not be equal or meaningful. Examples of this are rating scales (such as Likert scales) and rankings (1st, 2nd, 3rd). Data can be ranked, but differences between ranks may not be equally important.
To know more about measurement scale visit :
https://brainly.com/question/13086959
A small online retailer that sells clothing through amazon would operate effectively in which of these environments?
A small online retailer that sells clothing through Amazon would operate effectively in a complex and stable environment, as it requires navigating the complexities of e-commerce, managing inventory, logistics, and online marketplaces like Amazon.
Complex refers to the intricate and multifaceted nature of the online retail environment. It signifies the presence of various interrelated factors and challenges that a small online clothing retailer needs to navigate, such as managing inventory, understanding customer preferences, optimizing marketing strategies , and adapting to the dynamic nature of e-commerce platforms like Amazon.
Operating in a complex environment requires the retailer to possess the ability to analyze and respond to market trends, competitors, and technological advancements effectively. Successfully managing this complexity is crucial for the retailer's long-term success and growth in the online retail industry.
Learn more about complexity here:
https://brainly.com/question/27908364
Your complete question is this:
A small online retailer that sells clothing through Amazon would operate effectively in which of these environments?
A) Simple + Stable
B) Simple + Unstable
C) Complex + Unstable
D) Complex + Stable
in the 1970s, lenore weitzman and her colleagues found that boys played a more significant role than girls in preschool children's books by a ratio of:
We can see here in the 1970s , Lenore Weitzman and her colleagues conducted a study on the portrayal of gender roles in preschool children's books. Their findings revealed that boys played a more significant role than girls in these books by a ratio of approximately 4 to 1.
Lenore Weitzman, also known as Lenore J. Weitzman, is a sociologist and author known for her research on gender, family, and divorce. She has made significant contributions to the field of family studies and has written several influential books on the topic.
Weitzman is best known for her groundbreaking book, "The Divorce Revolution: The Unexpected Social and Economic Consequences for Women and Children in America."
Learn more about Lenore Weitzman on https://brainly.com/question/8324875
How can the growth mindset concepts be applied to addiction to help people overcome addictive behaviors (re: Deckers C3: Addictions and Addictive Behaviors)? Please describe your application/connection in detail and cite
The growth mindset, as proposed by psychologist Carol Dweck, emphasizes the belief that abilities and intelligence can be developed through effort, learning, and perseverance.
One way to apply the growth mindset to addiction is by encouraging individuals to view addiction as a challenge that can be overcome through personal growth and development .
To implement this approach, treatment programs and interventions can incorporate the following strategies:
Education and awareness: Provide individuals with a deep understanding of the growth mindset concept and its relevance to addiction recovery. Educate them about the brain's neuroplasticity, emphasizing that the brain can rewire itself and develop new pathways that support healthier behaviors.
Empowerment through effort: Encourage individuals to embrace the idea that recovery requires effort, commitment, and continuous learning. Help them understand that setbacks and relapses are part of the learning process, rather than indicators of failure. Promote the belief that progress is made through persistence and resilience.
Shift focus from failure to learning: Encourage individuals to reframe their perception of relapses or setbacks as opportunities for learning and growth rather than reasons to give up. Teach them to analyze the factors contributing to relapses, identify triggers, and develop effective coping strategies.
Goal setting and incremental progress: Facilitate the setting of realistic and attainable goals that align with the individual's recovery journey. Break down larger goals into smaller, manageable steps to provide a sense of achievement and maintain motivation. Celebrate progress and highlight the efforts made, reinforcing the idea that change is possible.
Support and community: Foster a supportive and non-judgmental environment where individuals feel safe to share their challenges, seek guidance, and receive encouragement. Peer support groups or therapy sessions can provide a sense of community and validation, allowing individuals to learn from others' experiences and share their own.
Deckers, L. (2020). Motivation: Biological, psychological, and environmental (5th ed.). Routledge. (Chapter 3: Addictions and Addictive Behaviors)
Learn more about intelligence here:
https://brainly.com/question/30077986
carmelo is researching president john f. kennedy’s campaign speeches. for sources, he is using both the speeches themselves and reporters’ analyses of the speeches. the reporters’ articles are best described as
The reporters ' articles are best described as primary sources. Carmelo is researching President John F. Kennedy's campaign speeches. The correct option is A.
In research, a primary source is an original document that provides direct evidence or firsthand testimony concerning a topic under study. As Carmelo is investigating President John F. Kennedy's campaign speeches, the reporters' articles are best described as primary sources since they are eyewitness accounts that provide direct evidence of the events under investigation.
Reporters' articles are particularly useful as primary sources because they are written at the time of the occurrence of the event and provide an immediate view of the situation. They are valuable since they reflect the journalists' interpretation of the situation. Reporters' articles enable us to comprehend the context and setting of an event.
For the reason that they give a contemporaneous account of an occurrence, they are indispensable in recording the actions, reactions, and feelings of individuals present during the occurrence.
To learn more about President visit:
https://brainly.com/question/497462
The complete question is-
The reporters' articles are best described as:
A) Primary sources of information about President John F. Kennedy's campaign speeches.
B) Secondary sources providing analysis and interpretation of the speeches.
C) Tertiary sources summarizing the main points of the speeches.
D) Oral histories recounting personal experiences with the campaign speeches.
It is appropriate to make a decision using bounded rationality when Multiple Choice the decision needs to be made quickly in a crisis. it is not possible to be decisive. a group has to arrive at the d
The correct option is a. the decision needs to be made quickly in a crisis.
when a decision needs to be made quickly in a crisis, it is appropriate to employ bounded rationality to reach a timely and satisfactory decision under the given circumstances.
Bounded rationality refers to the concept that decision-making is often constrained by limitations in time, information, and cognitive abilities. In situations where decisions need to be made quickly in a crisis, there may not be sufficient time or resources to gather all the necessary information or conduct a comprehensive analysis . In such cases, individuals or groups may rely on simplified decision-making strategies or heuristics to reach a satisfactory solution within the given time frame.
During a crisis, there is often a sense of urgency and a need for immediate action. It may not be feasible to thoroughly evaluate all available alternatives or consider all potential outcomes.
Learn more about Decision-making
https://brainly.com/question/30697303
Describe a time when you experienced culture shock. Merriam-Webster’s College Dictionary defines culture shock as a "sense of confusion and uncertainty sometimes with feelings of anxiety that may affect people exposed to an alien culture," such as one might experience when visiting a foreign country. What caused the culture shock you experienced? What did you do to adjust to the culture?
Culture shock refers to the sense of confusion and uncertainty that a person experiences when exposed to an unfamiliar culture. One time I experienced culture shock was when I traveled to Japan for the first time.
Everything from the food to the language to the customs and traditions was different from what I was used to. It was hard to adjust to the fact that I couldn't communicate effectively with locals as I couldn't speak Japanese fluently.
Moreover, Japan is a very traditional country, and their ways of doing things were significantly different from what I was accustomed to.
I took the time to learn more about Japanese culture , food, and language. I found out that learning a few phrases in Japanese can help a lot. Also, I took the initiative to understand the social norms, including bowing, and respect for elders. It made my interaction with the locals more comfortable.
Moreover, I was open to trying new foods , and I found out that it was quite exciting. Eventually, I started to enjoy the Japanese culture and even embraced it as my own.
To learn more about Culture shock
https://brainly.com/question/1084246
What human behaviors tied to communication do you consider rude in public spaces? Why?
Rude human behaviors tied to communication in public spaces include speaking loudly or aggressively, engaging in private conversations in crowded areas, and being disrespectful towards others. These behaviors are considered rude because they disrupt the peaceful environment , invade personal space, and show a lack of consideration for others' needs.
Several behaviors tied to communication can be considered rude in public spaces. One of them is speaking loudly or aggressively. When individuals raise their voices or use aggressive tones, it not only disturbs the tranquility of the environment but also creates discomfort for those nearby. Such behavior can be intimidating, offensive, and may lead to unnecessary conflict or tension.
Engaging in private conversations in crowded areas is another rude behavior. Public spaces, such as buses, trains, or cafes, are shared by multiple individuals. Having personal conversations in these spaces without considering the people around can be intrusive and disrupt the peace and quiet others may seek. It invades their personal space and makes it difficult for them to concentrate or relax.
Being disrespectful towards others while communicating is also considered rude. This includes using offensive language , derogatory remarks, or making disrespectful gestures. Such behaviors not only show a lack of basic manners but also create a hostile and uncomfortable environment for everyone present. Respectful communication is crucial in public spaces to ensure harmonious coexistence and foster a sense of community.
In conclusion, speaking loudly or aggressively, engaging in private conversations in crowded areas, and displaying disrespectful behavior towards others are all considered rude in public spaces . These behaviors disrupt the peaceful environment, invade personal space, and demonstrate a lack of consideration for others' needs. It is important to practice respectful communication in public spaces to promote a positive and inclusive social environment.
Learn more about environment here:
https://brainly.com/question/5511643
True or False: According to IDEA, the above definition includes learning problems resulting from other disabilities or environmental, cultural, or economic disadvantages. Most states require three criteria to be met to receive services, list two of them. What are two other things that you learned about this exceptionality, children with this exceptionality, families with children challenged by this exceptionality, or strategies you will employ in your classroom? idea definition of learning disabilities is a disorder in one or more of the basic psychological process involved in understanding or using.
According to IDEA ( Individuals with Disabilities Education Act), the statement is true.
According to IDEA, the definition of learning disabilities includes learning problems that can result from other disabilities, as well as environmental, cultural, or economic disadvantages. This acknowledges that various factors can contribute to learning difficulties and that these challenges can manifest differently in different individuals.
Regarding the criteria to receive services, most states require three key components to be met: (1) the presence of a specific learning disability, (2) the need for special education services, and (3) the impact of the disability on the student's educational performance.
In terms of other aspects related to learning disabilities, children with this exceptionality may benefit from individualized instruction, accommodations, and interventions tailored to their specific needs. Collaborating with families, engaging in ongoing communication, and fostering a supportive and inclusive classroom environment are also crucial for addressing the challenges faced by children with learning disabilities.
Additionally, educators can employ strategies such as differentiated instruction, multisensory learning approaches, assistive technologies, and progress monitoring to support students with learning disabilities and promote their academic and social-emotional development.
By implementing these strategies and creating an inclusive classroom environment, educators can help students with learning disabilities thrive and reach their full potential.
Learn more about disabilities here:
https://brainly.com/question/32468309
Community Recreational Tourism What historical themes in CRT are still relevant today? (Answer not less than 500 words)
Community Recreational Tourism (CRT) encompasses a wide range of historical themes that continue to be relevant in the present day. One such theme is the preservation and interpretation of cultural heritage.
Many communities rely on their historical assets and landmarks to attract tourists and generate economic benefits.
By showcasing historical sites, artifacts, and traditions, CRT allows visitors to connect with the past, fostering a sense of appreciation and understanding for different cultures and histories . CRT promotes sustainable practices and the conservation of natural resources . Learn more about Natural resources .
https://brainly.com/question/32129155
There is a recent trend in american design codes to transition from working stress design (wsd) to load and resistance factor design (lrfd) in geotechnical engineering. is this true or false, and why?
It is true that there is a trend in American design codes to transition from Working Stress Design (WSD) to Load and Resistance Factor Design (LRFD) in geotechnical engineering.
The requirements of the American Association of State Highway and Transportation Officials (AASHTO), as well as many other advanced regulations across the world, have turned towards Reliability-Based Design (RBD).
The RBD LRFD format is implemented in the AASHTO standards. This transition is intended to improve understanding and future development of the LRFD requirements.
RBD presents a probabilistic approach to design, taking into account uncertainties in material qualities, loads, and safety margins.
Engineers acquire a better knowledge of structural behavior and may design with greater dependability and safety by combining statistical analysis and probability estimates.
Thus, this shift in design practices demonstrates a commitment to constantly improving and refining standards for the benefit of transport infrastructure .
Learn more about the Load and Resistance Factor Design here:
https://brainly.com/question/30429887
You work in a multi-national company where there are a number of expatriates. As Deepavali is just around the corner, you have been asked to give a speech during the company’s Deepavali luncheon to your foreign colleagues on why the Hindu community in Malaysia celebrates Deepavali. Your expatriate colleagues have given you a list of questions to which they would appreciate answers and they are as follows: What is Deepavali? When is it celebrated? Is Deepavali a religious festival? What is the festival about? Is there more than one story behind Deepavali? What are some of the traditions practised during Deepavali? What kind of traditional food and delicacies are served? Are there certain types of attire you need to wear? Do people from other Indian religions celebrate Deepavali? Write the speech that you will be making to your colleagues at the Deepavali luncheon. Your written speech should be about 800 words long. Remember to list your sources on the References Page at the end of your written speech. You should also use these references when you do in-text citations in your answer. You must have at least 2 in –text citations and references for this question. Use the APA Style of referencing. Guidelines on how to write the speech Introduction Salutation – greeting tutor, course mates Introductory remarks/Introducing oneself/link to audience/hook/background information (You can choose any two of the above) Preview of speech- Write an introduction about Deepavali Answers to 9 questions about Deepavali to be put into appropriate number of paragraphs. For each question mention: What it is about and provide elaborations or examples to explain it. Conclusion Signal closing Summary/Review of main points of the speech Concluding remark on the beliefs of Sikhism Thank audience for listening
In this speech, I will provide an overview of Deepavali , the Hindu festival celebrated in Malaysia. I will address various aspects of the festival , including its significance, traditions, stories, food, attire, and its celebration among different Indian religions.
Ladies and gentlemen,
Good afternoon, distinguished guests, and my esteemed colleagues. I stand before you today to shed light on the vibrant festival of Deepavali, celebrated by the Hindu community in Malaysia. Deepavali, also known as Diwali, holds great significance in Hindu culture and is a joyous occasion filled with lights, prayers, and festivities. Firstly, Deepavali is celebrated on the fifteenth day of the Hindu month of Kartika, which usually falls in October or November. It marks the triumph of light over darkne and good over evil. While it is primarily a religious festival, it has transcended religious boundaries and is celebrated by people of various backgrounds in Malaysia. Deepavali is a festival that symbolizes the victory of Lord Rama over the demon king Ravana. It signifies the return of Lord Rama from exile after defeating Ravana and rescuing his wife, Sita. The lighting of oil lamps, known as diyas, is done to welcome Lord Rama's return and to illuminate homes and ward off darkness.
Apart from the story of Lord Rama, there are other legends associated with Deepavali. In some regions, Deepavali is celebrated to honor the Goddess Lakshmi, the goddess of wealth and prosperity. It is believed that Lakshmi visits homes that are clean and brightly lit, bringing blessings of wealth and fortune. During Deepavali, several traditions are practiced. One of the key traditions is the cleaning and decoration of homes to invite positive energy. Rangoli, intricate and colorful patterns made with colored powders or rice, adorn the entrances of houses. Additionally, families visit temples to offer prayers and seek blessings for a prosperous year ahead. Food plays a central role in Deepavali celebrations. Families prepare an array of traditional sweets and delicacies, such as murukku (savory snack), payasam (sweet milk pudding), and ladoo (sweet balls), to share with loved ones and guests. The exchange of these homemade delicacies fosters a sense of togetherness and goodwill. When it comes to attire, people often dress in traditional Indian clothing during Deepavali. Women wear vibrant sarees or salwar kameez, while men don kurta-pajama or traditional Indian attire. The colorful outfits symbolize joy and celebration.
While Deepavali is primarily celebrated by Hindus, people from other Indian religions, such as Sikhs and Jains, also participate in the festivities. For Sikhs, Deepavali holds religious significance as it commemorates the release of Guru Hargobind Sahib, the sixth Sikh Guru, from captivity. Jains celebrate Deepavali to honor Lord Mahavira, the founder of Jainism, attaining Nirvana (liberation) on this day. In conclusion, Deepavali is a significant festival celebrated by the Hindu community in Malaysia. It symbolizes the victory of light over darkness, good over evil, and brings people together in joyous celebration. From the lighting of diyas to the preparation of traditional delicacies, Deepavali showcases the rich cultural heritage and traditions of the Hindu community. I hope this speech has provided you with a deeper understanding of the festival, and I invite you all to join us in the celebrations and experience the warmth and vibrancy of Deepavali.
Thank you for your attention.
Learn more about festival;
https://brainly.com/question/28546336
Explain 2 ways the French have influenced Canadian culture. Be sure to make the correct historical connections and describe the context
The French have played an important role in shaping the culture of Canada. They have left their cultural imprints, which are still visible in contemporary Canadian culture .
Here are two ways the French have influenced Canadian culture:
The French language: French culture has had a profound impact on Canadian culture, particularly in Quebec, where French is the official language. French was first spoken in Canada by French settlers who established New France in the 17th century. The French language has played an essential role in shaping Canadian culture.
French architecture: The French have also influenced Canadian architecture. French architecture is renowned for its beauty and sophistication. It is characterized by symmetry, proportion, and attention to detail. French architecture is visible in various buildings throughout Canada, including the Parliament Building in Ottawa and the Chateau Frontenac in Quebec City.
To know more about Canadian culture
https://brainly.com/question/513160
Hundreds line up for 5 p.m. Eminem ticket giveaway Hundreds of Eminem fans lined up to get a free ticket to the rapper's secret concert. Although bckets would be teleased at 5 pm, people lined up all day. Eminem will release hes new album Relapse (his first in 5 years) on the same day Source. Detroct Free Press, May 18, 200 S Is the marginal benefit from the concert zero? Because all the tickets were free, the marginal benefit from the concent zero bectuse A. Was; marginal benotit equals zero price B. Was; fans stood in line to get the free tickets C. was not,the net benefit from attending the concert was not zoro D. Was, fans were not willing to pary to attend
The marginal benefit from the concert is not necessarily zero.
Option A is correct
The fact that hundreds of Eminem fans lined up all day to get a free ticket indicates that there is a perceived benefit to attending the concert. Therefore, the correct answer would be option C: the marginal benefit from the concert was not zero because the net benefit from attending the concert was not zero.
Despite the tickets being free, fans were still willing to invest their time and effort to secure a ticket, suggesting that they anticipated enjoying the concert and deriving value from the experience.
To know more about marginal benefit here
https://brainly.com/question/8136407
According to harriett bradley, _________ categorized societies in terms of their mode of productionthat is, the relationship between groups of people who combine to produce goods and services
As per harriett bradley, Karl Marx arranged social orders as far as their method of production that is, the connection between gatherings who consolidate to create labor and products.
In the area of social science, the order of social orders in light of their method of creation is ordinarily connected with crafted by Karl Marx and Friedrich Engels. Marx and Engels proposed a structure that isolated social orders into various methods of creation, which alluded to the predominant monetary frameworks and the social connections they involve.
It's vital to take note of that this order has been dependent upon different translations and studies over the long run, and various researchers might have their own structures for classifying social orders in view of their method of creation .
Learn more about Karl Marx , from:
brainly.com/question/13742699
Share an example that you have seen in the popular press that demonstrates one of the ethical leadership challenges from the text (e.g., challenge of responsibility, power, privilege, etc.). Briefly describe the example. How/why does it demonstrate a given challenge? Which moral component(s) and/or ethical perspectives are at play? What can/should have been done in your example and what can you do to ensure that your leadership behaviors are ethical?
Imagine a CEO of a large company who is faced with a decision to downsize the workforce in order to improve profitability . The CEO knows that this action will result in significant job losses and hardship for many employees.
This scenario highlights the challenge of responsibility and the moral components of fairness, empathy, and accountability. The CEO has the power and privilege to make decisions that affect the lives of employees. The ethical perspective at play may involve utilitarianism , which weighs the overall happiness and well-being of the company against the negative consequences for the employees.
In this example, the CEO could have approached the situation ethically by considering alternatives to downsizing, such as cost-cutting measures or exploring new business strategies. The CEO should have also prioritized the well-being of employees and sought ways to minimize the impact on their lives. Transparent communication, involvement of stakeholders, and providing support for affected employees are important steps that could have been taken.
To ensure ethical leadership behaviors, it is crucial to adhere to principles such as fairness, integrity, transparency, and empathy. Leaders should strive to consider the consequences of their decisions on all stakeholders and act in the best interests of the organization as a whole. Seeking diverse perspectives, promoting a culture of open communication and accountability, and continuously reflecting on and improving one's own ethical decision-making skills are key steps to ensuring ethical leadership behavior. Regular ethical training, staying informed about ethical frameworks, and seeking guidance from mentors or colleagues can also contribute to maintaining ethical leadership practices.
Learn more about hardship here:
https://brainly.com/question/31629096
The Elements of War War is a complicated subject; it is hard to understand unless shown in the right way. It’s never an enjoyable moment when one thinks about war, remembering all the pain and suffering that happened back then is hard to stomach, and unless one can look past the horror and terror of war to try and find the secrets behind them is extremely hard to do through books or papers. But when one can see and understand the history and importance of learning about the past then they will be able to see more than just terror. That’s what movies are for. The historically accurate movies based on past wars all have the common theme of showing the pain and suffering of the time while also showing and teaching the viewer about the important and history filled conflicts. What makes a movie fit into the genre of good war movies is the three elements of real combat, heartbreak, and accuracy. When a movie can correctly use these elements, it can really provide a great resource of learning. In a movie about any war, they all show fighting and explosions and shooting but just adding this to make effects and look "cool" don’t do as well as other movies that really focus on true combat and strategy of the generals and soldiers of the time. Many movies show true combat really well but the movie that is best known for it is the movie Black Hawk Down. Black Hawk Down is about a platoon of soldiers on a mission to take out or capture a Somalian warlord and end up being shot down and stranded in the war-torn city with the only option to fight their way out. The hardcore and gritty battles of urban war are really well portrayed in this film. Urban fighting is very hard to portray because of the amount of time and detail that must be put in to correctly show the cities and the many depths and levels that go into the fights. One might see explosions and shooting and yelling and could think action or spy movie, but when one notices the complex elements of combat and strategy, they will really know they are watching a war film. Another element that really shows a movie is deep into a war is the heartbreak. Heartbreak is a driving factor in many movie genres but when you see the feeling and the face of a soldier that had just lost his friend or his brother truly puts a toll on the human spirit and truly shows how heart wrenching and terrifying war is. This terror teaches and portrays in an accurate way the truth behind war. Many reasons explain why war movies are so liked but the main reason is the fact that it shows the soldiers not fighting for a leader, but for each other, and when one loses the reason, they are fighting, the heartbreak on their face completely relates to the viewer. The last and probably the most necessary part of a war movie is the authenticity. War movies pride themselves on being realistic and not making things up. Movies such as Dunkirk and Saving Private Ryan, are known for and extremely do well in keeping everything realistic and trying to do justice to those that took place and fought and died at the time. It’s a quite obvious but also extremely important part of war movies. The viewer shouldn't have to think about or wonder if what their watching is true because that sadly takes away from the movie and doesn't provide justice to the people being portrayed in the movie. War is a terrible thing and is very hard to learn and study without being uncomfortable or scared and this causes one to not want to learn anymore. Movies in the war genre do very well in taking the history and moments of the past and putting them in a way that is easier to comprehend and able to be studied and observed without being too much to handle. War is a complicated subject; it is hard to understand unless shown in the right way. When accurate combat, relatable heartbreak and historical accuracy and used in a movie, the war is able to be remade.
The three elements that make a movie fit into the genre of good war movies are real combat, heartbreak , and accuracy.
In a movie about any war, they all show fighting and explosions and shooting but just adding this to make effects and look "cool" doesn’t do as well as other movies that really focus on true combat and strategy of the generals and soldiers of the time.
The first element is the real combat . Many movies show true combat really well but the movie that is best known for it is the movie Black Hawk Down. Black Hawk Down is about a platoon of soldiers on a mission to take out or capture a Somalian warlord and end up being shot down and stranded in the war-torn city with the only option to fight their way out. The hardcore and gritty battles of urban war are really well portrayed in this film. Urban fighting is very hard to portray because of the amount of time and detail that must be put in to correctly show the cities and the many depths and levels that go into the fights.
The second element is heartbreak . Heartbreak is a driving factor in many movie genres but when you see the feeling and the face of a soldier that had just lost his friend or his brother truly puts a toll on the human spirit and truly shows how heart wrenching and terrifying war is.
The last element is authenticity . War movies pride themselves on being realistic and not making things up. Movies such as Dunkirk and Saving Private Ryan are known for and extremely do well in keeping everything realistic and trying to do justice to those that took place and fought and died at the time. It’s a quite obvious but also extremely important part of war movies.
The viewer shouldn't have to think about or wonder if what they're watching is true because that sadly takes away from the movie and doesn't provide justice to the people being portrayed in the movie.
To know more about heartbreak,
https://brainly.com/question/32606222
all the following factors characterize a transformational leader except multiple choice being energetic. being charismatic. being permissive. being self-confident.
The following factors characterize a transformational leader except : being permissive.
The correct answer is: being permissive.
For more such questions on transformational leader
https://brainly.com/question/24109450
ORIGINAL RESEARCH article
Exploring patient perspectives on iran’s electronic prescription system: a qualitative inquiry.

- 1 Student Research Committee, Department of Health Information Management, School of Health Management and Information Sciences, Shiraz University of Medical Sciences, Shiraz, Iran
- 2 Department of Health Information Technology, Varastegan Institute for Medical Sciences, Mashhad, Iran
- 3 Clinical Education Research Center, Health Human Resources Research Center, Department of Health Information Management, School of Health Management and Information Sciences, Shiraz University of Medical Sciences, Shiraz, Iran
- 4 Department of Pharmaceutical Biotechnology, School of Pharmacy, Shiraz University of Medical Sciences, Shiraz, Iran
Background: Electronic prescriptions represent a fundamental shift in service delivery, healthcare management, and associated costs, offering numerous advantages. However, akin to other electronic systems, they also present challenges. This study aimed to investigate patients’ understanding of the challenges associated with electronic prescriptions in Iran.
Methods: This study used a qualitative research design, utilizing individual and semi-structured interviews with patients referred to selected pharmacies across all 11 districts of Shiraz City. The data were analyzed using MAXQDA software (version 10), and descriptive statistics for demographic data were calculated using SPSS version 19.
Results: The study revealed that the participants generally demonstrated a certain level of familiarity with electronic prescribing systems. However, it was evident that many were unaware of the potential implications of such technology for their relationships with healthcare providers. This underscores the urgent need for patient understanding in the context of the electronic prescription system. While patients were relatively familiar with the functionality of electronic prescribing systems, they lacked a comprehensive understanding of how using these systems could affect their interactions with healthcare providers.
Conclusion: Patients are significant beneficiaries of the electronic prescribing system. By addressing their needs and concerns, they can develop a positive attitude toward this system. Their active engagement can pave the way for the system’s ease of use, increase its acceptance, and ultimately enhance the quality of healthcare services.
Introduction
Electronic prescription, typically defined as the transition from paper prescriptions to electronic systems facilitating the creation, transmission, and processing of prescriptions by healthcare providers and pharmacies, represents a pivotal transformation in healthcare management. This includes a range of activities, from patient registration to information retrieval and service provision, all within the context of electronic systems. Many countries are transitioning toward electronic systems to improve safety, efficiency, and cost-effectiveness in healthcare delivery, with electronic prescriptions being a key component of this transformation ( 1 – 3 ). Electronic prescribing is intended to alleviate the burden on patients with chronic conditions, reducing the necessity for frequent consultations with their physician, as electronic prescriptions can be issued through online consultations. This approach saves both time and money for the therapist and patient, and so far, it has reduced up to 60% of chronic patients’ visits to the doctor ( 4 , 5 ).
There has been a significant increase in the adoption of electronic outpatient treatment services, which is indicative of a global trend toward digitizing healthcare delivery. This shift from manual to electronic systems underscores the crucial role of digital transformation in healthcare services worldwide ( 6 – 8 ). In most European Union member states, healthcare services are progressively provided electronically. This trend is expected to accelerate, with initiatives to integrate these systems into an international electronic health service framework. This integrated network will enable citizens to have seamless access to medications and medical services across member countries, primarily facilitated by electronic prescribing initiatives ( 9 – 11 ).
Electronic prescriptions offer numerous advantages, including reducing revisits for chronic patients, ensuring accurate insurance information, minimizing prescription errors during pharmacy delivery, enabling patients to purchase items from different pharmacies with a single prescription, and providing access to prescription histories. Moreover, it eliminates paper documentation, reduces production costs, assists treatment decisions through decision support systems, and enhances service quality for patients ( 10 , 12 ). Research indicates a preference for electronic prescribing among primary care practitioners, citing benefits such as enhanced legibility, reduced medication errors, and streamlined workflows ( 4 , 8 , 9 , 13 ). Conversely, the inherent challenges of manual prescription systems, such as illegible handwriting leading to medication errors, underscore the pressing need for electronic prescribing solutions to enhance patient safety and elevate the standard of care ( 4 , 9 , 13 ).
However, electronic prescribing systems are not without their challenges. These include high setup, maintenance, and training costs for medical staff, bandwidth limitations leading to system outages, security and privacy concerns among users, an increase in physician errors in electronic prescriptions, and communication barriers between patients and healthcare providers ( 5 , 11 ). In Iran, the Ministry of Health is mandated by the fifth and sixth development plans to implement electronic prescriptions. The initial implementation occurred in 2016 in private physician offices in collaboration with the Tamin-E-Ejtemaei organization. Following this, health insurance agencies such as Salamat and Tamin-E-Ejtemaei expanded the program across provinces as a pilot project until January 2021, when it became mandatory for all outpatients nationwide ( 13 , 14 ).
Until now, in Iran, there has been limited investigation into the complex aspects of electronic prescriptions from the patient’s perspective. This study investigates patients’ attitudes toward electronic prescription and its impact on their satisfaction levels, the quality of healthcare delivery, and their interactions with healthcare professionals, including doctors and pharmacists. The primary objective of this research is to shed light on patients’ understanding of electronic prescribing and its influence on the quality of care, their interactions with prescribers and pharmacists, as well as their perceptions of the benefits and drawbacks of electronic prescribing within the city of Shiraz.
Materials and methods
This qualitative study is based on one-on-one interviews. Semi-structured and individual interviews were conducted with patients referred to selected pharmacies across all 11 districts of Shiraz city. This approach was chosen to provide the necessary flexibility to explore patients’ attitudes. An initial list of pharmacies in Shiraz city was selected as a stratified sample based on the 11 regions to collect patients’ views on electronic prescribing. Announcements were placed in the selected pharmacies, and invitation letters were included in patients’ medicine packages. This allowed patients willing to participate in the study to call the contact number on the invitation letter and arrange the interview time. Patients aged 18 years or older who had at least three visits to a doctor in the past year and were prescribed an electronic prescription were included in this study.
A semi-structured interview was conducted to collect the necessary data to assess patients’ attitudes, ensuring maximum flexibility in capturing patients’ perspectives. The interview evaluated three areas: patients’ understanding of electronic prescriptions, their relationship with the doctor and pharmacist, and their viewpoint on the advantages and disadvantages of electronic prescribing.
Following data collection, rigorous analysis procedures were implemented. All interviews were transcribed verbatim immediately after recording, with researchers concurrently taking detailed notes during the interviews to ensure the accuracy and completeness of the data.
Thematic analysis, a well-established qualitative research method, was conducted for data analysis. The analysis process adhered to a structured six-step approach:
Familiarization with the Data : Researchers immersed themselves in the collected data, gaining a profound understanding of the content and identifying underlying concepts.
Generation of Initial Codes : Each concept, including its primary and sub-elements, was systematically assigned a code, facilitating data organization.
Category Exploration : Through iterative examination, categories were developed to group related codes, allowing for the identification of overarching themes within the dataset.
Review of Main and Subcategories : This critical step involved revisiting codes, categories, and subcategories to ensure they accurately reflected the dataset’s nuances.
Definition and Naming of Categories and Subcategories : Distinct definitions and appropriate labels were assigned to each category and subcategory, ensuring clarity and consistency in the analysis.
Report Preparation : The final phase involved summarizing and presenting the findings coherently and comprehensively.
The researcher conducted the interviews in a room within the pharmacies. The interviews were recorded, and verbatim transcription was performed after obtaining consent from the interviewees. The transcripts were then cross-verified against the audio recordings. Limited demographic data were also collected as part of the interview process.
Two researchers read and coded transcripts separately. They then discussed the transcripts to identify inconsistencies and reach a consensus on coding decisions.
In the initial stage, both researchers shared common opinions on approximately 76% of the codes. Subsequently, the two researchers re-coded the transcripts, and in the second phase of the review, the agreement on codes reached 99%. The remaining 1% was discussed in a second session, and ultimately, both researchers reached a consensus.
The interviews yielded three main categories and 28 sub-categories. Qualitative analysis was performed using MAXQDA software (version 10), and descriptive statistics for demographic data were calculated using SPSS version 19.
The interview questions were selected from the article titled “Patient perceptions of e-prescribing and its impact on their relationships with providers: A qualitative analysis” ( 7 ).
To ensure the validity and accuracy of the qualitative data, the research adhered to Guba and Lincoln’s criteria, which encompass reliability, variability, dependability, and confirmability ( 15 ). The interview analysis was conducted iteratively, and the text was shared with participants to rectify potential errors. Various coding methods were also utilized, and an expert in qualitative studies assisted in the analysis.
The present study received approval from the Ethics Committee of Shiraz University of Medical Sciences, Shiraz, Iran (IR.SUMS.REC.1401.361). After securing the necessary permits from the Research Vice-Chancellor of the Faculty of Medical Information and Management and a letter of approval from Shiraz University of Medical Sciences, the researchers explained the research objectives to the participants and introduced themselves. They assured the participants that all recorded information would remain confidential. After that, participants willing to participate in the study were selected, and they were also assured that they could withdraw at any stage of the interview process. Other ethical considerations included: (1) obtaining written consent from the participants, (2) assuring the participants that the study results would be made available to them if they wished, (3) observing ethical considerations in terms of data confidentiality, (4) expressing gratitude to all the people who cooperated in the research, and (5) obtaining approval from the ethics committee.
Between December and February 2021, we conducted 21 interviews, each lasting approximately 15 to 60 min. The participants comprised of 48% men and 52% women. Table 1 shows the demographic information of the participants.

Table 1 . Demographic information of interviewed patients.
Subjects regarding patients’ attitudes toward electronic prescribing were organized into 3 main categories and 11 sub-categories. Some of these sub-categories were further divided into sub-sub-categories. In total, 42 main codes were extracted. Table 2 reveals the detailed breakdown of these categories, sub-categories, and codes.

Table 2 . Main category, sub-category, sub-sub-category, and main codes extracted from the study.
The key findings from the analysis are outlined below. It is worth noting that the number of participants may not always be 21 in certain instances, as responses were not mutually exclusive. In certain cases, participants expressed more than one opinion on a specific topic, resulting in a frequency count exceeding 21 for some measures.
A: patients’ awareness of electronic prescribing
Most participants were not entirely familiar with electronic prescribing, and when asked to provide a detailed explanation, they could not explain what it meant to them. Most explained that the prescriber uses a computer, and the prescription is sent directly to the pharmacy, bypassing manual delivery ( n = 16).
One of the patients perceived electronic prescriptions as the use of Internet platforms such as WhatsApp for doctor consultations:
“Yes, I know that it is online instead of in person. We call the doctor, and the doctor consults us through WhatsApp, explains what to do, prescribes our medicine, and then we go to the pharmacy to get our medicine.” (P4-ph.A-D1) 1
Another participant equated it with a person’s authentication system:
“I will provide a national code so that they can identify us. This is referred to as electronic prescription.” (P6-ph.B-D3)
Patients with very limited knowledge of the electronic prescribing system were provided with explanations about these services. Interviews were conducted only after patients had gained a clear understanding of the electronic prescribing system.
These interviews occurred approximately a year after the electronic prescription project was launched in Iran. Over half of the participants ( n = 13) were unaware of the exact start time of electronic prescriptions. Regarding their awareness of this project, participants learned about it during a doctor’s appointment ( n = 9), through social media ( n = 6), and via online platforms ( n = 3). Additionally, three participants were informed about the project through other means, such as acquaintances and friends.
Regarding the time and method of becoming acquainted with the system, one participant mentioned:
“I believe I learned about it about two years ago or less…through my colleagues.” (P10-ph.C-D9)
Other participants mentioned that they became aware of this program approximately 3 months ago through visiting a pharmacy or a physician:
“I guess it was around two or three months ago that I went to a pharmacy and found out about this.” (P14-ph.D-D5)
“It has been three or four months now… I found out through the media and after visiting the doctor.” (P12-ph. E-D8)
Another participant had detailed information about the beginning of the project:
“It has been electronic for about a year … they announced it on TV.” (P16-ph. F-D6)
B. attitudes toward electronic prescribing
B-1: attitude toward electronic prescribing (in the physician’s office).
Most participants were unaware of the type of services provided by the doctor and the type and number of prescribed medicinal items ( n = 18). On the other hand, almost half of the participants ( n = 9) did not perceive any difference in the doctor’s behavior during their visit compared to the previous visits. The second phase of this issue pertained to the group that had experienced negative feelings about their doctor ( n = 7). Only three participants mentioned that the conditions were better than in the past.
In this regard, one participant mentioned:
“No; They do not disclose the number and type of medicine unless the doctor has the ethics to do so, and they also do not explain.” (P5-ph. G-D11)
Another participant expressed dissatisfaction with the change in doctor–patient communication due to electronic prescribing:
“The relationship has worsened. Doctors used to communicate, but now most doctors are more connected to the system, trying to find the medicine and write the prescription. They used to communicate more than now”.(P7-ph. F-D6)
One participant expressed concerns regarding the electronic prescription being managed by the doctor’s secretary and noted the absence of noticeable changes in the doctor’s behavior compared to the manual prescription writing:
“I've visited a doctor several times since electronic prescriptions were introduced. This doctor did not directly enter medicine details into the system. Instead, he prescribed paper and instructed me to take it to his secretary for typing. It feels like he's still prescribing it as if it were a paper prescription.”(P1-ph. H-D4)
On the other hand, another participant felt satisfied about the type of prescriptions and improved communication with the doctor.
“Every time I visit the doctor, who is familiar with me, he always inquires whether I have certain medicines at home to avoid prescribing them again. When he writes the prescription, he consults us, and since the doctor knows us, he asks about the medicines we already have. The doctor’s clear explanation of my prescription alleviates my concerns.” (P19-ph. I-D2)
B-2: attitude toward the electronic prescription (in the pharmacy)
The participants were asked two questions during a visit to the pharmacy to receive their medicine. The first question was about the waiting time to receive the medicine, and the second was about communicating with the pharmacist regarding the necessary explanations of prescribed medicines.
Regarding the waiting time to receive medicine, a total of 17 individuals responded. Nine individuals reported a delay in the delivery services, five reported no difference, and three reported quicker delivery services in the pharmacy.
One patient expressed dissatisfaction with the delayed delivery of the medicine:
“Now there is more of a delay. We used to wait less, but now we have to wait longer. They have sent letters everywhere about the electronic system; we have to wait longer because of the electronic system”(P8-ph.C-D9)
One participant attributed the longer waiting time in the pharmacy to the perceived dishonesty of the pharmacy staff and a lack of patient information:
“The duration of receiving medicine has increased. Sometimes pharmacists lie that the system is not working in order to rest for a while.”(P17-ph. G-D111)
On the other hand, some patients evaluated the delivery time as favorable:
“Now it is faster than the paper prescription.”(P1-ph. H-D4)
Regarding the pharmacy technician’s explanations of the drugs and the pharmacist’s interaction with the patient, seven individuals rated the conditions as worse than before, nine rated them as unchanged from before, and five rated them as improved compared to before. One participant shared their experience with the pharmaceutical manufacturer as follows:
“Yes, The pharmacists inform patients, for instance, that out of this prescription, we do not have two of the medications, or that we offer the Iranian brand or the foreign brand.”(P21-ph. J-D7)
Another participant said:
“Yes. In the pharmacy, they explain the medication, how to take each one, or whether it is a foreign or Iranian brand.”(P8-ph.C-D9)
Yet another patient evaluated the situation as worse than before:
“No, they do not say how many medicines are there. If they do not have a medicine, sometimes they mention that they do not and refer us to check other pharmacies, but sometimes they do not say anything.”(P20-ph.B-D3)
C: advantages and disadvantages of electronic prescription
C-1: positive attitudes and experiences.
Patients’ positive attitudes and experiences with electronic prescribing were primarily related to ease of use ( n = 17), safety and quality ( n = 9), and cost ( n = 4). Some individuals reported more than one positive experience, the frequency of which was mentioned in both sections.
The ease of electronic prescription refers to the elimination of the need to renew health insurance booklets, reducing the time spent providing some services, no need to carry a health insurance booklet, and the possibility of receiving single-prescription drugs from several different pharmacies without removing the paper from the insurance booklet.
One of the patients stated:
“The pharmacies used to say that we have one of the drugs, we do not have the other one, and you have to buy the one we do not have without insurance coverage. Previously, there were mistakes in the doctor's handwriting, or the doctor had stamped only one medicine, and the other was not stamped. Now these problems have been solved.” (P5-ph. G-D11)
Issues regarding safety and quality include reducing medication errors, increasing access to information for prescribers, and avoiding losing prescriptions.
A participant mentioned in this regard that:
“The most important advantage, in my opinion, is that the mistakes that pharmacies and lab technicians used to make because of doctors' bad handwriting will not be repeated. Secondly, patients used to lose prescriptions. Before, if the doctor wrote the prescription incorrectly or it was in poor handwriting, we had to go back to the doctor to correct it. But now, we no longer have to return to the doctor because they write prescriptions with a computer. It is always written correctly and is no longer a problem.”(P5-ph. G-D11)
Positive experiences have been reported in terms of both overall cost reduction for the healthcare system and environmental protection.
A 23-year-old woman made the following positive observations:
“For example, I believe that less paper should be used. I am one of those who believe that life should be green. The less paper we use, the less environmental damage there is. I think this is a very positive thing.”(P19-ph. I-D2)
C-2: attitude and negative experiences
Patients’ negative perceptions and experiences of electronic prescribing predominantly point to the infrastructural problems, the slowness and uncertainty of the system ( n = 18), a feeling of less control over their prescriptions ( n = 18), communication problems with prescribers ( n = 13), and errors in the timing of prescriptions by their doctor ( n = 10).
Several patients reported that the doctor incorrectly prescribed their electronic prescription.
Communication challenges with prescribers include worsening interpersonal communication, as the prescriber seemed to be more focused on the computer than interacting with the patient. Communication challenges with pharmacists included missing the opportunity to interact at the prescription delivery stage.
In general, patients associate electronic prescribing with a loss of control over their prescriptions. On the other hand, delays in sending prescriptions lead to delays in receiving drugs.
Patients also reported that previous written prescriptions provided them with personal access to information about what was being prescribed, even if it was just the name of the drug.
Two patient statements presented below are examples of negative perceptions/experiences of electronic prescription:
“A 35-year-old woman said: My uncle's daughter once went to the pharmacy. She was allergic to a certain medicine, and the doctor mistakenly prescribed that medicine. Luckily, the pharmacist, who knew my cousin well, realized she was allergic to the prescribed medicine. The pharmacist asked her, “Don't you have an allergy? Why do you want to take this medicine? Her physician had already changed that medicine for her. If she had taken the wrong medicine that the doctor had prescribed for her, it would have been very dangerous.”(P8-ph.C-D9)
Another patient said:
“I asked several times and from different pharmacies about the medicine and why it was given to me. I realized that it had nothing to do with my medicine and nothing to do with my disease. When I went back to the doctor and questioned it, he said that he had typed the drug code wrongly. He then rewrote the prescription, and I had to leave and come back again. It is true that there were mistakes in reading the prescription, and now those mistakes are not happening. Still, there could be a problem with the medicine code due to doctors’ lack of familiarity with this new system. Some doctors do not have complete information about the new system, so they cannot work with it properly and prescribe the wrong medicine. The relationship has unfortunately deteriorated. Previously, doctors would communicate, but now it seems that most doctors primarily concentrate on navigating the system to locate the medication and write the prescription. The level of communication was notably higher in the past than the present.”(P7-ph. F-D6)
Another participant stated:
“The disadvantages that I would say are internet and website outages, and patient delays. It means that there is internet, but the site might have a problem. More time is being spent.”(P14-ph.D-D5)
Despite participants identifying both advantages and disadvantages of electronic prescription, some patients reported no personal impact from the technology or expressed neutral opinions about its use. Specifically, patients did not report any changes in communication with the doctor ( n = 9), communication with the pharmacist ( n = 5), or the duration of service in the pharmacy ( n = 5).
This study aimed to explore patients’ attitudes toward electronic prescription systems in Shiraz. Interviews were conducted with 21 patients who sought medical services and visited pharmacies across 11 city districts for medication. The findings revealed a range of positive and negative attitudes and experiences among patients.
Patients in our study reported positive attitudes and experiences regarding electronic prescribing. They emphasized the ease of use, enhanced safety, improved healthcare quality, and cost reduction associated with this system. Seventeen patients mentioned a positive experience, and one only mentioned positive points. These findings align with a study conducted in Poland in 2021, which also highlighted the convenience of electronic prescribing, the reduced risk of prescription loss, and the elimination of the need for in-person doctor visits ( 14 ). On the other hand, patients in our survey spoke negatively about their experiences and views related to infrastructural difficulties, system hiccups, slowness, electronic prescription mistakes, feeling like they have less control over their prescriptions, and poor contact with their prescribers. Eighteen patients mentioned at least one negative point, and three people mentioned only negative points. These findings correspond with those of a previous article ( 9 ). Interestingly, our research suggests that patients generally held a more favorable opinion of electronic prescribing compared to the perspectives of doctors and pharmacists, as noted in a study conducted by Amlashi et al. in 1401 (equivalent to 2022–2023 in the Persian calendar) ( 16 ).
In general, patients were unfamiliar with electronic prescribing, and they felt that using this technology had little impact on their care. However, patients reported positive attitudes and experiences regarding ease of use, safety, quality, and cost. The participants in this study were unaware of the capabilities of electronic prescribing, such as checking the records of previous prescriptions and utilizing machine learning methods to help the doctor improve the quality of care and reduce the incidence of errors. This issue is addressed by a study named “Patient perceptions of e-prescribing and its impact on their relationships with providers: a qualitative analysis” ( 7 ). On the other hand, the results of this study differed from the results of a study titled “Patient perception and satisfaction with the electronic prescription system: results of the PERSA-RE questionnaire” ( 4 ).
The study highlighted the challenges stemming from the limitations of the e-prescribing system, which resulted in an increased workload and time consumption for patients. These limitations reduced the effectiveness of e-prescribing, ultimately forcing patients to obtain only a portion of their prescribed medications. Consequently, patients were compelled to cover the costs of medications not covered by their insurance plans, contributing to a financial burden. These findings align with the results of a study titled “A Pilot Study to Evaluate Prescription Transfer and Drug Collection through a New Electronic Prescription Service: A Cross-Sectional Survey” conducted in Saudi Arabia ( 12 ). This correspondence underscores the universal nature of the challenges associated with e-prescribing system limitations and their impacts on patient care and financial well-being.
There is still hope that the passage of time and the usage of electronic prescriptions will enhance patient’s experiences and knowledge about all of their features. Despite the disadvantages of electronic prescribing, some patients have provided valuable suggestions to improve their conditions. In a study evaluating prescription transfer and drug collection through a new electronic prescription service ( 12 ), the participants were not interested in making suggestions. However, most participants in this study were satisfied with the plan’s encouragement and presented significant suggestions. Their suggestions included using a printer to print prescriptions if requested by the patient, sending the contents of registered prescriptions to the patient’s mobile number, creating a proper hardware infrastructure, adapting the doctor–patient interaction in response to the changes in the platform of interactions, and providing 24-h support from the technical team to remove existing obstacles. These were some of the proposals mentioned by patients to resolve problems and improve the existing situation. This study’s results were inconsistent with the study conducted in Saudi Arabia ( 12 ).
In addition to the common concerns that patients express about losing opportunities to interact with the doctor, the non-compliance of the pharmacy and the pharmacist during the prescription delivery phase was also a point of worry. Some patients were concerned that because they did not know the content of the prescribed medication, they may be delivered more or less medicine, or without their knowledge, a specific type and brand of medicine that the doctor intended may not be delivered to them. Participants suggested that information at the time of prescription, such as printed patient information and post-visit summaries, could be made available to these people to address such concerns. In their study, Jabraeili et al. suggested that system developers should improve their capabilities by properly communicating with users and fully understanding their real needs, which is consistent with the suggestions made by the participants in this study ( 17 ).
Most global studies have examined the technical advantages and disadvantages of electronic prescribing systems. These studies have focused on the attitudes of doctors, pharmacists, and other personnel related to electronic prescribing, with few studies conducted on patients’ attitudes toward electronic prescribing ( 5 , 11 , 13 ). Like other countries, following the introduction of electronic prescriptions in Iran, studies have been conducted to assess their advantages, disadvantages, and problems, particularly from the technical perspectives of doctors and pharmacists. However, no research has been conducted regarding the patients’ attitudes toward this issue ( 2 , 3 ). Patients and those who refer to health and treatment centers for medical services can be important beneficiaries of the electronic prescribing system. Patient satisfaction with the electronic prescribing system will help patients adhere to treatment with better and more effective communication with the doctor. It is very important to know the strengths and weaknesses from the perspective of patients, who are the significant beneficiaries of this plan ( 2 , 5 ). However, physicians and pharmacists should also be aware of the potential problems that can arise from miscommunication related to electronic prescribing. More research is needed to determine how clinicians can use these existing tools to improve patient education and prescription decisions.
This study had several limitations. One of these limitations was the small sample size. Another limitation was the generalizability of the results. Although qualitative studies inherently have limited generalizability, an effort was made to increase the generalizability of the results by including women with different characteristics. Another limitation was the relative youth of the interviewed population compared to other studies. This issue is due to the better understanding of this group of interviewees regarding the use of emerging technologies, including electronic prescriptions. This group of patients was also more willing to answer our questions. Despite these limitations, the study provides valuable insights into patients’ attitudes toward electronic prescriptions. Further research with a larger and more diverse sample size could help to address these limitations.
Given the importance of patient–therapist communication in healthcare, it is essential to explore the changing dynamics of doctor–patient interactions in the context of electronic prescribing. Future research can delve into the nature of these evolving communication patterns and aim to develop strategies to mitigate potential harm. Such research would illuminate ways to optimize the doctor–patient relationship within the framework of electronic prescribing. Moreover, addressing patients’ concerns about privacy violations is a pressing issue. Future studies should focus on implementing measures to alleviate patient apprehension regarding the security and confidentiality of their health information in electronic prescribing systems. By enhancing data security and privacy safeguards, healthcare providers can foster greater patient trust and confidence, ultimately improving the adoption and acceptance of electronic prescribing technologies. Given that the mean age of the statistical sample in our study was 35 ± 10, extrapolating the findings of this study to communities with a different mean age requires careful consideration.
Patients reported positive attitudes and experiences regarding the ease of use, safety, quality, and cost of electronic prescribing. However, they also reported negative attitudes and experiences related to infrastructural problems, system delays and interruptions, errors in electronic prescribing, a perceived loss of control over their prescriptions, and communication problems with their prescribers. Many patients’ concerns stemmed from a lack of knowledge about the program and its advantages. Therefore, educating medical staff, especially doctors and pharmacists, is necessary to adapt their interactions to the electronic prescribing system. This includes familiarizing them with more features of electronic prescription to improve their use. By doing so, we can address patients’ concerns and enhance their experience with electronic prescribing.
Data availability statement
The raw data supporting the conclusions of this article will be made available by the authors, without undue reservation.
Ethics statement
The studies involving humans were approved by the Ethics committee of Shiraz University of Medical Sciences, Shiraz, Iran (IR.SUMS.REC.1401.361). The studies were conducted in accordance with the local legislation and institutional requirements. The participants provided their written informed consent to participate in this study.
Author contributions
SA: Data curation, Conceptualization, Methodology, Formal analysis, validation, Writing – original draft. SZ: Conceptualization, Methodology, validation, supervision, Project administration, Writing – original draft, Writing – review & editing. MR: Conceptualization, Methodology, Investigation, Writing – original draft.
The author(s) declare that no financial support was received for the research, authorship, and/or publication of this article.
Conflict of interest
The authors declare that the research was conducted in the absence of any commercial or financial relationships that could be construed as a potential conflict of interest.
Publisher’s note
All claims expressed in this article are solely those of the authors and do not necessarily represent those of their affiliated organizations, or those of the publisher, the editors and the reviewers. Any product that may be evaluated in this article, or claim that may be made by its manufacturer, is not guaranteed or endorsed by the publisher.
1. ^ P: Patricipant/ph: pharmacy/D: district.
1. Karajizadeh, M, Zand, F, Vazin, A, Nasiri, M, and Sharifian, R. Identification and prioritization of clinical decision support functionalities built within a computerized provider order entry system. Health Scope . (2021) 10:104607. doi: 10.5812/jhealthscope.104607
Crossref Full Text | Google Scholar
2. Karajizadeh, M, Zand, F, Vazin, A, Saeidnia, HR, Lund, BD, Tummuru, SP, et al. Design, development, implementation, and evaluation of a severe drug-drug interaction alert system in the ICU: an analysis of acceptance and override rates. Int J Med Inform . (2023) 177:105135. doi: 10.1016/j.ijmedinf.2023.105135
3. Jebraeily, M, Rashidi, A, Mohitmafi, T, and Muossazadeh, R. Evaluation of outpatient electronic prescription system capabilities from the perspective of physicians in specialized polyclinics of Urmia social security organization. Payavard . (2021) 14:557–68.
Google Scholar
4. Guijarro, AB, Guijarro, EB, Bailén, M, and Hernando, A. Percepción y satisfacción del paciente con el sistema de receta electrónica: resultados del cuestionario PERSA-RE. Farm Comunitarios . (2022) 14:9–16. doi: 10.33620/FC.2173-9218.(2022/Vol14).002.03
5. Zadeh, PE, and Tremblay, MC. A review of the literature and proposed classification on e-prescribing: functions, assimilation stages, benefits, concerns, and risks. Res Soc Adm Pharm . (2016) 12:1–19. doi: 10.1016/j.sapharm.2015.03.001
PubMed Abstract | Crossref Full Text | Google Scholar
6. Karajizadeh, M, Zand, F, Vazin, A, Nasiri, M, Sarikhani, Y, and Sharifian, R. Evaluation criteria for the effects of decision support integrated into computerized provider order entry system: a scoping review. Shiraz E-Med J . (2022) 23:120195. doi: 10.5812/semj-120195
7. Frail, CK, Kline, M, and Snyder, ME. Patient perceptions of e-prescribing and its impact on their relationships with providers: a qualitative analysis. J Am Pharm Assoc . (2014) 54:630–3. doi: 10.1331/JAPhA.2014.13176
8. Campbell, C, Morris, C, and McBain, L. Electronic transmission of prescriptions in primary care: transformation, timing and teamwork. J Prim Health Care . (2021) 13:340–50. doi: 10.1071/HC21050
9. Wrzosek, N, Zimmermann, A, and Balwicki, Ł. A survey of patients’ opinions and preferences on the use of e-prescriptions in Poland. Int J Environ Res Public Health . (2021) 18:9769. doi: 10.3390/ijerph18189769
10. Schleiden, LJ, Odukoya, OK, and Chui, MA. Older adults’ perceptions of e-prescribing: Impact on patient care. Perspect Health Inf Manag . (2015) 12:1d
11. Aldughayfiq, B, and Sampalli, S. Patients', pharmacists', and prescribers' attitude toward using blockchain and machine learning in a proposed ePrescription system: online survey. JAMIA Open . (2022) 5:ooab 115. doi: 10.1093/jamiaopen/ooab115
12. Tobaiqy, M, Ainousah, BE, Alorfi, NM, Alghamdi, A, and Alqutub, ST. A study to assess prescription transfer and medicines collection through a new electronic prescription service: a cross-sectional survey. Int J Gen Med . (2023) 16:3689–99. doi: 10.2147/IJGM.S432075
13. Hailiye Teferi, G, Wonde, TE, Tadele, MM, Assaye, BT, Hordofa, ZR, Ahmed, MH, et al. Perception of physicians towards electronic prescription system and associated factors at resource limited setting 2021: cross sectional study. PLoS One . (2022) 17:e0262759. doi: 10.1371/journal.pone.0262759
14. Riyazi, F, Sadeghi, M, and Atashaneh, M. Legal analysis of the competitive dimensions of the sixth five-year economic, social and cultural development plan. Iran J Educ Sociol . (2021) 4:30–40. doi: 10.52547/ijes.4.4.30
15. Schwandt, TA, Lincoln, YS, and Guba, EG. Judging interpretations: but is it rigorous? Trustworthiness and authenticity in naturalistic evaluation. N Dir Eval . (2007) 2007:11–25. doi: 10.1002/ev.223
16. Alavi Amlashi, SR, Kazemnejad Leyli, E, and Sheikhtaheri, A. Physicians’ and pharmacists’ viewpoint on ambulatory electronic prescription system. J Hosp Adm . (2022) 25:108–24.
17. Feather, C, Appelbaum, N, Darzi, A, and Franklin, BD. Indication documentation and indication-based prescribing within electronic prescribing systems: a systematic review and narrative synthesis. BMJ Qual Saf . (2023) 32:357–68. doi: 10.1136/bmjqs-2022-015452
Keywords: electronic prescription, health information technology, doctor, pharmacist, qualitative analysis
Citation: Arabian S, Zakerabasali S and Raee MJ (2024) Exploring patient perspectives on Iran’s Electronic Prescription System: a Qualitative Inquiry. Front. Med . 11:1385256. doi: 10.3389/fmed.2024.1385256
Received: 16 February 2024; Accepted: 13 May 2024; Published: 04 July 2024.
Reviewed by:
Copyright © 2024 Arabian, Zakerabasali and Raee. This is an open-access article distributed under the terms of the Creative Commons Attribution License (CC BY) . The use, distribution or reproduction in other forums is permitted, provided the original author(s) and the copyright owner(s) are credited and that the original publication in this journal is cited, in accordance with accepted academic practice. No use, distribution or reproduction is permitted which does not comply with these terms.
*Correspondence: Somayyeh Zakerabasali, [email protected]
Disclaimer: All claims expressed in this article are solely those of the authors and do not necessarily represent those of their affiliated organizations, or those of the publisher, the editors and the reviewers. Any product that may be evaluated in this article or claim that may be made by its manufacturer is not guaranteed or endorsed by the publisher.
IMAGES
VIDEO
COMMENTS
INTRODUCTION. In our previous article in this series, [ 1] we introduced the concept of "study designs"- as "the set of methods and procedures used to collect and analyze data on variables specified in a particular research question.". Study designs are primarily of two types - observational and interventional, with the former being ...
The purpose of this blog post is to provide a brief description of descriptive research design including its advantages and disadvantages and methods of conducting descriptive research. What is Descriptive Research? Descriptive research is a process of systematically describing and analyzing something's features, properties or characteristics.
As discussed earlier, common research methods for descriptive research include surveys, case studies, observational studies, cross-sectional studies, and longitudinal studies. Design your study: Plan the details of your study, including the sampling strategy, data collection methods, and data analysis plan.
Disadvantages of Descriptive Research Design 1. Limited Scope. Descriptive research only provides a snapshot of the current situation and cannot establish cause-and-effect relationships. 2. Dependence on Existing Data. Descriptive research relies on existing data, which may not always be comprehensive or accurate. 3. Lack of Control
Usually, the cross-sectional or transectional design is the most used to carry out this type of research, although it is also possible to use the pre-experimental design. Advantages and disadvantages of descriptive research. Descriptive research design. The research design is used to draw up the work plan to follow in the research.
Descriptive studies describe the characteristics of interest in the study population (also referred to as sample, to differentiate it from the entire population in the universe). ... Researchers need to understand the features of different study designs, with their advantages and limitations so that the most appropriate design can be chosen for ...
Research design Goal Advantages Disadvantages; Descriptive: To create a snapshot of the current state of affairs: Provides a relatively complete picture of what is occurring at a given time. Allows the development of questions for further study. Does not assess relationships among variables. May be unethical if participants do not know they are ...
Descriptive research is a methodological approach that seeks to depict the characteristics of a phenomenon or subject under investigation. In scientific inquiry, it serves as a foundational tool for researchers aiming to observe, record, and analyze the intricate details of a particular topic. This method provides a rich and detailed account ...
Descriptive research design. Descriptive research design uses a range of both qualitative research and quantitative data (although quantitative research is the primary research method) to gather information to make accurate predictions about a particular problem or hypothesis. As a survey method, descriptive research designs will help ...
Descriptive research aims to accurately and systematically describe a population, situation or phenomenon. It can answer what, where, when, and how questions, but not why questions. A descriptive research design can use a wide variety of research methods to investigate one or more variables. Unlike in experimental research, the researcher does ...
The advantages of descriptive research are that it can be qualitative or quantitative, provide rich information, observation of subject in natural environment, and it is cost-effective. The disadvantages of descriptive research are that it can be biased, provide misleading information, and/or have representative issues and limited scope.
Advantages and disadvantages of qualitative descriptive studies. A qualitative descriptive study is an effective design for research by practitioners, policymakers and students, due to their relatively short timeframes and low costs.
One of the first steps in planning a research study is the choice of study design. The available study designs are divided broadly into two types - observational and interventional. Of the various observational study designs, the descriptive design is the simplest. It allows the researcher to study and describe the distribution of one or more ...
Descriptive studies have the following characteristics: 1. While descriptive research can employ a number of variables, only one variable is required to conduct a descriptive study. 2. Descriptive studies are closely associated with observational studies, but they are not limited with observation data collection method.
the advantages and disadvantages of each study design, it is important to understand what is meant by the terms 'descriptive', 'analytical', 'observational', and 'interventional', as used to classify the different types of study. CLASSIFICATION OF STUDY DESIGNS Descriptive study designs are useful for simply describing the ...
The descriptive research design involves using a range of qualitative and quantitative research methods to collect data that aids in accurately describing a research problem. Descriptive research design is a type of research design that aims to systematically obtain information to describe a phenomenon, situation, or population.
A descriptive study design is a research method that observes and describes the behaviour of subjects from a scientific viewpoint with regard to variables of a situation (Sharma, 2019). Here, the ...
Table 2.2. Characteristics of three major research designs; Research Design Goal Advantages Disadvantages; Descriptive: To create a snapshot of the current state of affairs. Provides a relatively complete picture of what is occurring at a given time. Allows the development of questions for further study. Does not assess relationships among ...
Descriptive studies have several important roles in medical research. They are often the first foray into a new disease or area of inquiry—the first scientific "toe in the water". 1. They document the health of populations and often prompt more rigorous studies. Since descriptive studies are often reported, 2.
Descriptive studies are frequently the first step into a new line of enquiry, and as such have an important role in medical research, where their findings can prompt further study. Their function is to describe the "who, what, why, when, where" without regard to hypothesis, highlighting patterns of disease and associated factors.
An innovative research tool, descriptive research is used by researchers as an opportunity to fuse both quantitative and qualitative data to reconstruct the "what is" of a topic. Descriptive research has advantages and disadvantages with researchers accounting for positive and negative variables.
The Disadvantages of Descriptive Research. Though, descriptive research has quite great advantages, however, it is often criticized for its disadvantages. Here, are some of the disadvantages of Descriptive research: One of the main disadvantages is that it can be difficult to design a study that is relevant to the researcher's specific interests.
A descriptive research aims to describe a phenomena the ways it is, for example, describing social systems or relationships between events (Adams et al., 2007). This paper attempts to introduce descriptive analysis; its advantages, disadvantages an example of Descriptive Analysis and conclusion. The next section introduces Descriptive Analysis.
The structural functionalist perspective offers several advantages in understanding society and its systems. It focuses on the interdependence and stability of social structures, highlighting their functions and contributions to the overall functioning of society.. However, this perspective also has its limitations.
Methods: This study used a qualitative research design, utilizing individual and semi-structured interviews with patients referred to selected pharmacies across all 11 districts of Shiraz City. The data were analyzed using MAXQDA software (version 10), and descriptive statistics for demographic data were calculated using SPSS version 19.